Mortgage Stress in Australian Real Estate: What You Need To Know

Are you prepared for the effect that mortgage stress can cause in the Australian real estate market? Whether you’re an experienced investor or an agent, it’s crucial to understand the intricate dance of factors at play within the property market, and mortgage stress is a significant part of that mix. This article pulls back the curtain on mortgage stress, revealing its hidden impacts on property values, shining a spotlight on the most affected suburbs, and underlining the vital importance of examining mortgage stress at the local-level.

Aerial view of outer suburb in Melbourne, Australia.
Photo by Tom Rumble on Unsplash

What is Mortgage Stress?

Mortgage stress is a financial situation where homeowners spend 30% or more of their pre-tax income on mortgage repayments. According to the Australian Bureau of Statistics, when housing costs exceed this threshold, households may struggle to afford other essential living costs. While the specific percentage can vary, this 30% figure is a commonly accepted benchmark. This stress can lead to financial hardship, and in severe cases, may result in the inability to meet mortgage payments, leading to foreclosure.

What Impact Does Mortgage Stress Have on Property Values?

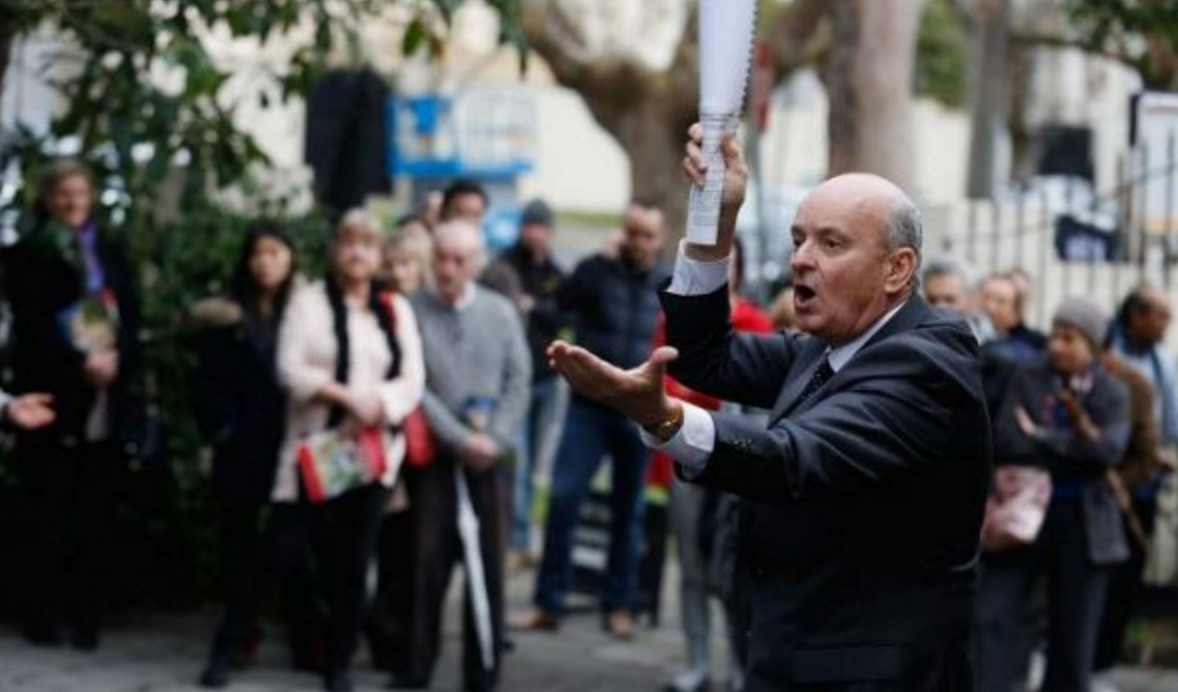
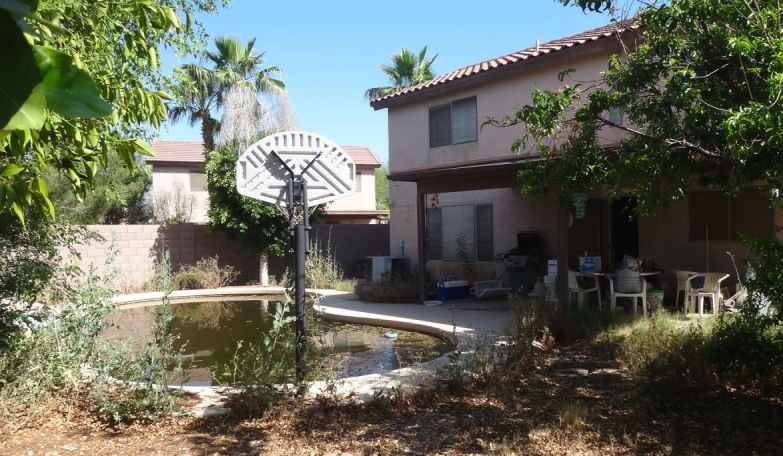
Mortgage stress can have significant repercussions on property values and the broader real estate market. When a large number of homeowners experience mortgage stress, it increases the supply of properties on the market, as distressed homeowners may be forced to sell. This oversupply can lead to a decrease in property values.

For instance, the Global Financial Crisis in 2008 witnessed a surge in mortgage stress levels, causing a temporary dip in Australian property prices. The negative effect of mortgage stress on property values can create opportunities for savvy investors to snap up undervalued properties. However, it also introduces more uncertainty into the market, making careful risk assessment crucial.

Why is it Important to Look at Mortgage Stress on a LGA-Level?

Examining mortgage stress on an LGA-level provides granular insight into the local housing market conditions. Each LGA has unique economic factors, housing supply and demand, employment rates, and demographics influencing its mortgage stress levels.

For instance, an LGA with a high unemployment rate might experience increased mortgage stress levels in the future. This level of detail can enable property investors to make informed decisions. It helps in identifying potential risks and opportunities, understanding local market conditions, and devising effective investment strategies. Tools like Microburbs can help explore these specifics.

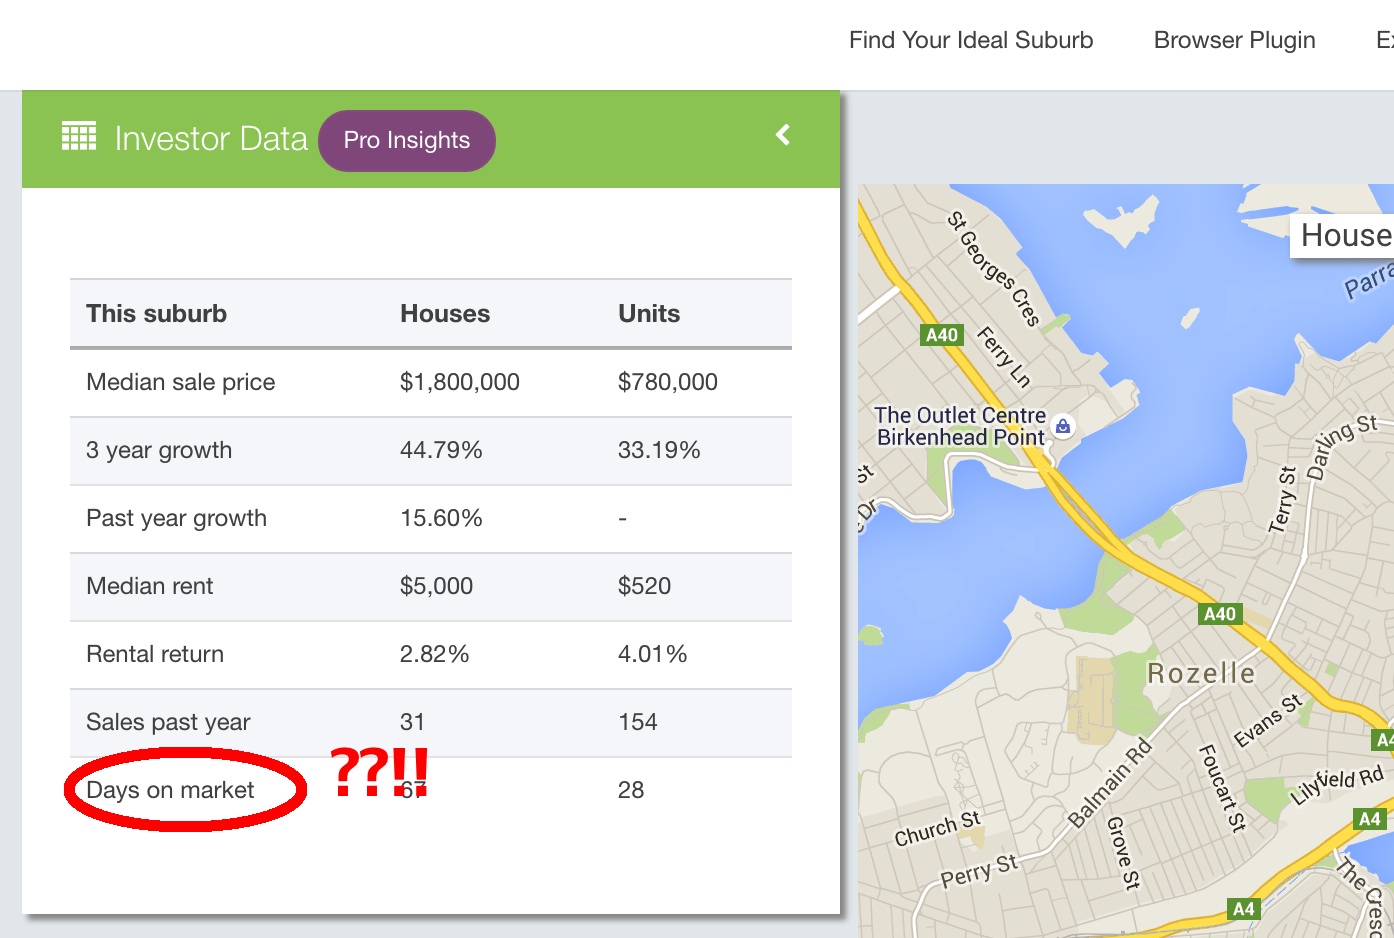
To deepen our understanding of mortgage stress and its implications on property investments, let’s take a look at three critical indicators provided by Microburbs. These metrics can empower investors and buyers agents with nuanced perspectives on mortgage stress at a granular level.

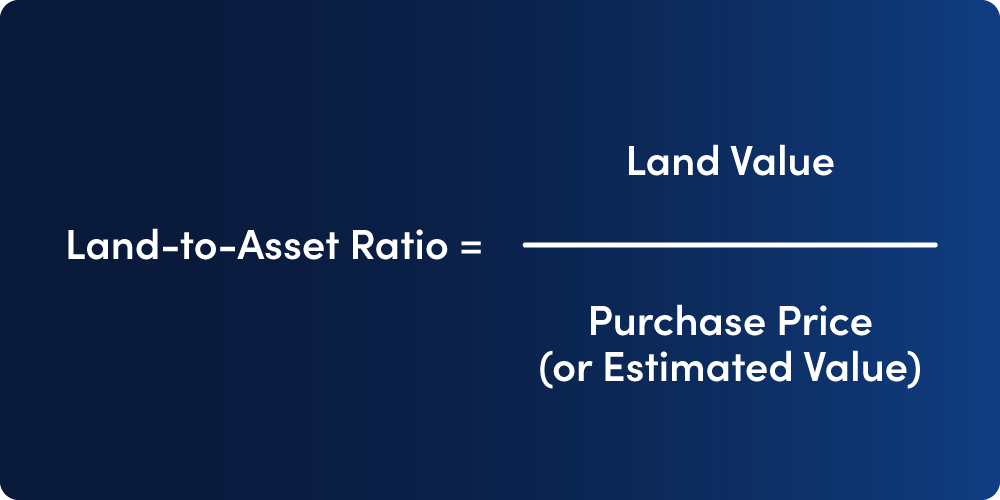
  • Mortgage as a Percent of Income: This metric represents the portion of a household’s pre-tax income used for mortgage repayments. It provides a snapshot of the potential affordability issues within a specific suburb.
  • Mortgage Non-Stress (LGA): This metric indicates the percentage of households within a Local Government Area (LGA) spending less than 30% of their pre-tax income on mortgage repayments. A higher percentage of non-stressed households can suggest a more stable real estate market, potentially making it a safer investment area.
  • Mortgage Stress (LGA): Conversely, this metric shows the percentage of households in an LGA spending more than 30% of their pre-tax income on mortgage repayments. Areas with high mortgage stress could be facing economic challenges or over-inflated property values. This could potentially create investment opportunities for savvy buyers or pose additional risks.

Annual Income Needed to Avoid Mortgage Stress in Capital Cities

Average income earners in Australia are unable to afford a house in a capital city without plunging into immediate mortgage stress. This table illustrates the annual household income needed to comfortably afford a house in various Australian capital cities. It’s calculated based on the most recent Smart Median Sale Prices and the standard variable interest rate.

Smart Median Sale PriceDeposit (20%)Monthly Repayments (6.44% Var. Rate)Annual Household Income needed to avoid Mortgage Stress (Pre-tax)
Sydney$1,940,000$388,000$9,749$680,133
Melbourne$1,460,000$292,000$7,337$498,667
Brisbane$1,040,000$208,000$5,227$339,920
Perth$782,000$156,400$3,930$242,340
Annual Income Needed to Avoid Mortgage Stress in Capital Cities, Microburbs

What Suburbs in Each State Experience the Greatest Mortgage Stress?

Mortgage stress varies across states and suburbs in Australia. Here are a few examples:

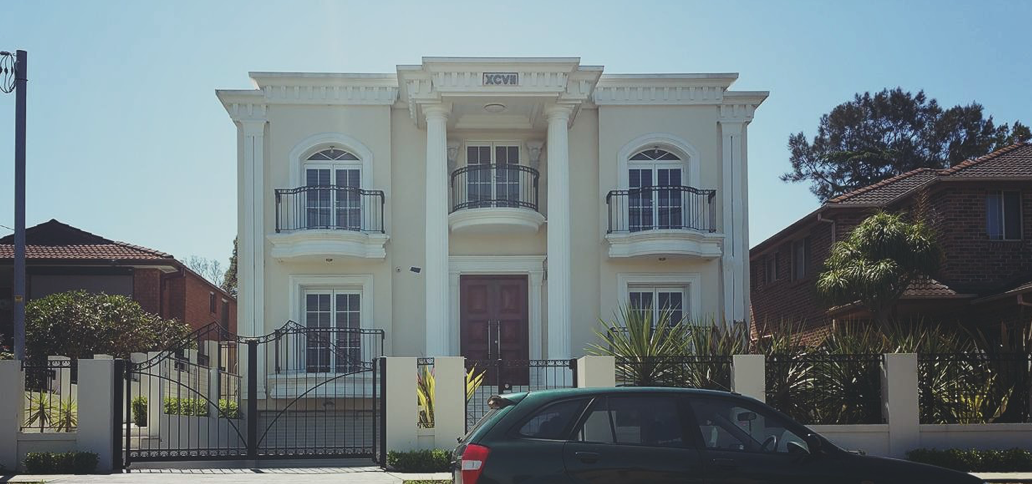
  • In New South Wales, Western Sydney suburbs like Villawood, Yennora and Granville have high levels of mortgage stress.
  • In Victoria, the outer suburbs of Melbourne, including Ravenhall and Woodstock, are significantly impacted.
  • In Queensland, Caboolture and its surrounding suburbs have reported higher mortgage stress levels.

Mortgage stress is a critical factor affecting the Australian real estate market. Understanding its impacts and how to mitigate its risks can provide investors and agents with a competitive edge. Always remember, thorough research and careful planning are keys to successful property investment in these complex market conditions.

Understanding Land-to-Asset Ratio: A Key to Australian Property Investment

Navigating the Australian real estate market can be a daunting task, but understanding key metrics like the land-to-asset ratio can guide your path to successful property investment. This post will provide insights into the importance of the land-to-asset ratio, how it’s calculated, and how it can impact your potential return on investment.

Aerial view of Melbourne, Australia during the daytime.
Photo by Pat Whelen on Unsplash

What is the land-to-asset ratio?

The land-to-asset ratio is a real estate valuation measure that compares the value of the land on which a property stands to the total value of the property – including the land, buildings, and any improvements. This ratio is particularly useful to property investors and agents as it helps determine the intrinsic value a piece of land holds in a property, thereby influencing its potential for appreciation and impact on returns.

How is the land-to-asset ratio calculated?

The formula for calculating the land-to-asset ratio is very straightforward:

Land-to-Asset Ratio = (Value of Land / Total Value of Property) x 100%

The formula for calculating land-to-asset ratio.

Consider two properties, both valued at $500,000, but with different land values:

Property AProperty B
Land Value$300,000$200,000
Purchase Price (or Estimated Value)$500,000$500,000
Land-to-Asset Ratio60%40%

Property A, with a higher land value, has a higher land-to-asset ratio. This higher ratio can potentially offer better capital growth prospects due to the inherent value of the land. However, as we will discuss further, the ideal ratio is influenced by various factors.

What is the ideal land-to-asset ratio?

While there’s no universal ‘magic number’, from an investment perspective, try to aim for an asset where the land represents at least 70% of the property’s value. In a pinch, don’t settle for anything below 50%. But remember, real estate isn’t a game of absolutes – the ‘perfect’ ratio depends on your unique financial goals, risk appetite, and market dynamics.

How does land-to-asset ratio impact the potential return on investment?

Land tends to appreciate over time, often at a faster pace than the value of the building or improvements. Therefore, a property with a higher land-to-asset ratio can potentially offer higher capital growth, leading to increased returns on investment. Furthermore, the potential for redevelopment or subdivision can also add to the investment’s value.

What are the drawbacks of properties with high land-to-asset ratios?

While properties with high land-to-asset ratios can offer more significant capital growth potential, they are not without their drawbacks. Firstly, such properties may have higher upfront costs, requiring a larger initial investment.

Additionally, because the value is tied more to the land, improvements or renovations to the property may not contribute significantly to its overall value. This might limit the profitability of value-adding strategies.

Compared to properties teeming with improvements, a high land-to-asset ratio property might also fetch you less rental income, potentially dampening your cash flow.

Modern two-storey home viewed from street level.
Photo by Brian Babb on Unsplash

How does the land-to-asset ratio impact the maintenance costs and depreciation of a property?

Properties with lower land-to-asset ratios often mean that a larger portion of the property’s value is tied to the building or improvements, which depreciate over time. These properties also come with higher maintenance costs. 

On the other hand, land, which contributes to a higher land-to-asset ratio, requires little to no maintenance, reducing the overall running costs.

How does the land-to-asset ratio vary across different property types and suburbs?

The land-to-asset ratio can significantly vary across different property types and suburbs. Detached houses often sport higher ratios than apartments or units, where you’re paying more for the building than the land. Similarly, the land-to-asset ratio can swing wildly from one suburb to another, juggling factors like proximity to the city centre, local amenities, and demand-supply dynamics. Luckily, tools like Microburbs can help you decode these local market dynamics.

Why Are Median and Quartile Land-to-Asset Ratios for a Suburb Relevant?

The median land-to-asset ratio for a suburb gives you a snapshot of the ‘average’ property landscape, acting as a key guide to inform your investment strategy. 

The 25% and 75% land-to-asset ratio quartiles add another layer to the story. They provide a more nuanced view of the property distribution, providing a framework for potential bargains and premium properties. A wide spread between these quartiles indicates greater variability in property types and potential investment strategies. A lower 25% quartile might indicate more affordable investment opportunities, while the 75% quartile can reflect properties with high land value – potential goldmines for capital growth.

In the end, understanding the land-to-asset ratio is like unlocking a secret level in the game of Australian real estate. Sure, it’s not the be-all and end-all, but combined with other factors such as location, market conditions, and your personal financial goals, it can be a game-changer.

Breaking News: RBA Announces Another Rate Hike, Sending Shockwaves through the Australian Economy

In breaking news, the Reserve Bank of Australia (RBA) has just announced another rate hike for June, increasing the cash rate by 25 basis points to 4.10%. The decision comes amidst concerns over high inflation and an overheating housing market, prompting the central bank to take action to rein in borrowing and spending.

This move comes as no surprise to analysts who have been closely watching the RBA’s policy decisions. The central bank has been signaling for some time that it may need to take action to cool down the economy, which has been running hot in recent months. With unemployment at a low rate of 3.7% and award wages set to rise 5.75% from July 1st, the board remains alert to the risks of ongoing high inflation.

In a statement, RBA Governor Philip Lowe said that the rate hike “is to provide greater confidence that inflation will return to target within a reasonable timeframe”. He noted that further rate hikes may be required in the coming months to ensure that inflation returns to target.

The decision has been met with mixed reactions, with some economists hailing it as a necessary step to curb inflation, while others warn of the potential negative impact on households and businesses.

The rate hike will have a significant impact on mortgage holders, with many borrowers set to face higher monthly repayments. The average Australian borrower will now be paying an additional $15,000 per year in repayments compared to 12 months ago.

Overall, the RBA’s decision to raise interest rates for the second time in as many months is a clear indication of the central bank’s determination to keep inflation under control. While the move is likely to have some short-term negative impacts on households and businesses, it is hoped that it will ultimately help to ensure a more stable and sustainable economic future for Australia.

6 Reasons People Will Own Their Own Self-Driving Cars

Cars for kids, movie-length commutes and mega-garages. What the strange new world of self-driving cars means for you and your property.

There’ll be far more cars in future, not less!

There’s a lot of excitement at the moment about self driving cars and how they’ll transform cities to become far more efficient. Futurists say the rapidly approaching self driving cars will bring an end to car ownership. Consumers will wake up to how much more efficient it is to just “rent from the cloud”. Parking spaces, wide roads and garages will give way to more productive urban uses and everyone will get to where they want to go faster.

That would certainly be efficient for urban modelling people but I just can’t see that happening. Consider these 5 points: 

  1. Cars are about status and comfort

First, it’s not getting from A to B that you pay for. In India, you can buy a new car for $5,000. The cheapest available car in Australia is about $11,000. The fact that there isn’t even a market for cheap cars tells you something about what cars are really for.

An Indian family car costs as little as $5000.

An Indian family car costs as little as $5000.

How many 4 wheel drive ads talk about urban planning or even fuel efficiency? No, they feature jealous pedestrians, self-assured upper middle-class drivers free to roam and explore.

Most people don’t see your beautiful home but wherever you show up, if driverless taxis really take off, people will be ask if it’s yours, just like they ask if you own your home or rent.  

2. Cars will become personalised comfort pods

Cars are already our mobile homes. They have your spare pair of glasses, a soccer ball for the kids, some emergency suncream. But imagine what they’ll be like when they’re also your super-comfortable home cinemas, bedrooms and offices. Soon you’ll be able to catch up on your favourite TV shows without any danger of carsickness as the road is still there behind you. In fact, a really smooth drive would be a selling point of self-driving cars. You could enjoy a movie on the way to work but half a movie is only half as satisfying. This is not far off. You can already buy windscreen heads up displays today:

Screen Shot 2017-01-18 at 9.45.00 am

If you’re feeling diligent, your work day could start the moment you sit down at the (now comfortably absent) wheel. Or if you’re not a morning person, it’ll be your mobile sleep pod.

It’ll be your zone, customised to you. It wouldn’t be as cozy spending 90 minutes in a taxi. The longer you spend in a car, the more status and comfort will become important.

You want a home, not a hotel room. You already have the garage space. Why convert it to a rumpus room that never gets used when it could house your new prize possession?

  1. Car ownership won’t be limited to drivers anymore.

Currently only drivers have cars. The young, the old, the disabled and the fearful are excluded from this and by extension they’re not full participants in the suburban dream. For millions of people, driverless cars brings the exciting prospect of owning a car for the first time.

  1. Advertisers will make you want one

There’s far more money to be made in selling everyone their own car. Capitalism has been very good at getting people to own things they don’t rationally need. Does your street really need more than one lawn mower? You buy single-use objects like books when you could borrow them for free from the local library.

Are you going to feel safe at high speeds in some taxi with hundreds of thousands of kilometres on it? Whether or not private cars will actually be safer, advertisers will tell you so. Your child is much safer on a public bus but that doesn’t stop parents picking their kids up from school and exposing them to the biggest killer of young people: car accidents. There’s a fundamental belief now shared by all classes that privately owned cocoons are safe and the public sphere is dangerous. Perhaps it’s not that likely you’ll sit on a used drug needle in a driverless taxi, but you can bet the media will let you know when it happens.  

Two visions of the future, one with decidedly more consumer appeal.

Two visions of the future, one with decidedly more consumer appeal.

  1. Advertisers will make you want several!

Sometimes you need an 8 seater to transport the family, the dog and the daughter’s best friend. Sometimes your son wants to go out hooning. Sometimes you want to weave through dense traffic to work and that width really slows you down.

Yet most homes only have one car per driver – a compromise vehicle that’s rarely the right vehicle for the job. Why? Driving ability! You don’t want your teenage son driving a sports car. You don’t own a bus license. You don’t think motorcycles are safe.

With self driving cars, your options are limited only by your imagination. Sports cars will be marketed at 12 year old boys. Beauty spa cars will be marketed at mums. Older people will be be enticed to own classic cars that were hard to drive. Some cars will be all about sending your kid to dance class and keeping them safe and stimulated on the way. Touring will be much more pleasant in the future, so there’ll be holiday cars too, addressing a larger market than currently buy RV’s and caravans.

Advertisers sell personal choice, freedom, status and comfort. Their job will actually be much easier in the era of driverless cars. There’s nothing authentic or special about being carted around in a headless public taxi.

With so many more uses, and no need for a responsible driver, it all adds up to more time on the road. We already know prolific drivers own more cars.

  1. There’ll be much more space to garage all those extra cars

The rise of the comfort pod vehicle will make outer suburbs and satellite cities far more attractive. The further you go out from a city centre, the more supply there is. In this future, all existing residential house owners will lose and farm owners within 90 minutes of the city could massive windfalls.

And this is even before you take human drivers off the road, when self driving cars have to stay slow and follow road rules to avoid accidents. Once the humans are gone, cars will sail through intersections in all directions and accelerate as fast as the passengers can bear.

Just as the car lead to much lower density housing further from the city centre, the speedy self-driving car will give people even more land to share. Big land calls for big houses. And what major lifestyle change determine which room grows in size? The self driving car.  

So what does this mean for property owners?

So self driving cars won’t be creating space-efficient suburbs. There’ll be more cars and   even more parking spots: Instead of dropping your daughter off at piano lessons, you’ll be able to send her off in the self driving car. That car will stay parked there, dutifully waiting for your daughter like you have your own private driver.

This is good news for property owners too. If the future did go rental, governments would start eyeing all that unused land on suburban streets – roads that no longer need parking or buffer zones. You and your neighbours will want it turned into public land to protect your area’s privacy, tranquillity and character. But developers will be very keen to get in on your sought-after street, so expect some serious urban consolidation too. This would be a nightmare for property owners, as every part of every city would be inundated with new supply.
So far from creating a communal hub of common property with a public fleet of cars, self-driving cars will make people more suburban than ever – with bigger houses further from the city and more cars. Buckle up!

5 Real Estate Euphemisms That Need To Die, Now.

As property investors we all tolerate and enjoy some tired euphemisms. ‘Renovator’s Dream’, ‘Cosy’ and ‘Full of character’ have become old jokes as we wised up to them. At the same time though, we can unwittingly swallow a lot of nonsense fed to us by marketers, commentators and other investors. Some of these clichés have got under my skin recently and it’s time to give them a blast.

“Great for first-time investors”

This phrase implies that the property is not so great for seasoned investors. Would the real estate agent or developer advise against experienced buyers getting involved?

Not meaning to be rude sir, but you already have five properties, so this wouldn’t suit you. It would suit someone with less experience, a novice, …someone gullible perhaps.

Any property which is a good deal for a first time investor is an equally good prospect for an experienced investor. This phrase just gives the inexperienced an undue confidence boost.

“Are you negative gearing it?”

Gees I better check. Did I mismanage this property such that it is positively geared by mistake?

Dear tenant, it has come to my attention that your rent is so high that I have failed to ‘negatively gear’ this property, and I will need to reduce your rent.

First of all, nobody in their right mind sets out to negatively gear a property and is then surprised to find it’s not making them a loss after all. If this happens to you, congratulations! Add this positively geared property to your portfolio and go try again to buy something that loses money.

Second, the term applies to the outcome, not the strategy. You add up the income and subtract from that all the expenses and if the final number is negative, then the property is negatively geared. You don’t really make a management decision to “negatively gear it” – it comes out “negatively geared”.

“To be honest with you…”

Look, to be honest with you, I have several other interested parties who are ready to make an offer…

Should I be cautious of someone who qualifies a statement with, “To be honest with you…”? Does that mean every other statement they make without that qualification is dishonest?

At least it’s nice of them to let me know when they are telling the truth?

“Long term gainer”

Property has great long term prospects! (Don’t expect to make any money in the short term.)

How long is “long”? How long will I have to wait for that to come true and what happens in the meantime? What does this clairvoyant real estate agent know about the property market that I don’t?

This comment is a reflection of the agent’s opinion about short-term growth prospects – that they’re not great. After all, how can anyone truly know what will happen in the distant future to prices in any market? We may all be living in The Matrix and not even need properties in the future.

“This location will always be in demand”

Don’t be lured in by this phrase. It is technically correct but not helpful for investors.

There are locations that for a very long time have been highly prized by owner occupiers. These are the most expensive places to live in capital cities around the country. But merely wanting to own in such locations, doesn’t affect their prices.

A 14 year old boy will want a Ferrari for example, but that kind of demand doesn’t affect the price of Ferraris. The kind of demand we investors needto see is the kind of demand that actually affects prices, people bidding at auction, turning up to open homes and making offers.

This kind of demand is the very reason why I created the DSR score.

To cut through the euphemisms, get the facts on any property for free with a Microburbs report.


For press enquiries about this article, please call Microburbs Founder Luke Metcalfe on 0414 183 210.

Can’t Get A Great Halal Snack Pack? Sell Your House.

The Halal Snack Pack, for those who have somehow missed it, is a kebab store dish on the rise. From the massive online Halal Snack Pack Appreciation Society, to TV stunts between politicians, it’s not just a trending snack food but a symbol of Australian multiculturalism. It is best described as a dish containing halal-certified doner kebab meat, hot chips and the ‘holy trinity’ of sauces – chilli, garlic & barbeque.

(Senator Sam Dastyari – Photo by SBS)

The snack sensation is even set to cross over into real estate. The most Muslim dominated suburbs have also seen property prices increase by 37% nationally, smashing the national average, and ‘buy near a great Halal Snack Pack shop’ might be the best, weirdest investment advice of 2016. 

We’ll focus on three Sydney suburbs that have had the best rated HSP in Australia and give a very brief overview of unique investment strategies for each one. These strategies are to give examples of the potential in these areas and are general information only. It’s important to consider your individual needs and get qualified advice before making any big decisions. 

Campbelltown – Granny Flats

Suburb: Campbelltown

Growth: 14.1%

Best HSP: King Kebabs

Strategy: Granny Flats

Free Microburbs Report: Here

King Kebabs Campbelltown is currently Sydney’s no.1 spot for HSP. Coincidentally, Campbelltown is also a sleeping giant in terms of property investment.

Located on the southern edge of metropolitan Sydney, C-town has had 14.1% growth in the past year. The key selling point for investment is that some of the older houses with large land sizes have the potential for granny flats to be built on them. The key benefit of building granny flats is that you can secure rent from both the tenants of the original house and the new granny flat at the same time. In today’s low interest rate environment, this investment can pay itself off and in many cases be positively geared.

What makes Campbelltown attractive is that the median house price is $580,000, nearly half the Sydney median.

It is possible to buy relocatable/portable granny flats from $80,000 (plus council contribution) including installation costs. Watch out for super low priced relocatables which may leave out major installation costs plus other essentials.

If you want to build on site, average costs range from $100,000 – $120,000 which doesn’t include council contributions that vary council to council.

The maximum size for a 2 bedroom granny flat is 60sqm. Additionally, the granny flat will need to be located at least 3m from the house, 3m from the back fence and 1m from the side fences.

If you’re concerned about being able to find tenants this far from the city, our data shows Campbelltown has a family score of 8/10. This is characteristic of suburbs in outer western Sydney where many families prefer the larger availability of day-care and schools (compared to the inner-west).

Blacktown – Duplexes

Suburb: Blacktown

Growth: 11.5%

Best HSP: Kebab Express Blacktown

Strategy: Duplexes

Free Microburbs Report: Here

Kebab Express Blacktown is another top rated HSP location, and my personal favorite. Whilst they sadly no longer offer Shisha, it is open until midnight for all your late night banter.

For investment, the southern parts of Blacktown contain many properties with large land size and small houses. These properties are often over 1000sqm. Apart from the potential for granny flats, this also opens the opportunity for building a duplex or subdiving into two lots.

Once built, a duplex can then be strata titled and sold off individually for a great return. Whilst there are plenty of risks that could come into this, this strategy has been quite popular with investors across Australia in recent years.

Another strategy is to subdivide the property into two lots, build a duplex at the back lot, sell the old house at the front lot and rent out the new houses.

Despite the myth that Western Sydney has no culture, Blacktown has a Microburbs lifestyle score of 8/10, and our comprehensive report shows why. The Westpoint shopping centre has plenty to see and do, and there’s a great diversity of restaurants, including Ethiopian, Italian, Indian, Mexican and more. The motorway junction also makes Blacktown quick to reach by road from any side of Sydney. 

Kingswood- Rooming Houses

Suburb: Kingswood

Growth: 13.7%

Best HSP: Pizza Stop Kingswood

Strategy: Rooming Houses

Free Microburbs Report: Here 

Located near Penrith is the well known ‘Pizza Stop Kingswood’ which consistently gets 10/10’s on the HSPAS page.

With a three bedroom median house price of 590k and growth rate of 13.7%, it is a great opportunity for first time investors in one particular strategy known as rooming houses.

Located between the large Nepean hospital in Penrith and the Western Sydney University campus, there will be large demand from tenants seeking affordable options.

Simply put, rooming houses are a type of rental set-up where in a single house, each room is rented out to separate tenants. This strategy can be applied to any house, but during your research remember to check with the following agencies to be clear on the different rules for each council:

  • Local council
  • Department of Fair Trading
  • Residential Tenancy Act
  • Department of housing NSW

A tip for investors is to find a trustworthy handyman and build a good a good relationship with them. With all your properties, you’ll need someone who can fix things reliably and give their own advice on property management from a technical perspective.

If you would like to find out more about the investor data, hip score, safety score and much more about any suburb in Australia, you can search here: 

Also check out our other article about ethnic groups with the best real estate gains in Australia (spoiler: the Chinese aren’t no. 1.) 

For press enquiries about this article, please call Microburbs Founder Luke Metcalfe on 0414 183 210.

How Far Will You Have To Go? The Price of Proximity

Recently I had an exciting opportunity to sit down with acclaimed property investment coach Jane Slack-Smith. You may know Jane from the Your Property Success courses or her frequent media appearances. We got to talking about how Microburbs data can assist property investors, and she raised the very early step of finding areas that are in your target price range.

Melb_zoom

“It may seem fine to look at monthly reported information regarding median house prices in your local capital city”, said Jane, “but cities are made up of hundreds of suburbs. In some instances you may find that the older more established suburbs with bigger blocks have less properties and less residents compared to the many new development suburbs opening up on the outskirts of town. Just because the median for Brisbane seems cheap, does that mean you can get a blue chip property less than $600,000? The answer is no.” There is a ‘rule of thumb’ which can get you started, but it’s no substitute for hard data.

“Within 10km of the CBD I would add a margin of +20%, and within 20km, 10% of the median. This is because often by the sheer number of suburbs outside the 10km range compared to the number inside can greatly affect the median for those area. That is that there are many cheaper suburbs below the median in the outskirts that will bring the city median down, hence why I add that buffer. Being able to find out though what the real medians are within an area allows you to assess quickly if you can afford within 10km or even 20km of the CBD or if in fact you are looking at the outskirts.”

You can imagine how excited Jane was to learn that we can make that data available. Based on reported sales for 2016, we have profiled all of Australia’s state capitals to help you find an investment property that fits your budget.

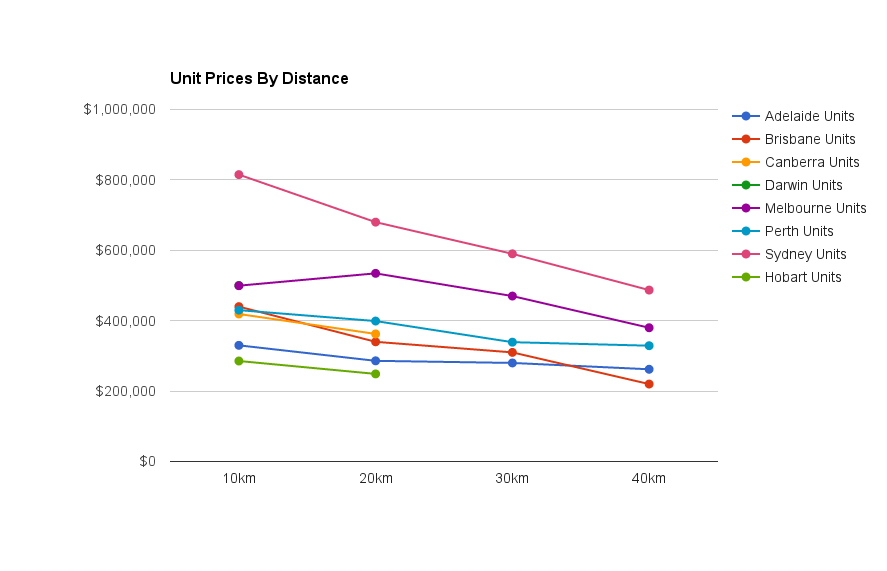
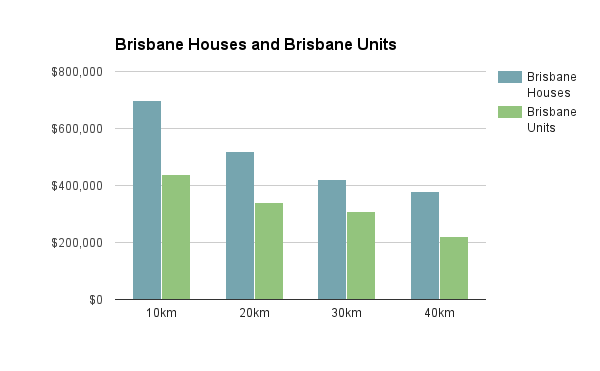
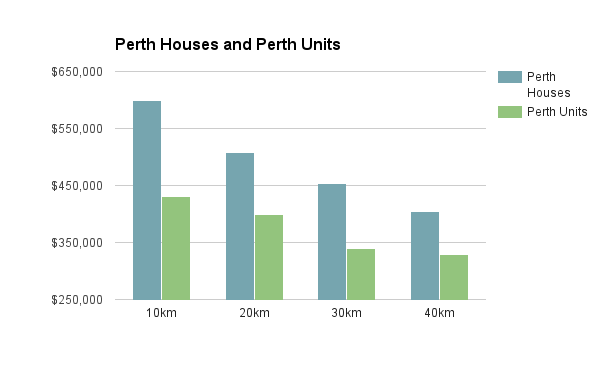
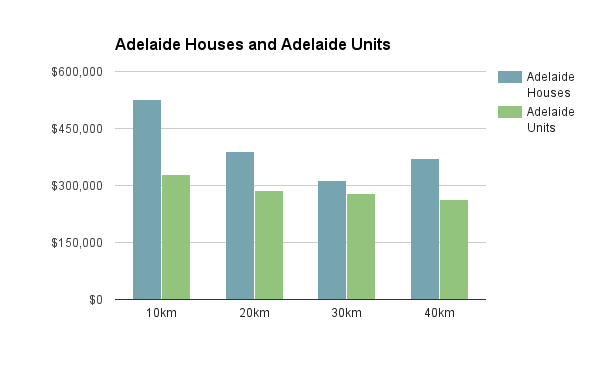
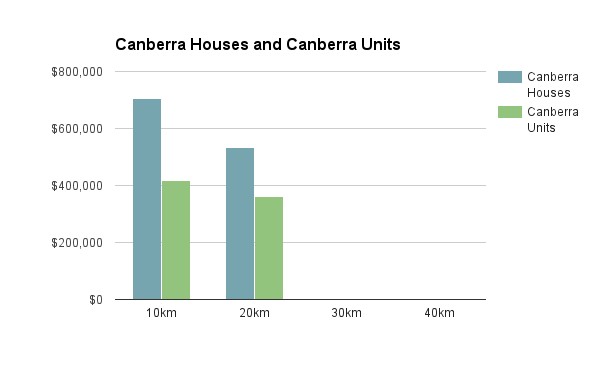
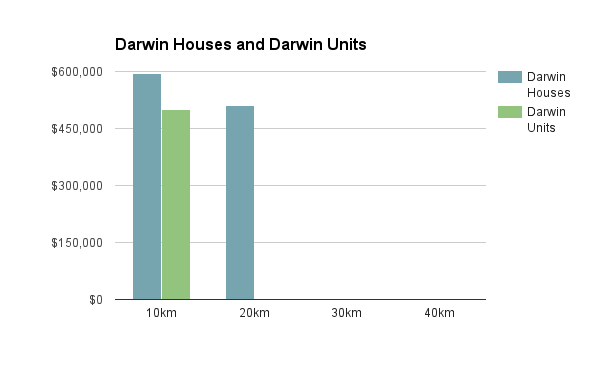
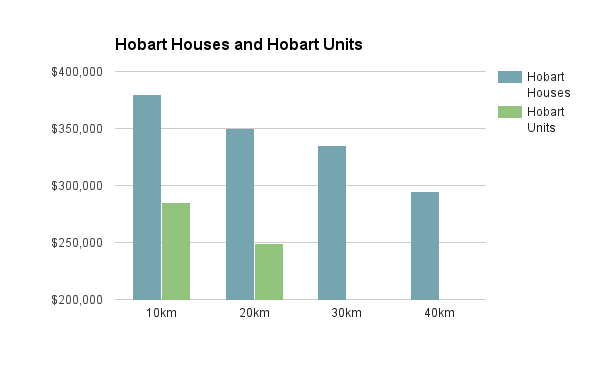
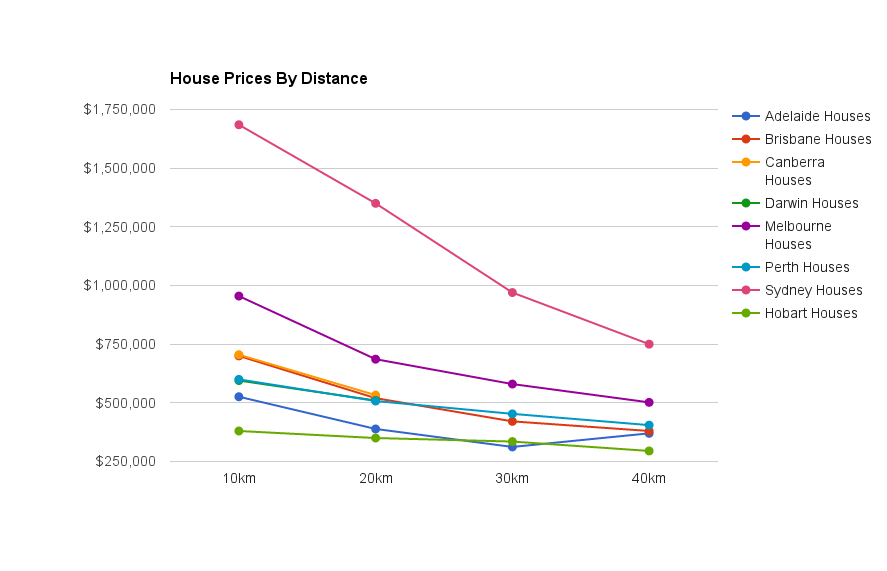
First we’ll look at house prices for all state capitals, grouped by whether they are 0-10km from the centre of the city, 10km-20km and so on. For instance, we can see that if we had a $600,000 budget, we could look at central Perth or Adelaide, 10-20km from the centre of Brisbane or Canberra, 20-30km from the heart of Melbourne and more than 40km from the middle of Sydney.

If we look at units rather than houses, the prices are lower overall and the curves are more closely matched. It’s interesting to see that units in the centre of Melbourne have a lower average price in the 10-20km band. This may be because units a little further out are larger. To normalise for the fact that properties tend to be bigger as we get further from the city, we’ve also done a chart of square metre pricing by distance to the city centre. This is a measure more commonly used with commercial real estate, but is basically just the purchase price divided by the size of the floor space of the property to give a price per square metre. This shows us that properties in the centre of Sydney are actually much more expensive than anywhere else in the country, in terms of the space you get for your money. We also see that distance effects on property prices are fairly uniform elsewhere, once property size is accounted for.

Area Prices

Sydney


Sydney

Sydney
Houses Units per Sq Metre
10 km $1,685,000 $815,000 $6,000
20 km $1,350,000 $680,000 $2,175
30 km $970,000 $590,000 $1,528
40 km $750,000 $487,000 $1,286

Sydney’s peak of $6000 per square metre for residential space within 10km of the city centre is off the charts by national standards. The popularity of downtown Sydney is not just about proximity, but also the harbour and there are plenty of harbour views and even ocean vistas to be had in the 10km inner circle. Sydney’s sprawl extends even beyond the 40 km line, with residential areas 55+km from the city centre.

Melbourne


Melbourne
Houses Units per Sq Metre
10 km $955,000 $499,500 $2,160
20 km $686,000 $534,500 $1,313
30 km $580,000 $470,000 $1,062
40 km $502,000 $380,000 $768

Brisbane


Brisbane
Houses Units per Sq Metre
10 km $700,000 $440,000 $1,192
20 km $520,000 $340,000 $828
30 km $421,000 $310,000 $606
40 km $380,000 $220,000 $490

Perth


Perth

Perth
Houses Units per Sq Metre
10 km $600,000 $430,000 $1,099
20 km $507,750 $399,000 $861
30 km $453,000 $339,000 $697
40 km $405,000 $329,000 $513

Adelaide


Adelaide
Houses Units per Sq Metre
10 km $526,000 $330,000 $998
20 km $388,750 $286,000 $576
30 km $312,000 $280,000 $469
40 km $370,000 $262,000 $437

Canberra


Canberra
Houses Units per Sq Metre
10 km $705,000 $419,000 $939
20 km $532,900 $362,400 $825
30 km
40 km

Darwin


Darwin
Houses Units per Sq Metre
10 km $595,000 $500,000 $698
20 km $510,000 $694
30 km
40 km

Hobart


Hobart
Houses Units per Sq Metre
10 km $380,000 $285,500 $573
20 km $350,000 $248,850 $392
30 km $335,000 $250
40 km $295,000 $210

You can explore any city in Australia with Microburbs. To get started, search in the box below:

For press enquiries about this article, please call Microburbs Founder Luke Metcalfe on 0414 183 210.

RBA Cuts to 1.5% – Big 4 Customers Won’t Benefit, But You Can.

This week has seen the Reserve Bank of Australia cut the cash rate to a historic low of 1.5%. The announcement was not a surprise to many, with low inflation data signalling a likely cut in the lead up to the RBA board meeting.

What has been a surprise is the response from the big four banks. Rather than pass on the full rate cut to their mortgage customers, they reduced their standard variable rates by only half as much as the rate cut, and increased term deposit rates, rather than cutting them. More surprising still, was the swiftness and similarity of announcements by CBA and NAB, with Westpac and ANZ trailing after.


Many have been left feeling frustrated and powerless after being stuck around the 5.3% mark while the cash rate approaches zero. There are alternatives though, which dozens of lenders available outside the big 4 with much fairer rates. Mortgage holders can compare personalised offers from a wide range of lenders in 2 minutes without filling in application forms and navigating red tape. You can even give it a go right now.

It’s easy to brush off the idea of changing lenders for a rate cut as being not worth the hassle, but that couldn’t be further from the truth. A reduction in interest rate brings the power of compound interest over to your side. Every 1% per year on every $100K of your loan is $1000 a year into the household budget. Furthermore though, you save on the compound interest on that. A better rate can mean reaching financial freedom years earlier, building an investment portfolio while paying down your mortgage or having the money to travel again.

Get some offers in 2 minutes and look at how much you could save over the life of your loan.


8 Real Estate Investment Metrics You Need to Understand

With some analysts predicting that real estate price growth may slow down in Sydney and Melbourne, real estate investing in Australia may no longer be all hot markets and high demand. Understanding where markets are hot and cold, fast and slow, is about understanding supply and demand, yield, days on market and OSI. But what does that all even mean?

Microburbs founder, Luke Metcalfe sat down with Jeremy Sheppard from DSR Data to get plain english explanations for the most important real estate investment metrics.  In 2009, after building his career in IT and a portfolio of 16 properties, he launched DSR data to help make property investment more consistent and more effective for more people. Jeremy has been writing articles for Your Investment Property magazine since 2011, educating investors on how to use data to better their returns.

#1  “Vendor Discount”

This is the percentage difference between the original asking price and the eventual sale price. When a seller puts their property on the market, usually via real estate agent, they pick an initial asking price and it’s usually quite optimistic. Eventually the property sells – for a bit lower than that, usually – and that difference is, in percentage terms, your vendor discount. If we take the average vendor discount for all properties in a suburb, we can get a suburb vendor discount. 

Why it matters

In locations where demand exceeds supply you’ll find that the vendor discount becomes quite low. In fact, you can even find that it’s negative where people start offering more than the asking price if they’re fighting over each other to try and get their hands on the limited number of properties that are available. In markets where supply exceeds demand you might find a discount in excess of about 10%, normal markets might be around about 5% and in very tight markets it will be zero or even negative. So the vendor discount is a great indicator of markets where demand exceeds supply.

Days on Market ?

#2  “Days On Market”

This is the average count of the number of days it takes to sell a property once it is listed.

A real estate agent will list a property and people will come and visit it, they’ll look around and eventually someone will make a good offer and the vendor (the seller) will accept that offer and so the listing will be taken off the real estate’s portal etc. That period of time is the days on market.

Why it matters

The days on market generally gets very short in areas where demand exceeds supply. What happens is a whole bunch of people start competing over a small number of properties and they get desperate. They get urgent and so they try and get their due diligence done faster and they make quicker offers. They’re waiting for the next property to come on the market and they jump on it straight away so in high demand, low supply markets the days on market generally gets very small.

A typical sort of days on market might be around about 140 days, or about 3 and a bit months. Where it gets really tight is when you see days on market getting less than about 20 days. In some crazy markets where there is a massive oversupply you might see days on markets exceeding even a full year. So days on markets is a great indicator for demand exceeding supply when it’s a low figure.


Screen Shot 2016-07-17 at 5.44.44 pm

#3 “Auction Clearance Rate”

Is the percentage of auctioned properties that actually sell at the auction or immediately after or just prior, rather than passed in. If bidding is fierce, you’ve got a large number of bidders at an auction, you will always find that the property sells. In markets where demand exceeds supply, that’s sort of typical and you will have very high auction clearance rates.

Why it matters

In markets where supply exceeds demand you’ll find not only a poor auction clearance rate but also less auctions. That’s because real estate agents will typically only choose auctions as a means to selling a property when the market suits it, and when that suits their vendor. So you’ll find high auction clearance rates when demand exceeds supply, low auction clearance rates and low counts of auctions in markets where supply exceeds demand. So the auction clearance rate and the number of properties sold by auction are excellent indicators of demand versus supply.

#4 “Proportion Of Renters To Owner Occupiers”

The proportion of renters to owner occupiers is the percentage of properties with residences that are renting but don’t actually own a property, so this can be a good indicator of supply levels for landlord-owned properties. As a property investor you are also a landlord – you will own property and you’ll rent it out to a tenant.

Why it matters

If you’re competing with other landlords then you may experience extended vacancies. You don’t want to have to compete, so you want to be ideally the only landlord in a local property market. That means you’re looking for markets where there’s a lower percentage of renters and you want most of them to be owner occupiers. Renters typically take less care of their properties than owner occupiers, so you may find the properties devalue a little bit more quickly in markets where there’s a heavy percentage of renters.  Overall you ideally want a market with the lowest possible proportion of renters to owner occupiers.

#5 “Vacancy Rate”

This is the percentage of properties that are available to rent in a suburb that are currently vacant, so if you’ve got about 1000 properties in a suburb, and lets say 300 of them are owned by property investors, rented out to tenants, and then if you have 30 of those that are currently vacant than you have a 10% vacancy rate, which is a whoppingly high vacancy rate.

Why it matters

Vacancy rates are typically around about 2% – 3%. Anything less than about 2% is a helpful margin because as an investor obviously you don’t want to have a property that is vacant for a long period of time. So you’re looking for markets where there’s a vacancy rate as close to zero as possible. If it needs to be checked, a rough figure for vacancy rates, not in percentage terms, can be found by checking the rental pages of suburbs around Australia. See how many rental properties are currently listed, you may see some of them with a statement – available with some future date – so those aren’t currently vacant but they will become vacant and available at that future date. Vacancy rate, then, is a great indicator that property investors can use to make sure that they are going to have good rental income. A very low vacancy rate over an extended period of time will usually start to push yields up. Property managers will keep their eye on the market and they will inform their clients, the landlord, that this market could probably cope with an increase in rent, so low vacancy rates are usually a precursor to increasing rents and yields.

#6 “Yield”

The gross rental yield is the rent achievable in a year, divided by the value of the property as a percentage. Usually, if you’re getting a property for $400 a week in rent and it costs $400,000 in value than that’s typically about a 5% rental yield, in order for a property to be cashflow positive, with long term interest rates of around about 7%, you will need a yield close to about 9% for that to be a positively geared property. The Net Yield is the profit achievable in a year divided by the value of the property. That is, the rent, minus all expenses like rates, strata, financing etc. 

Why it matters

Yield is of course is of great importance to investors because it’s all about cash flow, if you have strong cash flow, you can stay in the game and there’s less risk of you having to sell your property. For those who want to retire on a portfolio of positively geared properties, yield is very important, of course capital growth is the ants pants of investing but yield is what keeps you in the game, so looking for markets with a higher than average yield is usually a good choice for investors. You don’t want to go crazy with it, buying in mining towns or other regional towns that hinge on one industry because they could evaporate overnight. The yield, in general, you want to healthy. You don’t want to be buying in markets with a ridiculously low yield like 2.5% – 3%. The average nowadays is about 4% – 4.5% so anything about 5% or up is a healthy sign.

#7 “Stock On Market Percentage”

Is the number of properties that are currently listed for sale, as a percentage of the total number of properties in a market.This is a great indicator of supply in a market. You want low supply, high demand and the percentage stock is your supply indicator. You want this figure to be as low as possible, ideally 0%. That would mean that there are no properties currently available for sale, which of course makes it hard to enter the market.

Why it matters

The stock on market percentage typically is around about 1%. Ideally you want that, of course, to be lower. Some markets that are quite dangerous will have stock on market percentage of even 5% which is like 1 in 20 properties currently for sale. Stock on market percentage can be a little bit volatile from or time to time, so you need to look at a historical chart and just make sure that the long term average, at least over the last few months, is relatively stable. Stock on market is used in the Jeremy’s Demand Supply Ratio to measure supply. For a growth area, you want a high demand matched with the supply, just having low supply isn’t the only side of the equation, you also need high demand as well.

#8 “Online Search Interest”

This is a figure where the number of people searching for property online is compared with the number of properties available online. You want the most number of people searching for property (that represents demand) and the least number of property available for sale, which represents the supply.

Why it matters

The online search interest or OSI for short is a mini demand versus supply ratio, it’s only one statistic and it can suffer from some anomalies but overall it’s not a bad indicator and when combined with other statistics it can be quite useful for investors targeting locations with high demand versus supply.

Have you found some of these useful when you invested?


If you’re ready to find your investment property go to microburbs.com.au to find the next neighourhood ready to boom!


For press enquiries about this article, please call Microburbs Founder Luke Metcalfe on 0414 183 210.

One Migrant Group’s Neighbourhoods Grew 48% … And It’s Not the Chinese

Our analysis reveals how canny new migrants are benefiting from Australia’s property boom, and why Westerners are falling behind.

It’s a sensitive subject, but not all ethnic groups are profiting equally in Australia’s property boom. In fact, nothing could be further from the truth. Our findings tell a different story to the stereotype of the Anglo Australian baby-boomer couple as the key beneficiary of the property growth.

I’ve often asked people “what do you think is the strongest demographic factor that influences growth”? Chinese, and other migrants, often laugh and say something like “Do you really want me to say? It’s not politically correct”.

At Microburbs, we use data science, machine learning and big data analytics to explain Australia’s real estate market. As such we’re very interested in growth factors, and leading growth indicators. The clear growth indicator nobody is talking about is ethnic and migrant communities. Areas where some migrant groups concentrate have greatly outperformed the average.

Our research has found that Microburbs with the highest proportions of indigenous and Northern European people did not grow much in the past 5 years, while southern European and Asian dominated areas mostly did incredibly well.

How did we find this? We started with Microburbs – small areas of a few blocks, with around 400 people. We then picked the 500 Microburbs that were the most concentrated for each ancestry using data from the 2011 census from the Australian Bureau of Statistics. Next we looked at the price of property in those top 500 Microburbs for that ethnicity and compared the 2012 median property price to the 2016 median property price to get a growth rate.

So, is it the Chinese who are most prevalent in the high growth areas? Well, there is certainly a correlation between Chinese areas and high growth, but the ethnic group which is associated with the best performing areas is actually the Lebanese. 

Birthplace of parents Median house price 2012 Median house price 2016 Growth Top suburbs (% growth)
Lebanese $540,000 $800,500 48% South Granville (74%), Greenacre (55%), Condell Park (36%)
Chinese $785,000 $1,150,000 46% Berala (33%), Eastwood (NSW) (62%), Hurstville (75%)
Korean $814,000 $1,170,000 44% Dundas Valley (84%), Eastwood (NSW) (62%), Oatlands (NSW) (41%)
Greek $768,400 $1,100,000 43% Sans Souci (57%), Earlwood (58%), Kingsgrove (57%)
Vietnamese $430,000 $595,000 38% Cabramatta (48%), Cabramatta West (60%), Canley Vale (78%)
Spanish $445,000 $604,250 36% Wetherill Park (80%), Hinchinbrook (NSW) (46%), Bossley Park(53%)
Croatian $480,000 $630,000 31% Forde (21%), Munster (9%), Oran Park (25%)
Filipino $460,000 $595,000 29% Burnside Heights (28%), Plumpton (NSW) (51%), Ropes Crossing(43%)
Maltese $460,000 $588,145 28% Taylors Hill (17%), Catherine Field (28%), Oran Park (25%)
Serbian $445,000 $561,000 26% Bonnyrigg Heights (46%), Dandenong North (34%), Mount Pritchard (77%)
Russian $691,500 $850,000 23% McKinnon (64%), Bentleigh East (61%), Carnegie (63%)
Polish $435,000 $529,975 22% Ardeer (32%), Bell Park (21%), Brighton East (53%)
Indian $515,000 $620,000 20% Wentworthville (54%), Parklea (43%), Girraween (NSW) (57%)
Dutch $390,000 $465,000 19% Mount Evelyn (33%), Monbulk (20%), Officer (-4%)
New Zealander $420,000 $495,000 18% Upper Coomera (19%), Maudsland (19%), Pacific Pines (16%)
Welsh $451,500 $525,000 16% Secret Harbour (7%), Apollo Bay (Vic.) (16%), Coal Point (14%)
Hungarian $487,500 $560,000 15% Selby (-1%), Hindmarsh Island (-3%), Bell Post Hill (1%)
Maori $355,000 $405,000 14% Upper Coomera (19%), Marsden (23%), Meadowbrook (10%)
Sinhalese $487,000 $548,750 13% Lynbrook (28%), Roxburgh Park (16%), Lyndhurst (Vic.) (32%)
Macedonian $489,000 $550,000 12% Port Kembla (38%), Banksia (64%), Lalor (33%)
English $420,000 $470,000 12% Stirling (SA) (25%), Bridgetown (22%), Mindarie (WA) (24%)
Italian $600,000 $665,000 11% Ingham (-17%), Greenvale (Vic.) (4%), Haberfield (71%)
South African $650,000 $720,000 11% Moggill (9%), St Ives Chase (72%), St Ives (NSW) (63%)
Australian $292,000 $318,500 9% South Grafton (-4%), Gilgandra (24%), Aberdeen (NSW) (-26%)
Turkish $440,000 $462,000 5% Auburn (NSW) (72%), Meadow Heights (12%), Roxburgh Park(16%)
Scottish $515,000 $518,000 1% Aireys Inlet (18%), Sorrento (Vic.) (13%), Lorne (Vic.) (-12%)
German $309,000 $310,000 0% Gatton (19%), Murray Bridge (15%), Boonah (Qld) (0%)
French $660,000 $660,000 0% Killarney Heights (44%), Apollo Bay (Vic.) (16%), South Coogee(62%)
Australian Aboriginal $303,750 $299,000 -2% Murgon (-10%), Goolwa South (11%), Kuranda (1%)
Irish $617,000 $586,250 -5% Apollo Bay (Vic.) (16%), Bardon (4%), Ashgrove (23%)

Now you might be thinking that this is clear evidence that some ethnic groups are sharper investors than others. It’s not that simple though. We have a connection, sure, but there’s more to the story.

Firstly, areas where people report their ethnicity as “Australian” or from the British Isles tend to settle in rural and regional areas, which don’t show strong growth. Take the Scottish community in Lorne, Victoria, which has seen median property prices fall 12% in the last 4 years in their town.

This is similar for people of Northern European ancestry. They seem to prefer living in places where there is more space, and as  such more land. Australia’s most German areas include Murray Bridge in regional SA and Boonah in regional QLD, for instance.

Asian migrants, on the other hand, tend to move into big cities and high density areas – close to shops and work. These areas tend to be short on land already, and increased popularity with an ethnic community increases demand, which drives price growth. They also tend to drive NAPLAN scores up.

Heading out of the cities, the link between indigenous communities and decreased median prices is explained by these communities typically being in very remote regional areas. Our country towns have certainly not shared equally in the recent property price growth.

It’s also worth noting that we’re comparing where these communities were living in 2011 with the increased cost of buying property. There’s every chance that these properties are being rented by the occupants and the beneficial owners could be from a totally different demographic. 

We can clearly see that different ethnic communities come to Australia seeking different lifestyles, which leads them to settle in different areas.

A quick and clever way to demonstrate these cultural differences is with a few Google Image searches. By translating ‘Australia’ into several languages and running a google image search, you’ll see very different Australias for different languages.

Searching for the word “Australia” in Arabic and Chinese gives you Australia’s most exclusive real estate, the Sydney Harbour foreshore:

image02

While searching for “Australia” in French and German gives you dirt cheap real estate, The Outback:

image00

So if Northern Europeans aspire to nature and wide open spaces, they can have it, and cheaply. But they shouldn’t be surprised not to do see any capital growth, because the very thing that attracts them to it – the expansive land – means also that there’s endless supply thereof.

So we can see the Western love of nature improving their housing affordability but also depriving them of capital growth.  

On the flip side, successive waves of immigrants who aspire to our big cities will continue to benefit from the fact that demand outweighs supply in those areas, assuming they can get a foot on the property ladder.

To identify migrant communities and explore the ethnic make up of your potential investment areas, search for the suburb or address below and head to the Ethnicity section of any Microburbs report.

For press enquiries about this article, please call Microburbs Founder Luke Metcalfe on 0414 183 210.