Property Is Still The Path To Wealth: HILDA data released

Property is still the path to wealth in Australia, and our over 65’s have not forgotten it.

This week, the HILDA (Household, Income and Labour Dynamics in Australia) Survey results were released. These are essential updates for Australian property investors available here. Until you have a chance to peruse the full 124 page report, we’ve collected our key take-away points for property investors. 

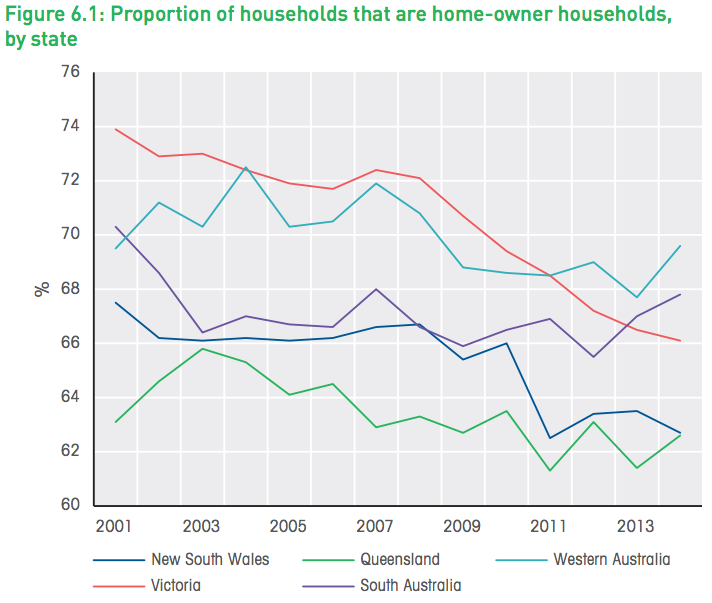
Home owners to become a minority in 2017

Home ownership rates have been falling steadily since 2002, when the survey began. The latest results show only 53% of Australians are home owners, with home owners expected to become a minority in 2017.

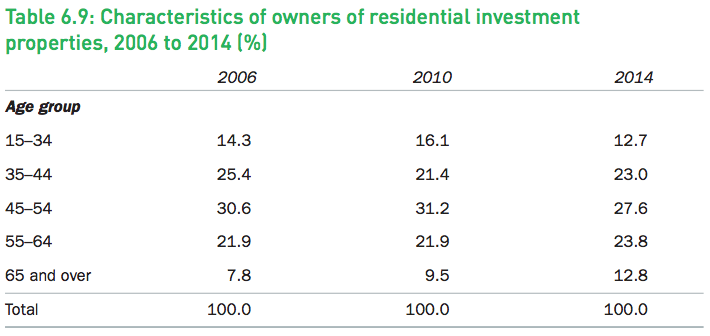
Property ownership is concentrating with older Australians

The fall in home ownership is not evenly distributed. It’s young people who are increasingly unlikely to own a home, with ownership rates amongst 25-34’s falling from 40 percent to 30 percent.


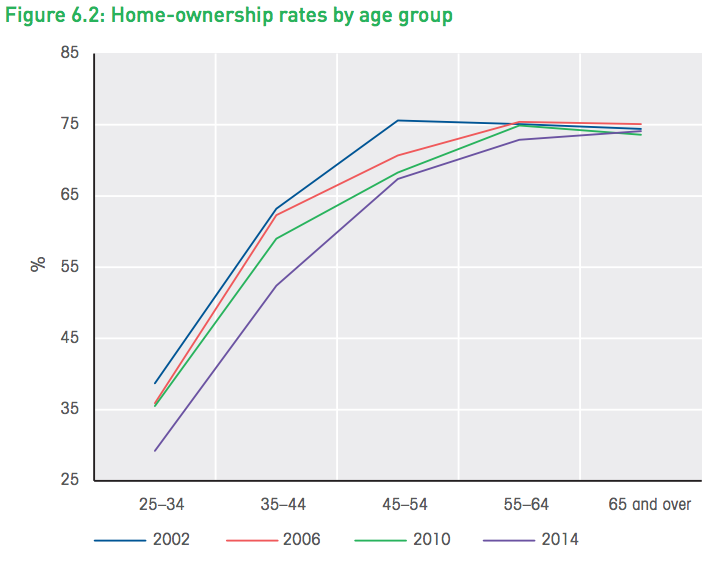
On a household level, households headed by a 25-34 year old have gone from 60 percent home ownership rate to 47 percent.

Where are these homes going? Older Australians show a matching increase in investment property purchases. In 2006, 8 percent of investment property landlords were over65, and in 2014 it was 13 percent. It’s easy to see that those with equity in the property market are beating out newcomers, and that those who have tasted strong capital gains are keen to build their portfolios.


Property Investment is still the path to wealth

Median wealth increases between 2002 and 2014 have not been equal among age groups. Those aged over 65 have enjoyed a whopping 61 percent increase in median wealth between 2002 and 2014, while 25 to 34 year olds have had just a 3 percent increase, despite being of working age.

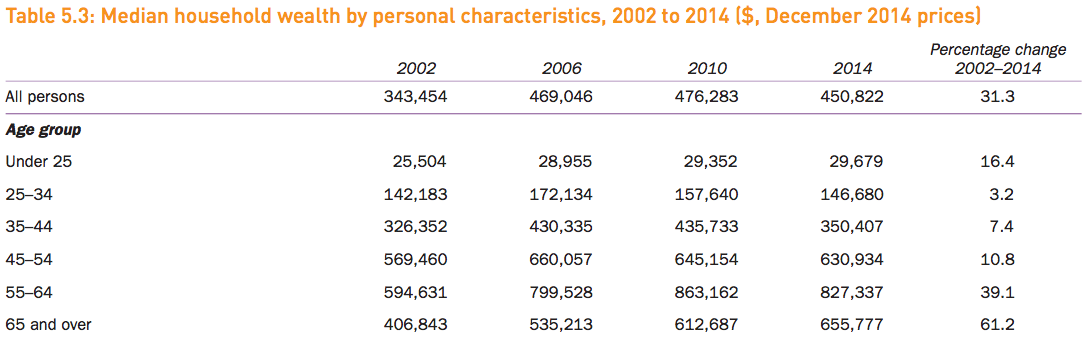
It’s no coincidence that over 65’s in Australia own more of the property and have enjoyed more wealth increases. Tax incentives and a strong property market have proved that it’s property that makes money, and the more property you can own, the more money you can make.

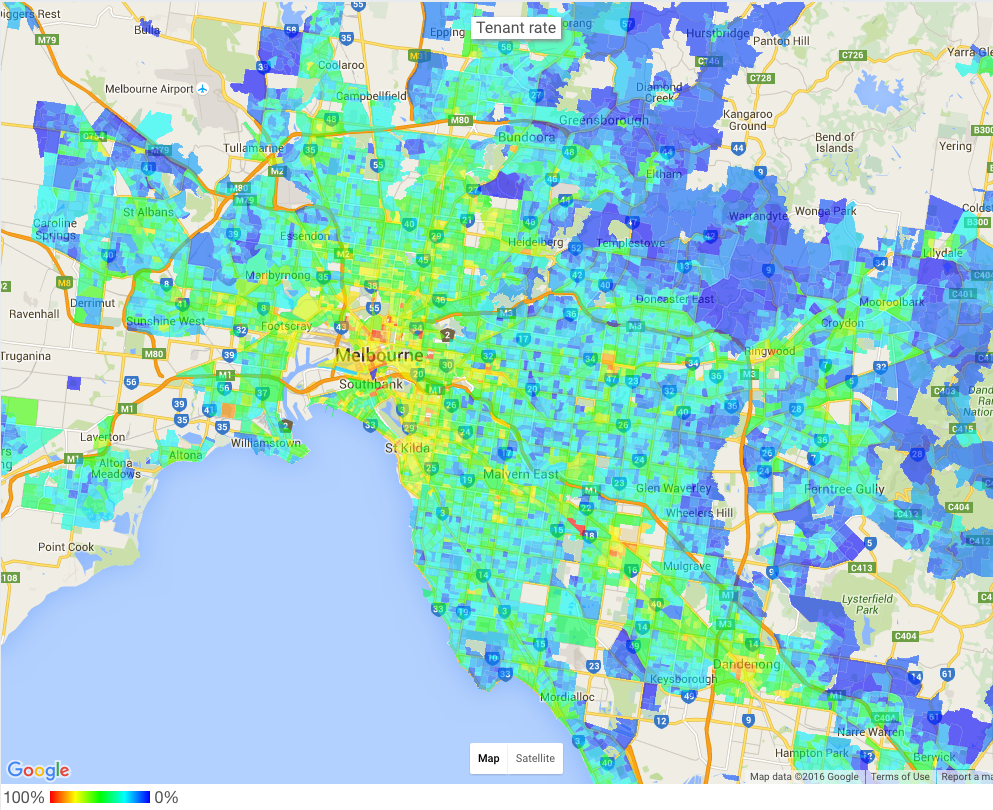
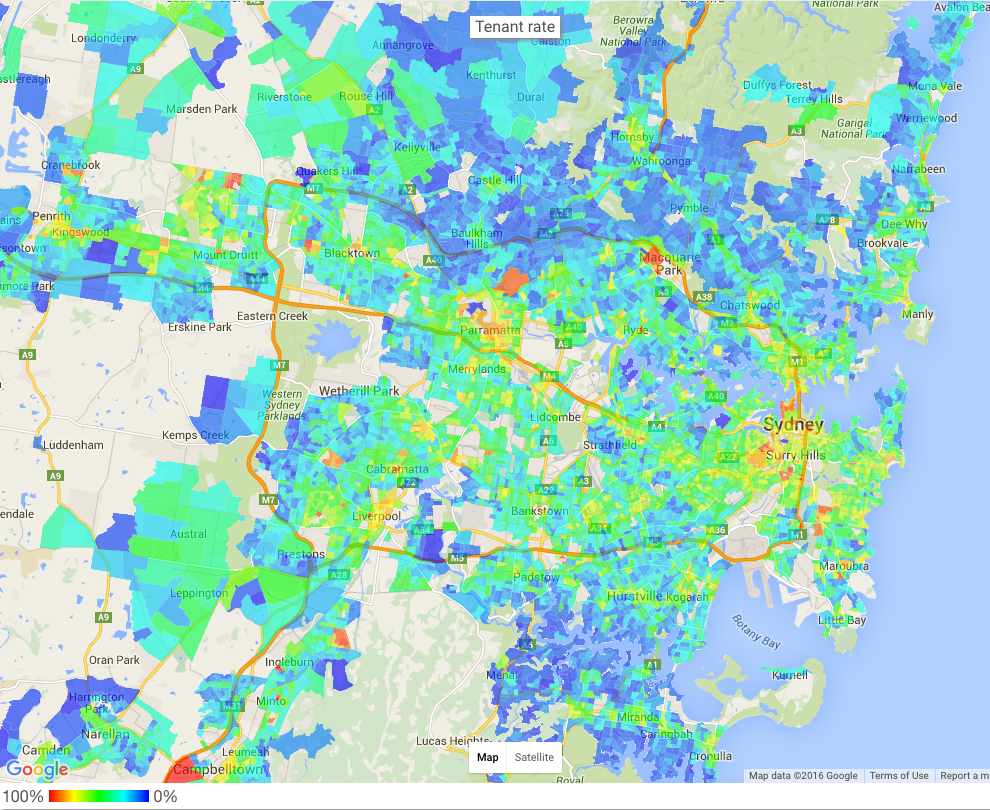
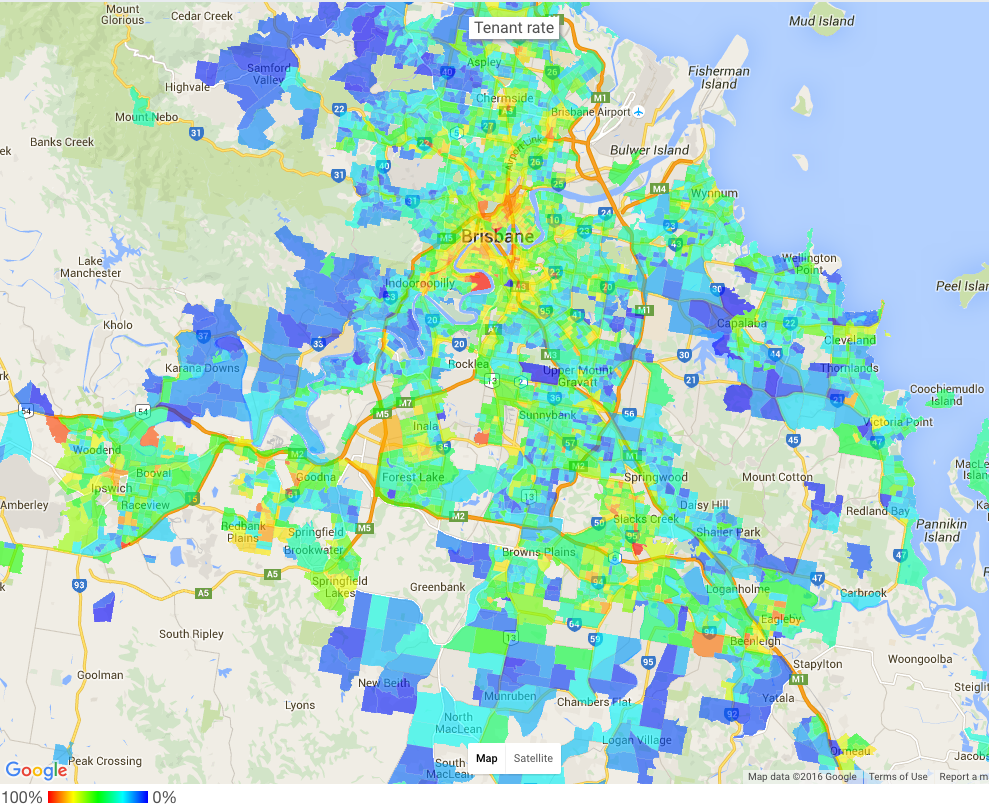
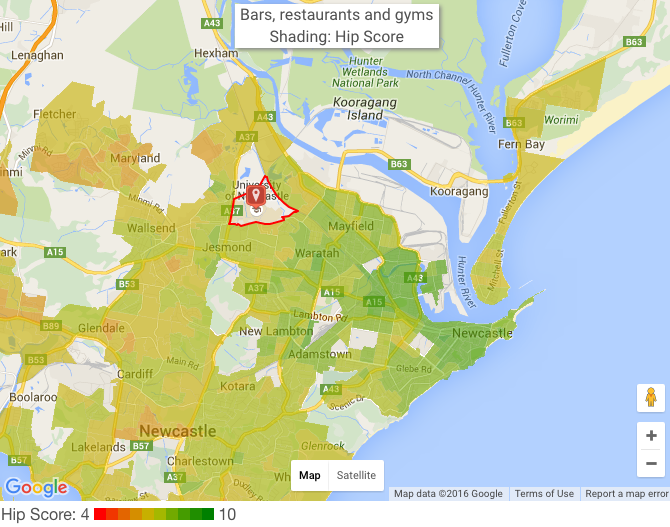
Tenant Rates Across Australian Cities

At Microburbs, we know that owner-occupiers and renters don’t usually live in all the same places. There are distinct investment property areas and home owner areas. Typically it’s units and compact, low maintenance housing around transit hubs which make good investment properties, and large houses with matching yards out in the suburban fringes which are better suited to owner-occupiers.

Melbourne Tenant Rate Map

Screen Shot 2016-07-21 at 11.22.57 am

Sydney Tenant Rate Map

Screen Shot 2016-07-21 at 11.20.48 am

Brisbane Tent Rate Map

Tent Rates for Brisbane

Perth Tentant Rate Map

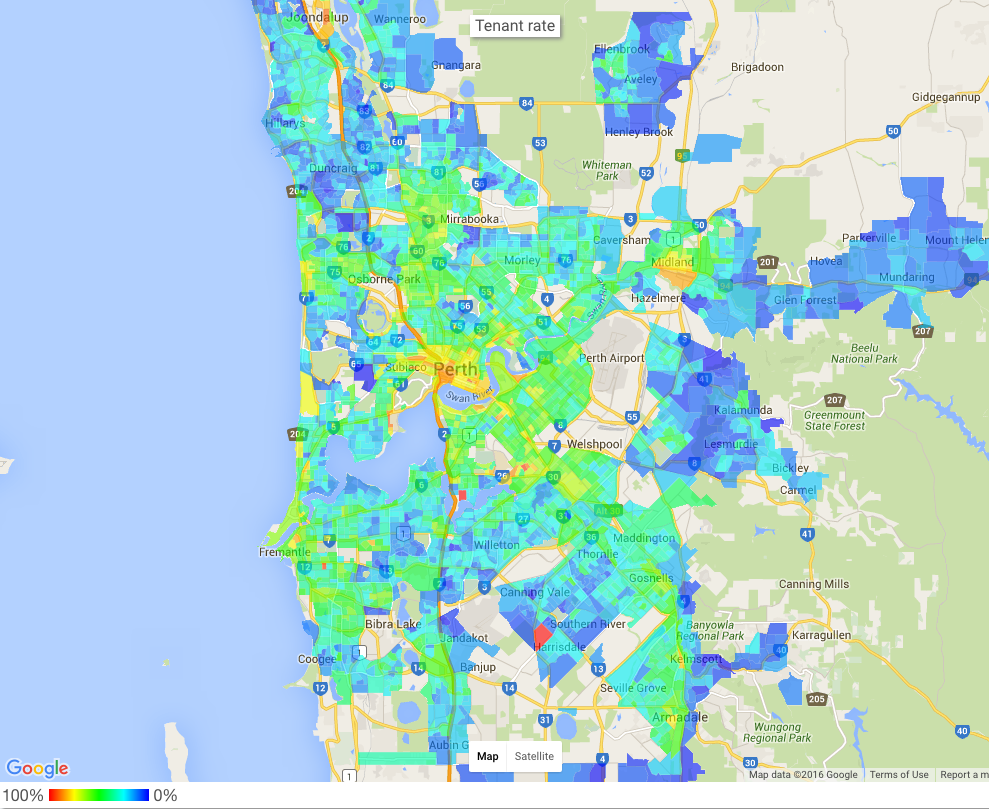
We map tenancy rates at a Microburb level under our Affluence Report section. This way, you can see within a suburb where you’re considering investment, where the rental properties tend to be.

You can get the tenancy rate and Affluence Report for any address in Australia by searching here.  

For press enquiries about this article, please call Microburbs Founder Luke Metcalfe on 0414 183 210.

Australia’s Hippest Universities Ranked By Their Microburbs

So you’ve decided to go to uni but not sure which uni will have a great student life to accompany your degree. You also want to live in an area that is affordable but isn’t boring. On top of all that, you want your uni to have a good academic ranking.
Using the Microburbs ‘Hip’ score, we’ve found the Universities in Australia that have great ethnic diversity, are easy to cycle to, have plenty of young singles and plenty of good cafes, pubs and bars. We’ve put our 5 favourites from the list that will be useful for uni students and investors. The full top 10 is at the bottom. Whilst there are 43 universities in Australia, we’ve focused our list on regional unis as well as some of the ‘group of eight’.

5. Southern Cross University (Lismore Campus):

Hip Score 8 / Rent from $160 per week /Australian Uni Rank 23rd
Lismore is just a 40 minute bus to Australia’s most hyped regional sin city Nimbin and 44 minute bus to the world famous Byron Bay; two of the most ‘go to’ tourist destinations in regional Australia. Lismore itself does boast a surprising amount to do, including access to 30 different restaurants, the regional art gallery and the heritage listed rainforest.

4. Griffith University (Gold Coast Campus)

Hip Score 7 / Rent from $130 per week /Australian Uni Rank 16th
With just a 15 minute drive to both Main Beach and Surfers Paradise, you can explore everything that Australia’s 6th largest city has to offer from the theme parks, nightlife, huge beaches and plenty of young, friendly European tourists to mingle with.
Whilst many students live on campus, the north-eastern side of Parkwood is also popular with a hip score of 7/10.

3. University of Newcastle

image01

Hip Score 8.5 / Rent from $120 per week / Australian Uni Rank 13th

Located 12km from Newcastle city centre, UoN is a popular second choice for aspiring medicine students from Sydney. Newcastle city itself has a hip score of 8/10 and is well known for Nobby’s beach, the vivid nightlife but also the Newcastle night markets which feature street foods, craft beers and artisan foods. Near the beach and around train stations is most popular for student accommodation which have a hip score touching 8.5/10

image03

Other popular suburbs for students include Birmingham Gardens, Jesmond and Warratah West which have an average hip score of 7/10.

2. University of Sydney

Hip Score 10 / Rent from $130 a week / Australian Uni Rank 3rd

The oldest university in Australia is conveniently placed in the city’s inner west; a cultural hub of underground music venues, Newtown night markets, good food and wine festival plus the occasional do-it-yourself Cafe.

Some have criticised Sydney’s recent lockout laws for having had a dampening effect on Sydney’s nightlife. However, this hasn’t stopped vast amount of international music acts regularly coming to perform in the venues like the Enmore Theatre, Oxford Art Factory and much more.

image00

The top suburbs for students include Camperdown, Newtown, Chippendale, Surry Hills & Ultimo which have an average hip score of 10/10.

1. University of Melbourne

Hip Score 10 / Rent from $150 per week /Australian Uni Rank 2nd

image02

Melbourne just takes the top spot after Sydney with a higher hip score and an even better academic reputation. What Melbourne lacks in harbour bridges and opera houses is made up for in laneways and trams, 24 hour nightlife and no lockout laws which make it a great playground for uni students.

Fitzroy (pictured above) was recently named one of the world’s most hipster suburbs and is located just 5 minutes from the uni.

Microburbs founder and lead analyst Luke Metcalfe says “Melbourne is the clear leader among Australian cities for hip score. Sydney may have a strong cluster of very hip suburbs, but when the city is considered overall, Melbourne scores higher.” Australia’s #2 university in the heart of Australia’s hippest city, all with reasonable rents makes the University of Melbourne our hip uni winner.

The full list of the top 10 is below:


Rank University Australian Ranking Hip Score Lowest Rent
10. University of Tasmania 19th 7/10 $160 per week
9. The University of Western Australia 7th 7/10 $190 per week
8. Southern Cross University (Lismore Campus) 23rd 8/10 $160 per week
7. University of New England (Tamworth) 29th 8/10 $175 per week
6. University of New South Wales 4th 8/10 $150 per week
5. University of Newcastle 13th 8.5/10 $120 per week
4. University of Adelaide 8th 9/10 $150 per week
3. University of Sydney/UTS 3rd/9th 10/10 $130 per week
2. RMIT (Melbourne) 14th 10/10 $150 per week
1. University of Melbourne 2nd 10/10 $150 per week

Sources:
http://www.australianuniversities.com.au/rankings/
http://goodeducation.com.au/queensland-regional-universities-are-top-performers/

You can find your uni’s hip score and Microburbs report now, just by searching here.

 
For press enquiries about this article, please call Microburbs Founder Luke Metcalfe on 0414 183 210.

Flight of the Funky – Escaping Sydney to find hip suburbs below the million dollar median

If there’s one thing we’ve learned from our analysis of Sydney’s hippest suburbs, it’s that the inner city lifestyle doesn’t come cheap. That’s not the end of the world while you’re renting, but what happens when it’s time to buy? The bad news is that hip suburbs in the Sydney basin simply don’t come in under the city’s near million dollar median. The good news though, is that there are plenty of hip communities around the state if you know where to look. We’ve scoured NSW to find places with high hip scores and low house prices for those who might still need to visit Sydney on occasion. The results are a surprising mix of hip, happening and about-to-happen destinations.

5) Bellingen

Located just south of Coffs Harbour, this small town is ringed by a number of collectives and communes, and is the undoubted cultural hub of the Coffs Harbour region. As reflected in the relatively high house prices for such a remote town, funky people have been drawn from Sydney to Bellingen for over 40 years now. It’s not too late though, with the prices in Bellingen still trailing Byron Bay by a country mile. 

Median House Price: $510,000

Hip Score: 7

Hours Drive from Sydney: 6

4) Merimbula

Coastal Merimbula is a popular tourist destination and a beautiful town, featuring 2 large lagoon lakes and long picturesque beaches. Our analysis shows quite a strong showing of hip amenities like alternative therapies, cafes and restaurants and arts venues. There’s an annual winter jazz festival to show evidence of a local arts scene, but for now, Merimbula’s hipster potential is staying low key. All of our indicators show that this is a hipster powder-keg just waiting for a spark.

Median House Price: $431,000

Hip Score: 7

Hours Drive from Sydney: 6

3) Tamworth

Situated about halfway between Sydney and Brisbane, the New England town of Tamworth is a cultural hub of live music venues, art galleries and hand crafts. Combined with the low cost of living, it has all of the ingredients for a hipster’s paradise but for one factor – country music. Tamworth is famously the country music capital of Australia, and if your idea of hipness has to include progressive far-left politics, then Tamworth might not be your bag.

Median House Price: $342,000

Hip Score: 7

Hours Drive from Sydney: 5

2) Tighes Hill (Newcastle)

newcastle_olive_tree

Tighes Hill, along with neighbouring Islington and Carrington, is an old industrial area with heritage working class housing. Nestled between the CBD and the coast, Tighes Hill has a lot of residents who can cycle or walk to work or uni, and double the rate of creative professionals than the broader Newcastle area. Tighes Hill could be perfect for those who want the convenience and cultural diversity of Sydney’s inner suburbs, but at around half the price.

Median House Price: $565,000

Hip Score: 8

Hours Drive from Sydney: 2

1) Katoomba

This 19th Century resort-town in the Blue Mountains is still a major tourist attraction featuring the 3 Sisters Lookout and the Scenic World railway/skyway attractions. A long term shift from overnight and long stay tours to day trips has left the town rich in heritage buildings, but a little light on for tourists. This has set the scene for a burgeoning bohemian community, best observed at the annual Winter Magic solstice festival.

Median house price: $510,000

Hip Score: 8

Hours Drive from Sydney: 1.5

The tricky thing about hipster havens is that there are probably some great spots so underground that even we haven’t heard of them yet. You can use Microburbs to hunt for your own perfect area though. The Hip Score panel on all Microburbs reports breaks down the data behind the score. It also maps hip bars and restaurants in the area, with travel time, directions and ratings.

You can find your suburb’s hip score and Microburbs report now, just by searching here.

For press enquiries about this article, please call Microburbs Founder Luke Metcalfe on 0414 183 210.

Sydney’s Babycino Belt: Family Friendly Suburbs That Haven’t Lost Their Cool

So you have kids, or are planning some. They need great schools and safe places to play,  but you want to keep the vitality of places you’ve lived in your younger, freer days. You’re not ready to move to a typical suburban place just yet. You may now feel the urge to share with your childless friends how little sleep you’re getting and still feel solidarity even though their sleeplessness was very much by choice.

Is it possible to have it all? Can kids and parents all be happy in the one place? Of course you can, but how much is it going to cost you? I’ve mined our Microburbs data to find out, and present my top picks:

5. Rushcutters Bay

More than just a place to jog past hundreds of yachts, Rushcutters Bay is our eastside representative of Sydney’s fringe.

This exclusive suburb is 5 minutes walk from uber hip Kings Cross combined with access to Sydney’s east. It’s a halfway mark between gentrifying hipness on the west to the elite lifestyle of Darling Point to its east. A midpoint between star performer private schools SCEGGS and Ascham (both top 1%).

Just be careful with the young ones as mediocre performance in day cares might make a nanny a good option.

Family Score around Rushcutters Bay is shown here,  rising from middling (yellow) to high (green) in the east:

4. Bondi Beach

We’ve all been to Bondi and admired the brash culture of the East, where money meets backpackers, but have you considered raising a family there?

With a family score of 8 out of 10, your kids won’t want for surf and public gym equipment. Admittedly, Bondi Beach Public School doesn’t perform that great for its area with top 38% NAPLAN. But if you can afford to buy in Bondi, you may have the spare change to afford an excellent private school like Reddam House. For a mere $565,000 you could see your three children all the way through primary and high school. What price is too high for top 1% NAPLAN?

3. Neutral Bay

Our top performer north of the Bridge is Neutral Bay. For many it’s a drive-through suburb dominated by a single pub, but recent developments of small bars and funky cafes along Grosvenor St make Neutral Bay deserving of a second look.

It will not surprise many that Neutral Bay and St Mary’s public schools perform well. After all it’s an affluent area with parents who value their time so much, they only just live outside the city. But these schools perform really well – Netural Bay, St Mary’s Catholic and North Sydney boys and girls are all top 1%ers. Mind the day care costs though – they typically charge around $160 per day.

Also showing a strong performance are neighbouring Cammeray and Cremorne, which share their ample parks, playgrounds and sporting grounds.

2. Forest Lodge

Tucked away behind its more famous neighbour, Glebe, Forest Lodge is another suburb that resides at the top of our hip score list but still provides a very good lifestyle for families. With Forest Lodge in the top 10% for NAPLAN and St Brendans Catholic School at top 5%. Nearby Sydney Secondary college also performs well (top 8%).

4358974940_64bcb15229_b 
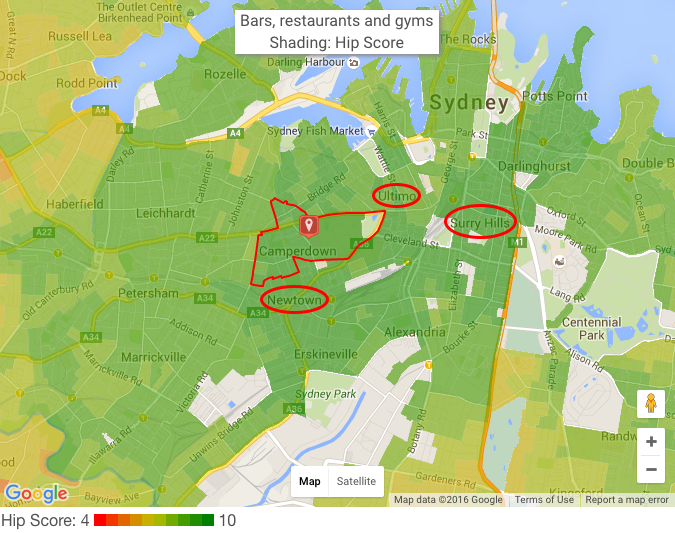
Unlike the Erskineville, Newtown, Camperdown troika, Forest Lodge stands alone at serving both families and hip people with neighbouring Glebe to its east serving hipsters and more spacious Annandale to its west providing for family.
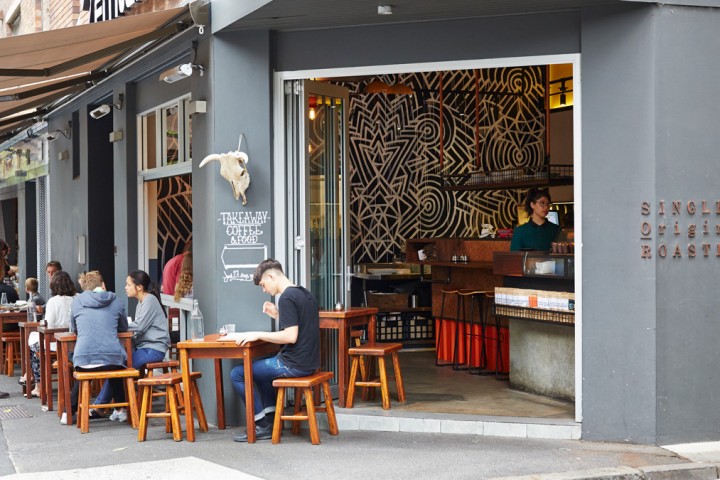
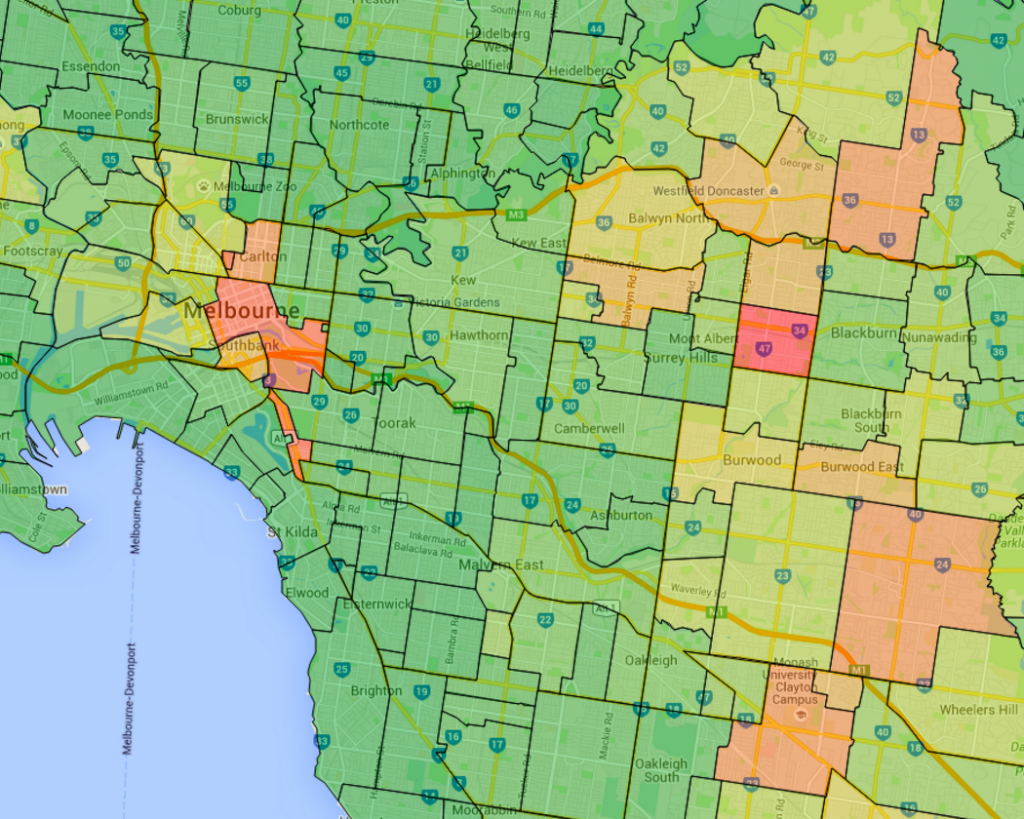
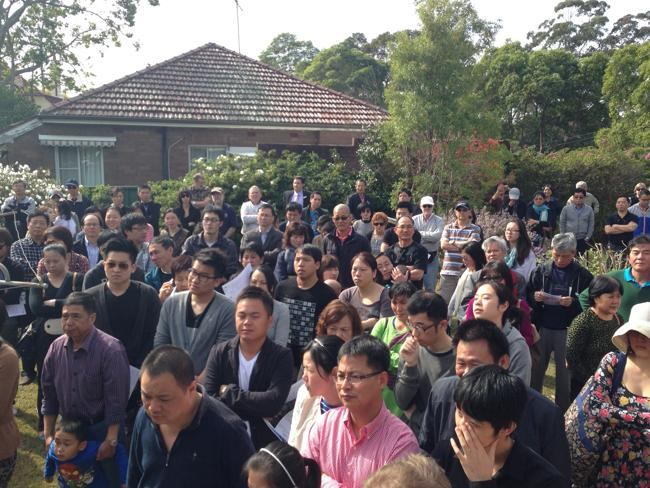
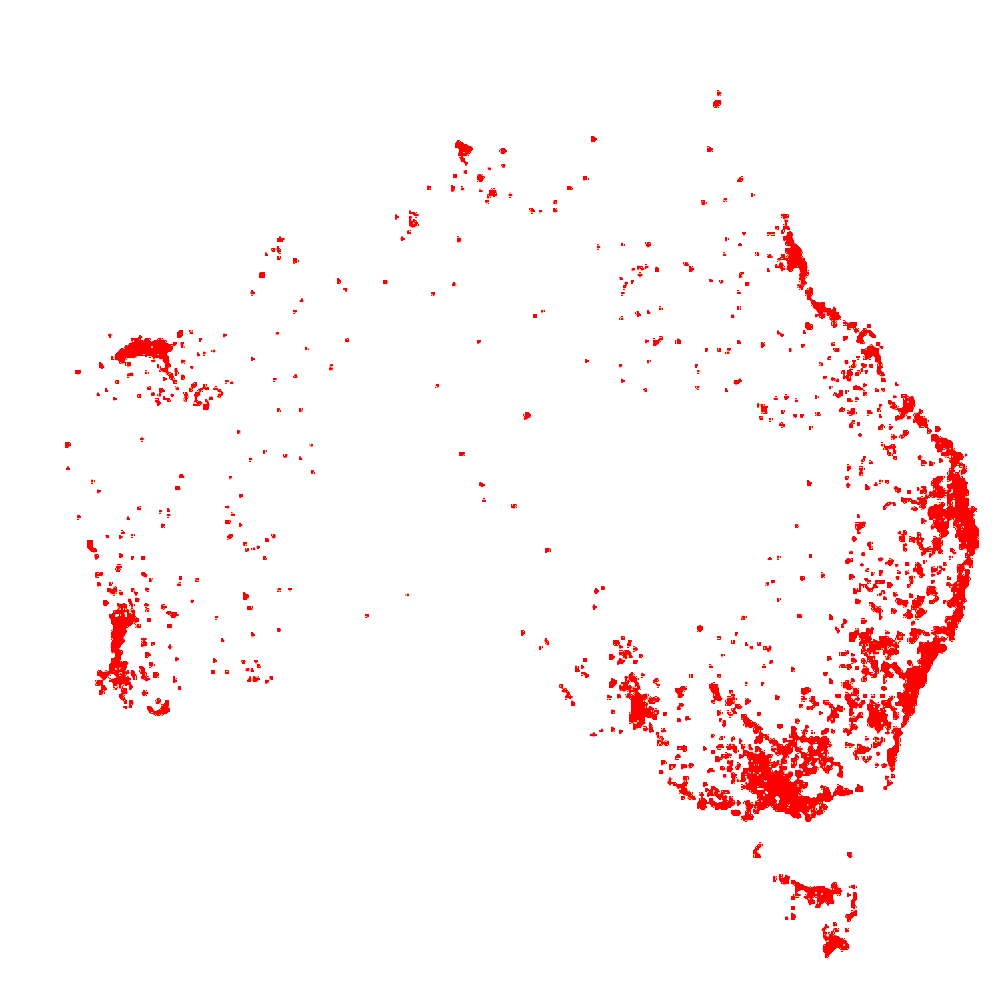
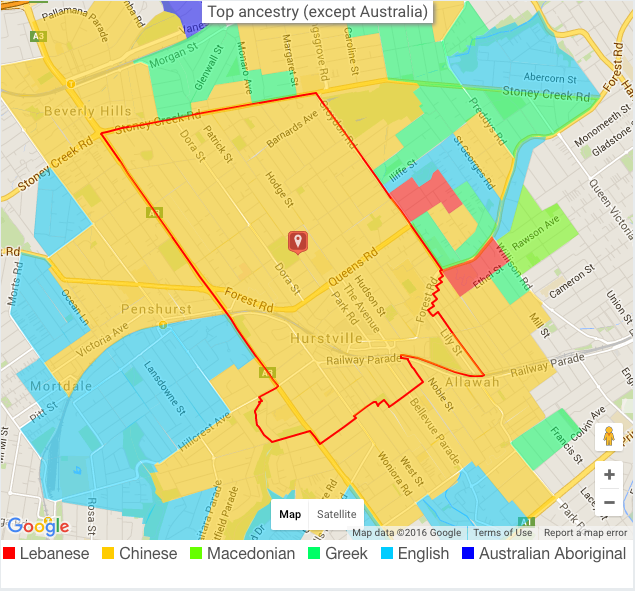
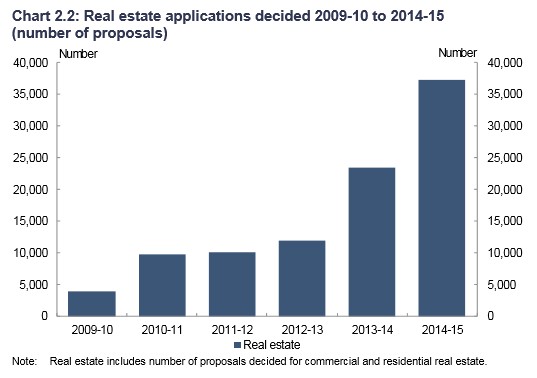
1. Erskineville / Newtown / Camperdown

These neighbouring suburbs are all hip and serve families so well, we had to put them together for first place. Sydney’s Erskineville has a lively community with ample creative professionals, bountiful cafes and 20 art schools within 2km. Its dining options are also vast, courtesy of neighbouring Newtown. You could eat at a new Thai place every day for a fortnight.

hipsterparents1

Family score typically doesn’t accompany hip score but this sought after suburb is definitely an exception. Erskineville public school gets top 8% in NAPLAN.

It’s not so great in terms of tranquillity though, having 9 times Sydney’s average population density. For a bit of space, look the sprawling Sydney Park at its southern tip, which makes for an excellent respite to densely packed inner city living.

Our Official Top 20

Rank Suburb Family Score Hip Score Median House Price 2016
1 Erskineville 8.2 8.9 $1,315,000
2 Camperdown 8.4 8.7 $1,352,500
3 Bondi 8.6 8.5 $2,555,000
4 Newtown 8.1 8.9 $1,301,000
5 Forest Lodge 8.4 8.6 $1,680,000
6 Centennial Park 8.9 8.1 $2,650,000
7 Wollstonecraft 9.3 7.7 $3,537,500
8 Neutral Bay 9.5 7.5 $1,750,000
9 Queenscliff 9.2 7.7 $1,610,000
10 Cammeray 9.7 7.1 $4,050,500
11 Stanmore 8.7 8.1 $1,570,500
12 Waverton 9.4 7.5 $4,750,000
13 Paddington 8.6 8.2 $1,700,000
14 Fairlight 9.6 7.2 $1,583,500
15 Bondi Beach 8 8.8 $2,990,000
16 Newtown 7.8 9 $1,301,000
17 Cremorne 9.5 7.3 $1,947,000
18 Rushcutters Bay 7.8 9 $2,562,500
19 Bronte 9.1 7.7 $3,010,000
20 North Bondi 8.9 7.9 $2,550,000

Microburbs Report – Family Score

The Family Score panel of each microburbs report includes the performance of all classes of local schools, along with catchment boundaries and travel times. For a limited time, we’re offering a comprehensive family scores report for all Australian suburbs, which we can send you instantly:

Oh no...This form doesn't exist. Head back to the manage forms page and select a different form.

For press enquiries about this article, please call Microburbs Founder Luke Metcalfe on 0414 183 210.

Australia’s Top Suburbs for Your Family

Nothing’s more important than family. Much is made of capital growth and other financial factors, but many members of the Microburbs community are simply looking for a safe, happy home for themselves and their children. Convenience, hipness and lifestyle can take a back seat compared to a good environment for your kids to grow up in.

The Microburbs family score is a major statistical undertaking, involving several areas which are weighted and combined to give a final number. NAPLAN rankings of nearby schools are considered, for private options as well as government school catchments. Family amenities are considered, like parks and swimming pools. There are demographic considerations to check if there are young families in the area and if they’re mostly moving in or desperate to get out. Lastly, we undertake surveys to validate that our algorithms and data models reflect the way real families feel about types of areas.

Now that you’re an expert on the science of family scores, let’s explore Australia’s biggest cities for the top ranked suburbs for families.
 

Sydney

Sydney has around 200 suburbs with Family Score of 10, and a city average of 8.3. That may seem like a lot of family burbs, but remember Sydney is a sprawling metropolis with over 650 suburbs. The top of the top scorers are in the North Shore and Northern Beaches areas, and certainly come at a price. The average of the median house prices in our top 10 family areas for Sydney is around 2 million dollars – more than double the already steep citywide median price.

Rank Suburb Family Score
1 South Turramurra 10
2 Willoughby East 10
3 St Ives Chase 10
4 Beecroft 10
5 Middle Cove 10
6 Balgowlah Heights 10
7 Castlecrag 10
8 North Balgowlah 10
9 Curl Curl 10
10 Naremburn 10


Melbourne

Melbourne has 94 suburbs with family score 10. The citywide average for family score is 8.1, trailing Sydney only slightly. As with Sydney, however, the city’s top family burbs come at a premium, with the top 10 averaging a cool $1.5 million median price. Most of the top scorers are in the inner East or North East, with the exception of coastal Beaumaris.

Rank Suburb Family Score
1 Alphington 10
2 Beaumaris 10
3 Camberwell 10
4 Eaglemont 10
5 Balwyn 10
6 Blackburn 10
7 Ivanhoe East 10
8 Ivanhoe 10
9 Mont Albert North 10
10 Surrey Hills 10


Brisbane

Brisbane lags the other state capitals somewhat in the family score stakes. There are 40 suburbs in Brisbane with a family score of 10, which is plenty to choose from, but nowhere near Melbourne’s 94 or Sydney’s 200. Brisbane’s average family score, at 7.8, also lags behind the other big cities. Still, the differences are slight, and Brisbane is still a great city for families with lots of exceptional family suburbs.

Rank Suburb Family Score
1 Bardon 10
2 Fig Tree Pocket 10
3 Chelmer 10
4 Graceville 10
5 Ashgrove 10
6 Chapel Hill 10
7 Seven Hills 10
8 Pinjarra Hills 10
9 Pullenvale 10
10 Upper Brookfield 10


Perth

Perth scores very well across the board for Microburbs family score. There are 65 suburbs in Perth with a top family score, or around a quarter. The citywide average is a family score of 8.2, which means you can’t go too far wrong in terms of locating your family in Perth. With rents having dropped 13% in Perth, there’s a lot to recommend it for the relocating family. Our top burbs for families mostly line the river, with Cottesloe, Swanbourne and Dalkeith on the North side and East Fremantle, Alfred Cove, Rossmoyne and Mt Pleasant on the South.

Rank Suburb Family Score
1 Floreat 10
2 Wembley Downs 10
3 Swanbourne 10
4 Dalkeith 10
5 Nedlands 10
6 Alfred Cove 10
7 Claremont 10
8 Mount Pleasant 10
9 Cottesloe 10
10 Rossmoyne 10


Adelaide

In total, there are 49 Adelaide suburbs with the top family score of 10, against a respectable city average of 8.0. With the exception of Heathpool and Marryatville in nearby City of Norwood, the top family burbs of Adelaide are found in the affluent Inner Eastern City of Burnside area.

Rank Suburb Family Score
1 Tusmore 10
2 Mount Osmond 10
3 Heathpool 10
4 Marryatville 10
5 Hazelwood Park 10
6 Leabrook 10
7 Linden Park 10
8 Burnside 10
9 Beaumont 10
10 Toorak Gardens 10


Regional Recommendations

Some honourable mentions are the Sunshine Coast in Queensland, Central Coast in NSW and Bellarine Peninsula in Victoria. All are regional coastal areas near the state capital which, on average, score higher for families than the capital. If you’re looking for a family area and frustrated with the big smoke, these may be regions to explore.


Microburbs Report – Family Score

The Family Score panel of each microburbs report includes the performance of all classes of local schools, along with catchment boundaries and travel times. For a limited time, we’re offering a comprehensive family scores report for all Australian suburbs, which we can send you instantly:

Oh no...This form doesn't exist. Head back to the manage forms page and select a different form.

 
For press enquiries about this article, please call Microburbs Founder Luke Metcalfe on 0414 183 210.

Punching Above Their Weight: Sydney’s Struggle Street Schools That Perform Really Well

The federal government’s MySchool website is a treasure trove of data about schools and how they perform. Like it or not, it’s a statistical fact that rich suburbs’ schools perform better and that educated parents have kids who, in turn, do well at school. You can see a pretty strong correlation here with Socio-Educational Advantage (ICSEA) and mean NAPLAN score:

Socio-economic advantage is not the end of the story though. There’s still plenty of variation. Some schools perform way better with the children they’re given than others. This article seeks to recognise the fantastic work of those educators and institutions.

But before we get too excited, remember that NAPLAN is just about maths and literacy. It doesn’t tell you which students are going to build the next global restaurant chain or write the next Hollywood blockbuster.  There is much more to a child’s development, and some schools have educational philosophies that aren’t conducive to strong NAPLAN results. It’s possible that some of these schools are just “teach the test” hothouses.

Regardless, maths and literacy are the foundations upon which many other skills can be learnt. We may celebrate the tech founder who drops out of university to create a billion dollar business, but you can be pretty sure that person didn’t drop out because they couldn’t read or write.

 1. Canley Vale High School

What makes Canley Vale really a standout is that on our ranking it actually beat out all the other selective schools too. That means that they did more with the local children than selective schools can do with a hand-picked intake. Something is definitely going right in this very poor south western Sydney suburb. The average income per week is just $495, yet this school ranks in the top 25% for NAPLAN across the country.

 2. Cabramatta High School

Nearby to Canley Vale is Cabramatta High School, our second top performer. The majority of the students are from a Vietnamese or Chinese background. 68% of students from here come from economic backgrounds in the bottom quarter of the state, yet the school still produce results around the state average.

3. Fairvale High School

Our next best performer is also from Sydney’s South West. If you look carefully at the faces, you may see a familiar pattern:

The high cultural priority that Asian families place on education may be showing up here. This may be why high schools in immigrant areas beat primary schools. It’s a tough call for immigrant primary school children to outperform their peers while also learning a new language.

4. Chifley College Shalvey Campus

Despite 26% being from an indigenous background, 25% being from a non-English speaking background and 83% of their students in the bottom quarter of the state socio-educationally, this public high school manages to achieve NAPLAN results in line with national averages.

5. Sydney Distance Education High School

We tried to make this article about what schools that outperform, though it seems having Asian kids extends the pressure to perform into the home. Also Asian parents may be particularly keen on conventional measures of academic achievement over most extra-curricular pursuits that we don’t cover here.

So we also looked for the school that performs the best with an English speaking population and this one came top. Although the name sounds like it might be for isolated, remote families, it actually supports on children with special needs, like the pregnant or disabled. Their NAPLAN scores show that they are certainly coming through for their students.

Microburbs Report – Family Score

The Family Score panel of each microburbs report includes the performance of all classes of local schools, along with catchment boundaries and travel times. We also have available a full report for Australian suburbs, which we can send you instantly:

Oh no...This form doesn't exist. Head back to the manage forms page and select a different form.

 
For press enquiries about this article, please call Microburbs Founder Luke Metcalfe on 0414 183 210.

What can the PM afford to buy in Sydney?

Joe Hockey famously advised first home buyers to “get a good job that pays good money”. How about the top job? The Prime Minister of the Commonwealth of Australia earns no less than $507,000 a year. That’s got to give us some serious buying power, right? How much could you really afford in the PM’s home town of Sydney?

First things first, we need to pay tax. Assuming we haven’t got a handful of negatively geared properties already, our tax bill is $202,000. That leaves us $301,000 though, which is still more money than most first home buyers can dream of.

To avoid mortgage stress, your mortgage repayments should be less than 30% of your income, or about $92000. Of course we’ll be getting our loan at the great Microburbs rate of 3.89%.

According to the government’s own MoneySmart calculator, annual repayments of $92,000, at 3.89% gives you borrowing power of… $1,450,000.

Wait a minute. That’s not very much really. The median house price in Sydney is around $1,000,000. The median prices in 172 Sydney suburbs is over our budget!

Naturally anything in Sydney with a view of the Harbour, close to beaches or close to the CBD is off the table. Likewise, the inner west, north shore and more affluent parts of suburbia are way out of your reach.

North western suburbs like Cheltenham, Beecroft and Pennant Hills may be out, but if you’re prepared to go a little further, Castle Hill is a mere 26 km to the city and is still in your budget until the metro opens there in 2019.

Houses in Strathfield are out, but neighbouring Burwood would be ok. Dulwich Hill has become too popular for the likes of the PM, but Hurlstone Park or Ashbury, beyond the reach of the light rail, are still options.

That’s not to say there aren’t some houses below the median price in inner areas.

This inner west terrace house is almost within our budget, with an auction guide price of $1,500,000. Could this fixer-upper be our answer to the Whitehouse or Number 10?

Over to the Microburbs Property Report to find out!

This inner west terrace has a hip score of 8 and an affluence score of 10. Unfortunately it only scores a 4 for safety, so we may need to put on a few more protective services officers.

Of course there’s still the deposit. You’ll need about 3 years of PM’s pay to get that together. Unfortunately, nobody has been able to last in that job that long in nearly a decade.

If you find your mortgage a pain too, you can at least get a better interest rate. Get access to our exclusive lenders and reduce your rate to as low as 3.89% now!

Microburbs Lifestyle Score – Are you in a hot spot or a dead zone?

Microburbs Lifestyle Score ranks every location in Australia based on lifestyle venues, like cafes, restaurants, bars, beaches and gyms. 

Everyone knows that location is vital in finding a property. That’s one aspect that no amount of renovations can change. What makes a good location though? How can you pick the spots that you, or your tenants will love to live?

A fundamental factor is lifestyle. Australians have become coffee connoisseurs, craft beer drinkers and gourmet diners. In increasingly dense cities, your local cafe or restaurant is where you meet friends and family.

Life in a vibrant lifestyle location is so much better than in a social wasteland, and property demand (and price growth) will follow.

Single Origin Roasters Cafe, Surry Hills. Photo: smudgeeats

Microburbs Lifestyle Score is the ranking that lets you easily sort and compare lifestyle quality in any place in Australia.

The Microburbs Lifestyle Score ranks an area or property between 1 to 10, with 1 being totally lifeless and 10 being a vibrant social hub.

Because lifestyle means different things in different areas, the Microburbs ranking takes into account all types of destinations.

In Surry Hills and Fitzroy, lifestyle means cafes and bars. At Bondi, or Eagle Bay in WA, it means beautiful coastline. In Northbridge, WA and Fortitude Valley, QLD, lifestyle is clubbing and nightlife.

Most of all, a high lifestyle rank means having a large number and wide variety of nearby options.

Cottesloe

Microburbs founder, Luke Metcalfe says “A location offering a great lifestyle is so important to property seekers. People want a variety of dining options, quality coffee and inviting bars, all within walking distance.”

“To be considered in the Lifestyle ranking, places like bars, cafes and restaurants must be within 5 minutes walk. Beaches and pools are counted if they are within a 5 minute drive, or 30 minute walk.”

Rankings are done at a Microburb level, being small areas within suburbs with around 400 people. That’s important, because Australian suburbs can be quite large, and the lifestyle at one side of a suburb can be totally different to the other side.

The lifestyle panel on all Microburbs reports breaks down the data behind the score. It maps each place to go in the area, with travel time, directions and ratings.


You can find your lifestyle score and Microburbs report now, just by searching here.

Analysis Reveals which Australian Chinese Stereotypes are Actually True

With ever increasing amounts of Chinese expats calling Australia home, we look to our extensive suburb and property data for insight. Stereotypes abound, but can you sort the factual from the phoney? 

We’ve looked at Australia’s 55,000 microburbs and done the numbers. Microburbs are smaller areas that make up a suburb, each with about 400 people. By looking at microburbs, we can get a much sharper picture of an area than by looking at overall suburbs.

There are 1,879 microburbs with 20% of their residents reporting Chinese ancestry in the census, which we’ll call Chinese microburbs.

State # Chinese Microburbs
New South Wales 1069
Victoria 571
Queensland 139
Western Australia 79
South Australia 13
Australian Capital Territory 5
Tasmania 3


Let’s have a look at how Chinese microburbs compare to the rest of Australia and explore a few commonly held perceptions.

1460704159

Stereotype 1: Chinese people love to live in high density, convenient places.

According to our modelling, the Chinese microburbs are certainly more convenient. The average Microburbs Convenience Score is 8% higher than the national average. We can break this down further to look at what makes these areas convenient:

  • An amazing 99.6% of Chinese microburbs are within 30km of a major work centre. For the rest of the country it’s just 61%.
  • 29% of people in Chinese areas use public transport compared to 10% for the rest of the country. Cars per household is only 1.4 vs 1.8 elsewhere.
  • The average distance to shops in these Chinese areas is 297m, compared to 3km for the rest of us.

With convenience often comes high density housing. In Chinese microburbs, 35% of people live in units. That’s 4 times the national average.

High scoring Chinese microburbs for Convenience Score can be found in Ultimo in Sydney, West Melbourne, and Adelaide CBD

Chinese people love to live in high density, convenient places?  TRUE

Stereotype 2: Chinese people don’t integrate

On the one hand, there is only one suburb in Australia which is majority ethnic Chinese, being Hurstville, in Sydney. There are 106 microburbs in Australia which are majority chinese, but nearly a third of those are in Hurstville. If we look at the amenities available in Chinese microburbs, they are 26 times more likely to contain a Chinese restaurant and 130 times more likely to contain a Chinese Medicine business.

It can’t be denied that there are ‘Chinatowns’ around Australia. We covered Sydney’s Hurstville, but similarly, Melbourne has Glen Waverley and Brisbane has Sunnybank Hills.

On the other hand, Chinese people, like their restaurants, are spread all around Australia, living in around 57% of Australia’s microburbs. With a dispersion like that, it wouldn’t be reasonable to say Chinese in Australia were particularly clustered.

Chinese people don’t integrate? FALSE

Dot map of every Chinese person in Australia by Monash City Science

Stereotype 3: Chinese love to become professionals, like doctors

Are the residents of Chinese areas all professionals? Certainly more of them than average. 29% of working adults in these areas are professionals, which is 50% higher than the rest of the country. Chinese Microburbs have twice as many university graduates and nearly 3 times as many residents with postgraduate degrees. On top of that, the amount of university students is more than 3 times the expected level.

Residents of Chinese microburbs are certainly highly educated. At the pinnacle, are the Chinese microburbs in university areas like Crawley in Perth, St Lucia in Brisbane and Acton in the ACT.


Chinese love to become professionals: TRUE


Stereotype 4: The Chinese make lots of money

We can’t say what kind of wealth Chinese immigrants might be bringing to Australia, but we can see the way wages differ in Chinese microburbs.

There are higher numbers of people reporting no income, but that is in line with there being triple the number of students, who often have no income.

Aside from non-earners, incomes are very similar to any other area. The levels of high income earners, particularly, are right in line with national averages.

This is remarkable, however, because of the high number of professionals and postgraduates in these areas. Typically these experts would command higher wages. This may be a the effect that Australia’s race discrimination commissioner, Dr Tim Soutphommasane, has described  as the ‘Bamboo  Ceiling‘ – an analogy to the ‘glass ceiling’ experienced in business by women.

There are suburbs with high earning Chinese microburbs, like Balwyn in Melbourne, Bruce in Canberra and Castle Cove in Sydney, but all up, Chinese microburbs report average wages, despite all of those masters degrees.

Chinese people are high earners: FALSE

Microburbs in Hurstville shaded by Ancestry

Stereotype 5: The Chinese are good students

Oh yes. The average NAPLAN rank for schools in Chinese areas is top 23%. They certainly do their local schools proud.

This is particularly prominent in Sydney’s North Shore suburbs of Chatswood, Lindfield and St Leonards, Brisbane’s St Lucia and Melbourne’s Glen Waverley.

The Chinese are good students? TRUE


The Rise of the Australian Chinese

The Foreign Investment Review Board (FIRB) has just released their annual report, revealing continued explosive growth in Chinese investment in Australian real estate. The federal government moving against illegal foreign investment on one front and China increasingly choking the flow of money out of the country on the other has done nothing to slow the tide.
FIRB_approvalsImage source: FIRB

In 2013-4, Chinese investors overtook Americans as our biggest source of foreign investment, and in 2015, the numbers only continued to rise. All investors in Australian residential markets need to know what this means for them, so we’ve looked at Australia’s 55,000 microburbs and done the numbers.
We are offering a free analysis of the Chinese in Australia, and what it means for your investment portfolio here. Informed buyers should know where Australia’s Chinese microburbs are and how they compare, in detail, to the rest of Australia.

Get the Full Report

Download now:

Oh no...This form doesn't exist. Head back to the manage forms page and select a different form.

Negative Gearing: Be Patient, Don’t Muck With It

What will the impact be on the property market if the proposed changes by Labour go ahead to abolish negative gearing on old properties? What will life be like for investors? How will it affect first home buyers? Jeremy Sheppard from DSR Data walks us through the winners and losers.

Supply and demand

In a free market, prices rise when demand exceeds supply. But if the government tampers with the market, like seen in communist regimes, the natural law of supply and demand may be distorted.

What caused demand to exceed supply?

Some would argue that investors are responsible for the increased demand for property. And that might be true for Sydney and Melbourne for the most recent boom.

However, there have been booms in the past without such significant involvement from investors. This time was just a magic combination for investors. We shouldn’t apply a permanent measure for a temporary situation. Time will balance things out anyway as I’ll explain soon.

Australia is a truly great place to live, that’s the real reason why prices are so high here. We have a great economy and freedom from a lot of problems making hell-holes elsewhere in the world.

It makes sense that people want to live here which pushes up prices. If the government considers high prices to be a problem, they should look at modelling how other countries have maintained low prices with some of this:

  • Civil war
  • Famine
  • Corruption
  • Restricted education
  • Poor health care
  • Low technology
  • No infrastructure
  • Dictatorships

Implementing any of these strategies in Australia will quickly solve the demand problem.

Supply

To solve the “problem” with supply, government could reduce taxes charged on developers to build new properties. They could also look at relaxing development constraints.

However, without those taxes, vital infrastructure like water supply, electricity and sewerage would not be available. And without building constraints, developers could prop up any cardboard box like shack.

In other words, government should make it as easy as possible for shanty towns with no sewerage to spring up overnight everywhere.

In every boom, the response from developers has been: build, build, build. They make a buck by supplying to the demand. Eventually they balance out the supply and demand equation and normality is restored.

The same will happen to ease the current boom. It’s not something that needs fixing. Supply and demand in Sydney and Melbourne will probably balance out before Labour get into power anyway.

Impact on existing investors

Because the proposed change wouldn’t be retrospective, existing property investors would be largely unaffected. However, if they owned property in well-established areas where old properties dominate the landscape, there may be reduced capital growth.

Although such areas may still be in demand by owner-occupiers, the demand to buy old houses by investors would diminish. So the short term capital growth prospects for such areas might diminish too.

Impact on future investors

After the plan is introduced it would be tax-inefficient for investors to buy old properties. However, new properties are unattractive to many investors given:

  • High margins applied by developers

  • Lack of opportunity to add value through renovations

  • Established areas have limited land available so new properties in established area are invariably units with little uniqueness

  • New housing estates on the other hand are typically in poor capital growth locations distant from the CBD

  • There is also a risk of the developer failing to complete the project or problems with quality of finish – all the usual risks with off-the-plan purchases that investors prefer to avoid

So the proposed change may knock a significant portion of investors out of the market. They may instead choose shares to be a better option.

Initially, this reduced demand from a segment of the buyers in the market is what would improve affordability. Investors roughly represent about a third of all buyers. Negatively geared investors represent a smaller proportion than that.

In the short-term it would be ugly for some. But eventually, the law of supply and demand would rebalance and either rent would rise or property would become scarce again pushing up prices.

Impact on developers

It’s not known if investors will switch to less effective new investments, or simply exit the market. In the 1st case, there would be an increased demand for new property. So developers would be licking their lips.

In the 2nd case, with decreased demand from investors and lower prices, more developers would find some deals simply unfeasible. Some might even go belly-up. Most would simply cancel less profitable projects.

Note that with less development projects, supply will quickly dry up and prices will start booming again. Supply and demand will have its way.

Impact on 1st home buyers

FHBs have been complaining recently that it is not possible to compete with investors. If investors target new developments, FHBs will be in an even worse position buying anything new.

But established areas with old properties are usually in better locations and therefore command a price tag well outside the reach of FHBs. So with no way of affording existing properties and more investors than ever to compete with over new properties, FHBs might be between a bigger rock and a harder place than they are now.

Impact on renters

If renters are still unable to convert to FHBs, I don’t think they’ll be stung by rising rents as much as some would suggest. Most landlords are already charging the top dollar possible. In fact, there may be a temporary drop in rents by landlords to secure their tenants rather than lose them as budding FHBs.

However, if investors are knocked out of the market and prices drop as planned, development will dry up. Developers won’t want their clientele diminished nor their profit margins cut. With less development supply is reduced which will eventually lead back to higher prices and higher rents again.

Suburbs most heavily impacted

Those suburbs most likely to feel the pain of the change would have the following characteristics assuming investors decide to pursue new developments:

  • Suburbs with very little development currently or planned – means there is less interest from new buyers who might be investors

  • Suburbs traditionally of interest to investor owners rather than owner occupiers – means a greater percentage of future buyers are affected by the change

  • Unaffordable suburbs for FHBs – means buying activity from FHBs is unlikely to prop up the reduced demand from lack of investor interest

  • Suburbs with a lot of old stock on the market at the time the plan is implemented – sellers will lose interest from investors and may be forced to drop prices further

Supply and demand feedback loop

Knocking investors out of the market to reduce demand has an effect on developers. With reduced clientele and reduced prices, there are reduced profit margins for developers. So they reduce their construction which reduces supply which eventually leads to price rises again. This brings investors back in and developers too.

That’s how supply and demand works. There’s an in-built feedback loop in a free market that ensures that eventually everything returns to normal. Don’t be spooked by markets that are out of balance for a couple of years.

It’s beautiful how it all works together. It sorts itself out – no need for the government to meddle in it.

Once property becomes cash-flow neutral under the new regime, investors will return to the market. Developers will follow that increased demand with increased supply and balance will once again be restored to the cosmos. Prices will continue to climb as they always have.

In a nutshell

You have two options to affect prices:

  1. Decrease demand by making our country a hell-hole; or

  2. Increase supply by encouraging shanty towns

A sudden tax change will merely create overnight winners and losers. But the same “problem” will reappear. Supply and demand will sort it all out naturally in time.

Australia is a great place to live – don’t muck with it.