RBA Cuts to 1.5% – Big 4 Customers Won’t Benefit, But You Can.

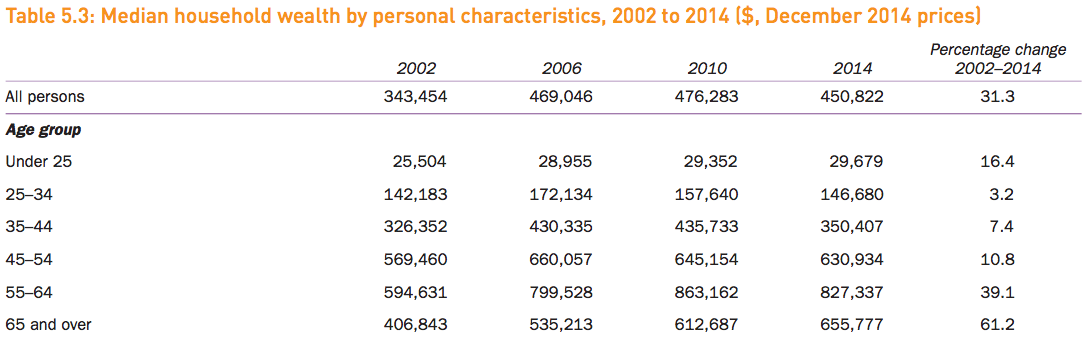
This week has seen the Reserve Bank of Australia cut the cash rate to a historic low of 1.5%. The announcement was not a surprise to many, with low inflation data signalling a likely cut in the lead up to the RBA board meeting.

What has been a surprise is the response from the big four banks. Rather than pass on the full rate cut to their mortgage customers, they reduced their standard variable rates by only half as much as the rate cut, and increased term deposit rates, rather than cutting them. More surprising still, was the swiftness and similarity of announcements by CBA and NAB, with Westpac and ANZ trailing after.


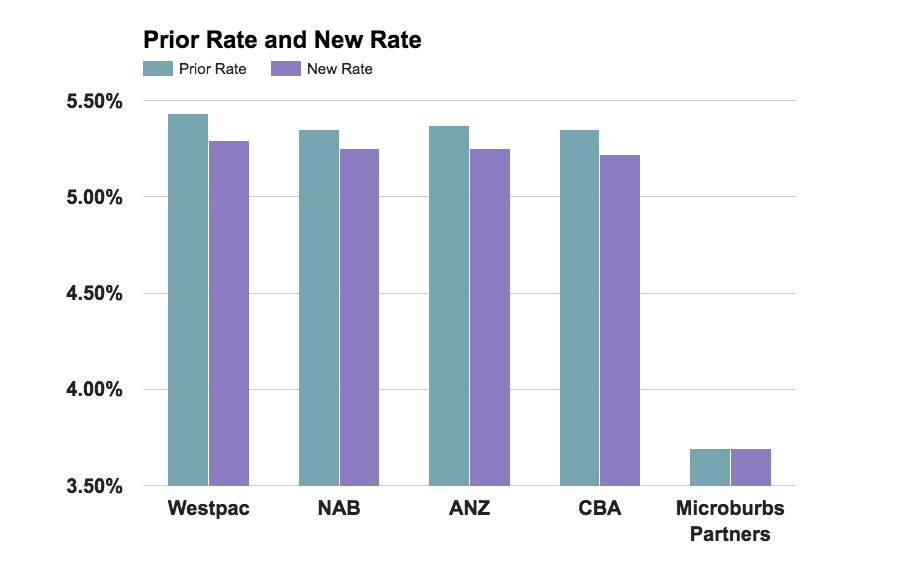
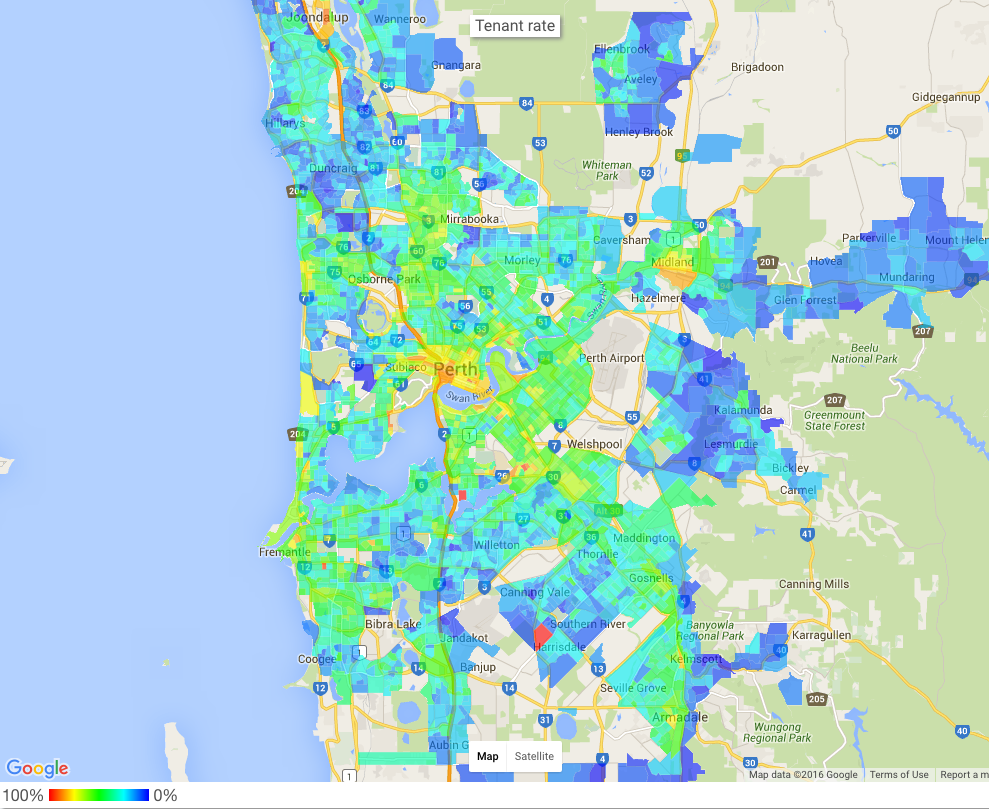
Many have been left feeling frustrated and powerless after being stuck around the 5.3% mark while the cash rate approaches zero. There are alternatives though, which dozens of lenders available outside the big 4 with much fairer rates. Mortgage holders can compare personalised offers from a wide range of lenders in 2 minutes without filling in application forms and navigating red tape. You can even give it a go right now.

It’s easy to brush off the idea of changing lenders for a rate cut as being not worth the hassle, but that couldn’t be further from the truth. A reduction in interest rate brings the power of compound interest over to your side. Every 1% per year on every $100K of your loan is $1000 a year into the household budget. Furthermore though, you save on the compound interest on that. A better rate can mean reaching financial freedom years earlier, building an investment portfolio while paying down your mortgage or having the money to travel again.

Get some offers in 2 minutes and look at how much you could save over the life of your loan.


Property Is Still The Path To Wealth: HILDA data released

Property is still the path to wealth in Australia, and our over 65’s have not forgotten it.

This week, the HILDA (Household, Income and Labour Dynamics in Australia) Survey results were released. These are essential updates for Australian property investors available here. Until you have a chance to peruse the full 124 page report, we’ve collected our key take-away points for property investors. 

Home owners to become a minority in 2017

Home ownership rates have been falling steadily since 2002, when the survey began. The latest results show only 53% of Australians are home owners, with home owners expected to become a minority in 2017.

Property ownership is concentrating with older Australians

The fall in home ownership is not evenly distributed. It’s young people who are increasingly unlikely to own a home, with ownership rates amongst 25-34’s falling from 40 percent to 30 percent.


On a household level, households headed by a 25-34 year old have gone from 60 percent home ownership rate to 47 percent.

Where are these homes going? Older Australians show a matching increase in investment property purchases. In 2006, 8 percent of investment property landlords were over65, and in 2014 it was 13 percent. It’s easy to see that those with equity in the property market are beating out newcomers, and that those who have tasted strong capital gains are keen to build their portfolios.


Property Investment is still the path to wealth

Median wealth increases between 2002 and 2014 have not been equal among age groups. Those aged over 65 have enjoyed a whopping 61 percent increase in median wealth between 2002 and 2014, while 25 to 34 year olds have had just a 3 percent increase, despite being of working age.

It’s no coincidence that over 65’s in Australia own more of the property and have enjoyed more wealth increases. Tax incentives and a strong property market have proved that it’s property that makes money, and the more property you can own, the more money you can make.

Tenant Rates Across Australian Cities

At Microburbs, we know that owner-occupiers and renters don’t usually live in all the same places. There are distinct investment property areas and home owner areas. Typically it’s units and compact, low maintenance housing around transit hubs which make good investment properties, and large houses with matching yards out in the suburban fringes which are better suited to owner-occupiers.

Melbourne Tenant Rate Map

Screen Shot 2016-07-21 at 11.22.57 am

Sydney Tenant Rate Map

Screen Shot 2016-07-21 at 11.20.48 am

Brisbane Tent Rate Map

Tent Rates for Brisbane

Perth Tentant Rate Map

We map tenancy rates at a Microburb level under our Affluence Report section. This way, you can see within a suburb where you’re considering investment, where the rental properties tend to be.

You can get the tenancy rate and Affluence Report for any address in Australia by searching here.  

For press enquiries about this article, please call Microburbs Founder Luke Metcalfe on 0414 183 210.

Flight of the Funky – Escaping Sydney to find hip suburbs below the million dollar median

If there’s one thing we’ve learned from our analysis of Sydney’s hippest suburbs, it’s that the inner city lifestyle doesn’t come cheap. That’s not the end of the world while you’re renting, but what happens when it’s time to buy? The bad news is that hip suburbs in the Sydney basin simply don’t come in under the city’s near million dollar median. The good news though, is that there are plenty of hip communities around the state if you know where to look. We’ve scoured NSW to find places with high hip scores and low house prices for those who might still need to visit Sydney on occasion. The results are a surprising mix of hip, happening and about-to-happen destinations.

5) Bellingen

Located just south of Coffs Harbour, this small town is ringed by a number of collectives and communes, and is the undoubted cultural hub of the Coffs Harbour region. As reflected in the relatively high house prices for such a remote town, funky people have been drawn from Sydney to Bellingen for over 40 years now. It’s not too late though, with the prices in Bellingen still trailing Byron Bay by a country mile. 

Median House Price: $510,000

Hip Score: 7

Hours Drive from Sydney: 6

4) Merimbula

Coastal Merimbula is a popular tourist destination and a beautiful town, featuring 2 large lagoon lakes and long picturesque beaches. Our analysis shows quite a strong showing of hip amenities like alternative therapies, cafes and restaurants and arts venues. There’s an annual winter jazz festival to show evidence of a local arts scene, but for now, Merimbula’s hipster potential is staying low key. All of our indicators show that this is a hipster powder-keg just waiting for a spark.

Median House Price: $431,000

Hip Score: 7

Hours Drive from Sydney: 6

3) Tamworth

Situated about halfway between Sydney and Brisbane, the New England town of Tamworth is a cultural hub of live music venues, art galleries and hand crafts. Combined with the low cost of living, it has all of the ingredients for a hipster’s paradise but for one factor – country music. Tamworth is famously the country music capital of Australia, and if your idea of hipness has to include progressive far-left politics, then Tamworth might not be your bag.

Median House Price: $342,000

Hip Score: 7

Hours Drive from Sydney: 5

2) Tighes Hill (Newcastle)

newcastle_olive_tree

Tighes Hill, along with neighbouring Islington and Carrington, is an old industrial area with heritage working class housing. Nestled between the CBD and the coast, Tighes Hill has a lot of residents who can cycle or walk to work or uni, and double the rate of creative professionals than the broader Newcastle area. Tighes Hill could be perfect for those who want the convenience and cultural diversity of Sydney’s inner suburbs, but at around half the price.

Median House Price: $565,000

Hip Score: 8

Hours Drive from Sydney: 2

1) Katoomba

This 19th Century resort-town in the Blue Mountains is still a major tourist attraction featuring the 3 Sisters Lookout and the Scenic World railway/skyway attractions. A long term shift from overnight and long stay tours to day trips has left the town rich in heritage buildings, but a little light on for tourists. This has set the scene for a burgeoning bohemian community, best observed at the annual Winter Magic solstice festival.

Median house price: $510,000

Hip Score: 8

Hours Drive from Sydney: 1.5

The tricky thing about hipster havens is that there are probably some great spots so underground that even we haven’t heard of them yet. You can use Microburbs to hunt for your own perfect area though. The Hip Score panel on all Microburbs reports breaks down the data behind the score. It also maps hip bars and restaurants in the area, with travel time, directions and ratings.

You can find your suburb’s hip score and Microburbs report now, just by searching here.

For press enquiries about this article, please call Microburbs Founder Luke Metcalfe on 0414 183 210.

Australia’s Top Suburbs for Your Family

Nothing’s more important than family. Much is made of capital growth and other financial factors, but many members of the Microburbs community are simply looking for a safe, happy home for themselves and their children. Convenience, hipness and lifestyle can take a back seat compared to a good environment for your kids to grow up in.

The Microburbs family score is a major statistical undertaking, involving several areas which are weighted and combined to give a final number. NAPLAN rankings of nearby schools are considered, for private options as well as government school catchments. Family amenities are considered, like parks and swimming pools. There are demographic considerations to check if there are young families in the area and if they’re mostly moving in or desperate to get out. Lastly, we undertake surveys to validate that our algorithms and data models reflect the way real families feel about types of areas.

Now that you’re an expert on the science of family scores, let’s explore Australia’s biggest cities for the top ranked suburbs for families.
 

Sydney

Sydney has around 200 suburbs with Family Score of 10, and a city average of 8.3. That may seem like a lot of family burbs, but remember Sydney is a sprawling metropolis with over 650 suburbs. The top of the top scorers are in the North Shore and Northern Beaches areas, and certainly come at a price. The average of the median house prices in our top 10 family areas for Sydney is around 2 million dollars – more than double the already steep citywide median price.

Rank Suburb Family Score
1 South Turramurra 10
2 Willoughby East 10
3 St Ives Chase 10
4 Beecroft 10
5 Middle Cove 10
6 Balgowlah Heights 10
7 Castlecrag 10
8 North Balgowlah 10
9 Curl Curl 10
10 Naremburn 10


Melbourne

Melbourne has 94 suburbs with family score 10. The citywide average for family score is 8.1, trailing Sydney only slightly. As with Sydney, however, the city’s top family burbs come at a premium, with the top 10 averaging a cool $1.5 million median price. Most of the top scorers are in the inner East or North East, with the exception of coastal Beaumaris.

Rank Suburb Family Score
1 Alphington 10
2 Beaumaris 10
3 Camberwell 10
4 Eaglemont 10
5 Balwyn 10
6 Blackburn 10
7 Ivanhoe East 10
8 Ivanhoe 10
9 Mont Albert North 10
10 Surrey Hills 10


Brisbane

Brisbane lags the other state capitals somewhat in the family score stakes. There are 40 suburbs in Brisbane with a family score of 10, which is plenty to choose from, but nowhere near Melbourne’s 94 or Sydney’s 200. Brisbane’s average family score, at 7.8, also lags behind the other big cities. Still, the differences are slight, and Brisbane is still a great city for families with lots of exceptional family suburbs.

Rank Suburb Family Score
1 Bardon 10
2 Fig Tree Pocket 10
3 Chelmer 10
4 Graceville 10
5 Ashgrove 10
6 Chapel Hill 10
7 Seven Hills 10
8 Pinjarra Hills 10
9 Pullenvale 10
10 Upper Brookfield 10


Perth

Perth scores very well across the board for Microburbs family score. There are 65 suburbs in Perth with a top family score, or around a quarter. The citywide average is a family score of 8.2, which means you can’t go too far wrong in terms of locating your family in Perth. With rents having dropped 13% in Perth, there’s a lot to recommend it for the relocating family. Our top burbs for families mostly line the river, with Cottesloe, Swanbourne and Dalkeith on the North side and East Fremantle, Alfred Cove, Rossmoyne and Mt Pleasant on the South.

Rank Suburb Family Score
1 Floreat 10
2 Wembley Downs 10
3 Swanbourne 10
4 Dalkeith 10
5 Nedlands 10
6 Alfred Cove 10
7 Claremont 10
8 Mount Pleasant 10
9 Cottesloe 10
10 Rossmoyne 10


Adelaide

In total, there are 49 Adelaide suburbs with the top family score of 10, against a respectable city average of 8.0. With the exception of Heathpool and Marryatville in nearby City of Norwood, the top family burbs of Adelaide are found in the affluent Inner Eastern City of Burnside area.

Rank Suburb Family Score
1 Tusmore 10
2 Mount Osmond 10
3 Heathpool 10
4 Marryatville 10
5 Hazelwood Park 10
6 Leabrook 10
7 Linden Park 10
8 Burnside 10
9 Beaumont 10
10 Toorak Gardens 10


Regional Recommendations

Some honourable mentions are the Sunshine Coast in Queensland, Central Coast in NSW and Bellarine Peninsula in Victoria. All are regional coastal areas near the state capital which, on average, score higher for families than the capital. If you’re looking for a family area and frustrated with the big smoke, these may be regions to explore.


Microburbs Report – Family Score

The Family Score panel of each microburbs report includes the performance of all classes of local schools, along with catchment boundaries and travel times. For a limited time, we’re offering a comprehensive family scores report for all Australian suburbs, which we can send you instantly:

Oh no...This form doesn't exist. Head back to the manage forms page and select a different form.

 
For press enquiries about this article, please call Microburbs Founder Luke Metcalfe on 0414 183 210.

The Rate Cut Is Here: How Much Has It Earned You?

The recent rate cut is finally being passed on by lenders and your home loan rate could now be as low as  2.25%. It’s easy to gloss over financial news, but if you have a home loan, that’s money in your pocket. It could be a lot of money, depending on your current circumstances.

The big banks don’t think they have to pass this saving to you though. They count on their customers to skip boring headlines about the reserve bank and miss the news.

Even if you’re on a variable rate, have you checked lately that it’s keeping up with the best deals? Swapping lenders, or refinancing, is as easy as applying for a cheaper loan, then swapping out your old loan.

You could save thousands each month for your family, get free of your mortgage years earlier or boost up your super.

What can you save with the latest rate cuts? Find your new best rate in 2 minutes.


For press enquiries about this article, please call Microburbs Founder Luke Metcalfe on 0414 183 210.

Artificial Intelligence Identifies Australia’s Hippest Suburbs

Love em, or loathe em, Australia’s hipsters are at the bleeding edge of progressive culture, seeking out the edgiest trends for the rest of us to enjoy.

Identifying Australia’s hippest suburbs is not just important for those wishing to avoid exposure to ridiculous hairstyles and bizarre antics though. Hip areas are cultural beacons, driving demand and property price growth.

The Microburbs hip score is a complex algorithm involving a range of data sources to scientifically determine what’s cool, and what’s not. Demographically, hip areas have a lot of single people working in creative roles or studying at university. They tend to be ethnically diverse areas which are easy to commute on foot or bicycle. Hip areas are also rich in cultural destinations like top rating restaurants, cafes and pubs. Art galleries, body modification studios and yoga centres also light the way to Hipsterville.

Sydney and Melbourne have long battled it out for the title of Australia’s hippest cities. In the Hip Score stakes however, Sydney has 20 suburbs with the hip score of 10, while Melbourne has 21, so currently Melbourne has the edge.

Sydney Top Suburbs by Hip Score

Screen Shot 2016-05-23 at 9.41.59 pm

Sydney’s hip burbs cover two patches – the Inner East: East of the rail corridor from Surry Hills to Rushcutters Bay and the Inner West, from Chippendale and Redfern out to Newtown. The Inner East’s nightspots of Kings Cross and Oxford Street have suffered hard under Sydney’s lockout laws though, and it remains to be seen if Darlinghurst and Potts Point can weather the decline.

Rank Suburb Hip Score
1 Darlinghurst 9.9
2 Surry Hills 9.9
3 Darlington 9.8
4 Rushcutters Bay 9.7
5 Potts Point 9.7
6 Chippendale 9.7
7 Redfern 9.6
8 Elizabeth Bay 9.6
9 Newtown 9.6
10 Erskineville 9.5


Melbourne Top Suburbs by Hip Score

Screen Shot 2016-05-23 at 9.43.28 pm

Melbourne’s hip hotspots ring the inner city, with student stalwarts like Fitzroy and Collingwood in the North and St Kilda and Balaclava in the South East. The trendy high streets of Chapel Street, Brunswick Street and Gertrude Street are all within Melbourne’s hip zone.

Rank Suburb Hip Score
1 Fitzroy 9.6
2 St Kilda 9.5
3 Collingwood 9.5
4 Flemington 9.5
5 Windsor 9.5
6 West Melbourne 9.5
7 Balaclava 9.5
8 North Melbourne 9.5
9 Burnley 9.5
10 South Yarra 9.5


Perth Top Suburbs by Hip Score

Unlike Sydney and Melbourne, over in the West, the Perth CBD ranks highly on the hip list, along with neighbours West Perth, Northbridge and Highgate. Northbridge’s nightlife puts it ahead of Perth in the rankings to take first place in the state. Mount Lawley and North Perth rank next but currently narrowly miss out on scoring a 9. Close behind are Freemantle, with North Fremantle and South Fremantle.

Rank Suburb Hip Score
1 Northbridge 9.8
2 Perth 9.7
3 West Perth 9.7
4 Highgate 9.6
5 Leederville 9.4
6 Mount Lawley 9.3
7 North Perth 9.0
8 Fremantle 9.0
9 South Fremantle 9.0
10 North Fremantle 9.0


Brisbane Top Suburbs by Hip Score

Brisbane’s certified hip suburbs are topped by night spot Fortitude Valley, along with Petrie Terrace, West End, New Farm and Milton taking 9 point hip scores.

Rank Suburb Hip Score
1 Fortitude Valley 9.5
2 Petrie Terrace 9.5
3 West End 9.5
4 New Farm 9.5
5 Milton 9.5
6 Highgate Hill 9.3
7 Bowen Hills 9.3
8 Newstead 9.2
9 Teneriffe 9.2
10 Kelvin Grove 9.0

The NT, SA, Tasmania and ACT are yet to have a suburb score the hip list with a 9 point score, but we will continue watching closely, especially inner areas of Adelaide and Hobart.

The Hip Score panel on all Microburbs reports breaks down the data behind the score. It also maps hip bars and restaurants in the area, with travel time, directions and ratings.

You can find your suburb’s hip score and Microburbs report now, just by searching here.

 
For press enquiries about this article, please call Microburbs Founder Luke Metcalfe on 0414 183 210.

Panama Papers Release Reveals Top Tax Avoiding Australian Areas

What do Geraldton, WA and Mackay in Queensland have in common? Well, apart from being remote coastal towns, they also appear surprisingly often in the Panama Papers – the leak of Panamanian firm Mossack Fonseca’s customer data.

The Panama Papers contain a wealth of fascinating revelations about Australians and their relationship with offshore tax havens. There are, of course, many legitimate reasons to retain a Panamanian law firm, and we are not implying any wrongdoing by the companies and individuals revealed in the documents.

There are 1409 Australian addresses listed in the Panama Papers, with state capitals featuring heavily.  There were only a handful of addresses in all of the ACT, SA, NT and Tasmania, so we’ll skip the top lists there.

NSW Top 10 Postcodes
Postcode Suburb Addresses
2000 Sydney CBD 51
2067 Chatswood 12
2065 St Leonards 9
2028 Double Bay 9
2121 Epping 9
2072 Gordon 9
2118 Carlingford 7
2220 Hurstville 7
2030 Vaucluse 7
2070 Lindfield 6

Sydney, 2000 is the nation’s most included postcode, being home to scores of legal and accounting firms. Notable for NSW though, is that the North Shore areas of Chatswood, St Leonards, Gordon and Lindfield are so highly represented, relative to only a few addresses in the affluent Eastern suburbs. Hurstville and Carlingford also make somewhat unexpected frequent appearances in the Mossack Fonseca customer database.

QLD Top 10 Postcodes
Postcode Suburb Addresses
4211 Nerang 21
4217 Surfers Paradise 13
4740 Mackay 10
4109 Sunnybank 9
4069 Brookfield 9
4227 Reedy Creek 8
4214 Arundel 8
4000 Brisbane 7
4113 Eight Mile Plains 7
4215 Southport 7


In QLD it’s the Gold Coast which dominates the top postcodes. Nerang, Surfers Paradise, Reedy Creek, Arundel, Eight Mile Plains and Southport fill the top postcodes. Sunnybank, Brookfield and Brisbane CBD are the Brisbane areas mentioned in the records, along with geographic outlier of Mackay appearing in 10 customer accounts.

Victoria Top 10 Postcodes
Postcode Suburb Addresses
3000 Melbourne 19
3186 Brighton 7
3142 Toorak 6
3122 Hawthorn 6
3004 Melbourne 6
3103 Balwyn 5
3079 Ivanhoe 4
3101 Kew 4
3124 Camberwell 4
3109 Doncaster 4


Victoria’s top suburbs are a more predictable tour of the inner east, from Ivanhoe down to Brighton, from Toorak across to Doncaster. Overall Victoria has fewer addresses than NSW or Queensland, with even WA showing more offshoring interest.


WA Top 10 Postcodes
Postcode Suburb Addresses
6530 Geraldton 15
6000 Perth 14
6005 Kings Park 9
6150 Bateman 8
6011 Cottesloe 8
6153 Applecross 7
6012 Mosman Park 7
6009 Nedlands 7
6008 Subiaco 6
6010 Swanbourne 6


WA’s surprise offshoring hotspot is Geraldton. The city is home to 15 residential addresses listed in the leak, which is more than Perth’s central 6000 postcode. Perth’s inner suburbs have a fairly even distribution of offshoring addresses after Geraldton.
The leaks are now fully searchable online at the IJIC Offshore Leaks website. The data can be viewed by suburb or even by street address.

What can the PM afford to buy in Sydney?

Joe Hockey famously advised first home buyers to “get a good job that pays good money”. How about the top job? The Prime Minister of the Commonwealth of Australia earns no less than $507,000 a year. That’s got to give us some serious buying power, right? How much could you really afford in the PM’s home town of Sydney?

First things first, we need to pay tax. Assuming we haven’t got a handful of negatively geared properties already, our tax bill is $202,000. That leaves us $301,000 though, which is still more money than most first home buyers can dream of.

To avoid mortgage stress, your mortgage repayments should be less than 30% of your income, or about $92000. Of course we’ll be getting our loan at the great Microburbs rate of 3.89%.

According to the government’s own MoneySmart calculator, annual repayments of $92,000, at 3.89% gives you borrowing power of… $1,450,000.

Wait a minute. That’s not very much really. The median house price in Sydney is around $1,000,000. The median prices in 172 Sydney suburbs is over our budget!

Naturally anything in Sydney with a view of the Harbour, close to beaches or close to the CBD is off the table. Likewise, the inner west, north shore and more affluent parts of suburbia are way out of your reach.

North western suburbs like Cheltenham, Beecroft and Pennant Hills may be out, but if you’re prepared to go a little further, Castle Hill is a mere 26 km to the city and is still in your budget until the metro opens there in 2019.

Houses in Strathfield are out, but neighbouring Burwood would be ok. Dulwich Hill has become too popular for the likes of the PM, but Hurlstone Park or Ashbury, beyond the reach of the light rail, are still options.

That’s not to say there aren’t some houses below the median price in inner areas.

This inner west terrace house is almost within our budget, with an auction guide price of $1,500,000. Could this fixer-upper be our answer to the Whitehouse or Number 10?

Over to the Microburbs Property Report to find out!

This inner west terrace has a hip score of 8 and an affluence score of 10. Unfortunately it only scores a 4 for safety, so we may need to put on a few more protective services officers.

Of course there’s still the deposit. You’ll need about 3 years of PM’s pay to get that together. Unfortunately, nobody has been able to last in that job that long in nearly a decade.

If you find your mortgage a pain too, you can at least get a better interest rate. Get access to our exclusive lenders and reduce your rate to as low as 3.89% now!

Microburbs Lifestyle Score – Are you in a hot spot or a dead zone?

Microburbs Lifestyle Score ranks every location in Australia based on lifestyle venues, like cafes, restaurants, bars, beaches and gyms. 

Everyone knows that location is vital in finding a property. That’s one aspect that no amount of renovations can change. What makes a good location though? How can you pick the spots that you, or your tenants will love to live?

A fundamental factor is lifestyle. Australians have become coffee connoisseurs, craft beer drinkers and gourmet diners. In increasingly dense cities, your local cafe or restaurant is where you meet friends and family.

Life in a vibrant lifestyle location is so much better than in a social wasteland, and property demand (and price growth) will follow.

Single Origin Roasters Cafe, Surry Hills. Photo: smudgeeats

Microburbs Lifestyle Score is the ranking that lets you easily sort and compare lifestyle quality in any place in Australia.

The Microburbs Lifestyle Score ranks an area or property between 1 to 10, with 1 being totally lifeless and 10 being a vibrant social hub.

Because lifestyle means different things in different areas, the Microburbs ranking takes into account all types of destinations.

In Surry Hills and Fitzroy, lifestyle means cafes and bars. At Bondi, or Eagle Bay in WA, it means beautiful coastline. In Northbridge, WA and Fortitude Valley, QLD, lifestyle is clubbing and nightlife.

Most of all, a high lifestyle rank means having a large number and wide variety of nearby options.

Cottesloe

Microburbs founder, Luke Metcalfe says “A location offering a great lifestyle is so important to property seekers. People want a variety of dining options, quality coffee and inviting bars, all within walking distance.”

“To be considered in the Lifestyle ranking, places like bars, cafes and restaurants must be within 5 minutes walk. Beaches and pools are counted if they are within a 5 minute drive, or 30 minute walk.”

Rankings are done at a Microburb level, being small areas within suburbs with around 400 people. That’s important, because Australian suburbs can be quite large, and the lifestyle at one side of a suburb can be totally different to the other side.

The lifestyle panel on all Microburbs reports breaks down the data behind the score. It maps each place to go in the area, with travel time, directions and ratings.


You can find your lifestyle score and Microburbs report now, just by searching here.

New Maps for Crime, Zoning and Mobile Coverage

This week on Microburbs we’ve rolled out several new features to make our free reports even better.

The Tranquility panel now maps local land use by colour, showing nearby industrial and commercial zones, which may affect the area. The data tracks each individual building; even finer than the usual microburb level.

On our communications panel we now show coverage maps for all mobile networks. These clearly show whether you will get 3G or 4G data indoors and outdoors.

Finally, NSW reports now have safety scores with heat maps for crime hotspots, as well as a map for each category of crime. These maps again are super fine grained to show you exactly what’s going on in your area.

Explore New Maps on Microburbs