Can’t Get A Great Halal Snack Pack? Sell Your House.

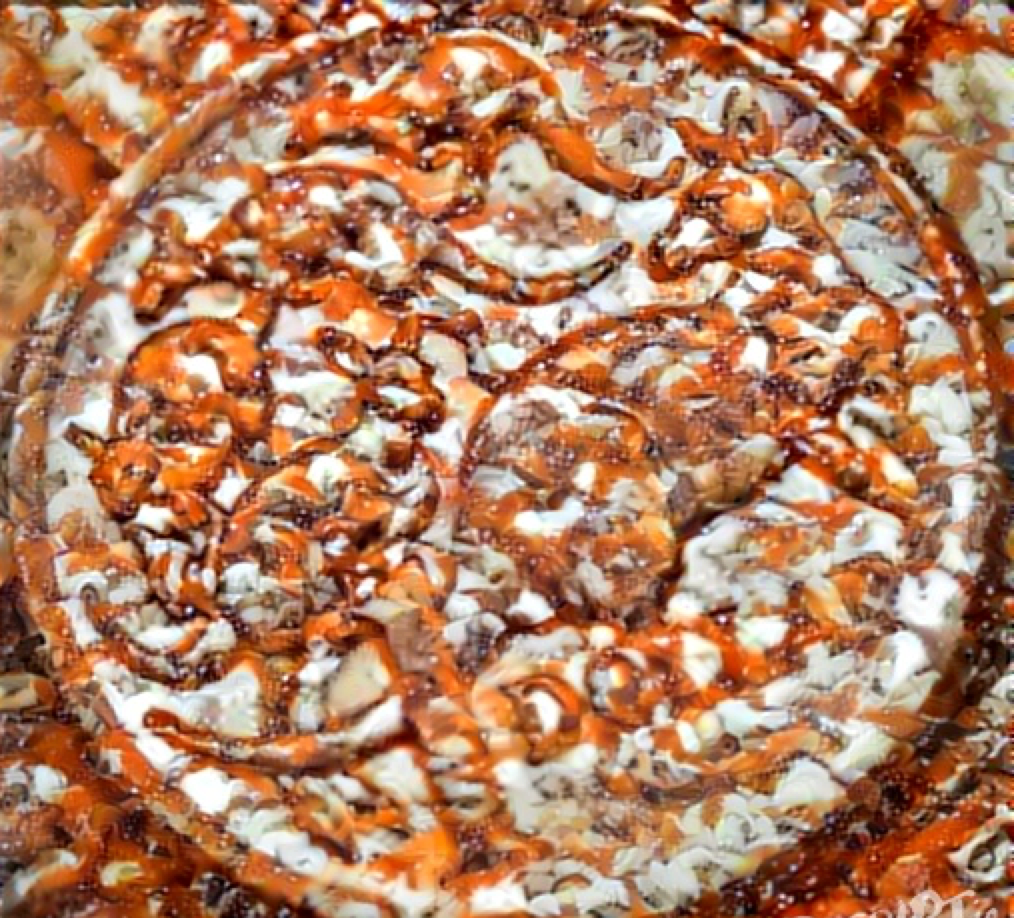
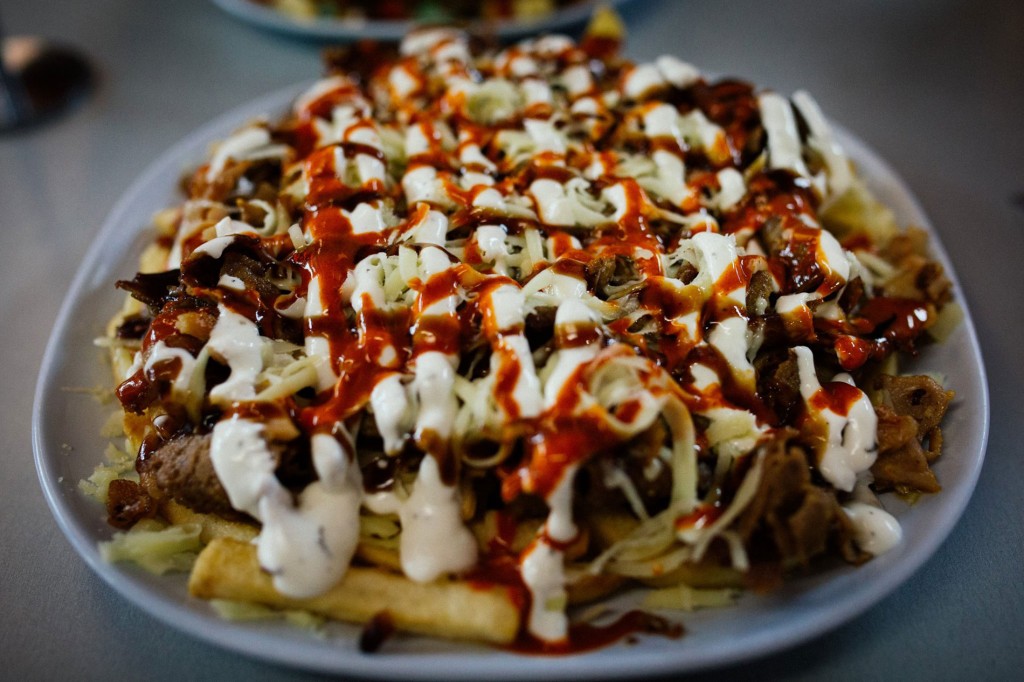
The Halal Snack Pack, for those who have somehow missed it, is a kebab store dish on the rise. From the massive online Halal Snack Pack Appreciation Society, to TV stunts between politicians, it’s not just a trending snack food but a symbol of Australian multiculturalism. It is best described as a dish containing halal-certified doner kebab meat, hot chips and the ‘holy trinity’ of sauces – chilli, garlic & barbeque.

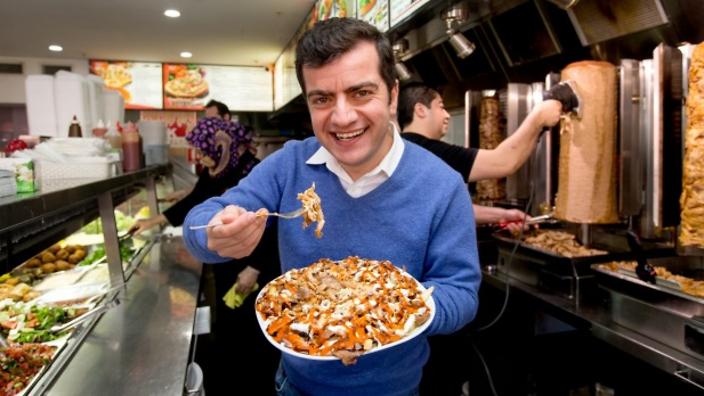
(Senator Sam Dastyari – Photo by SBS)

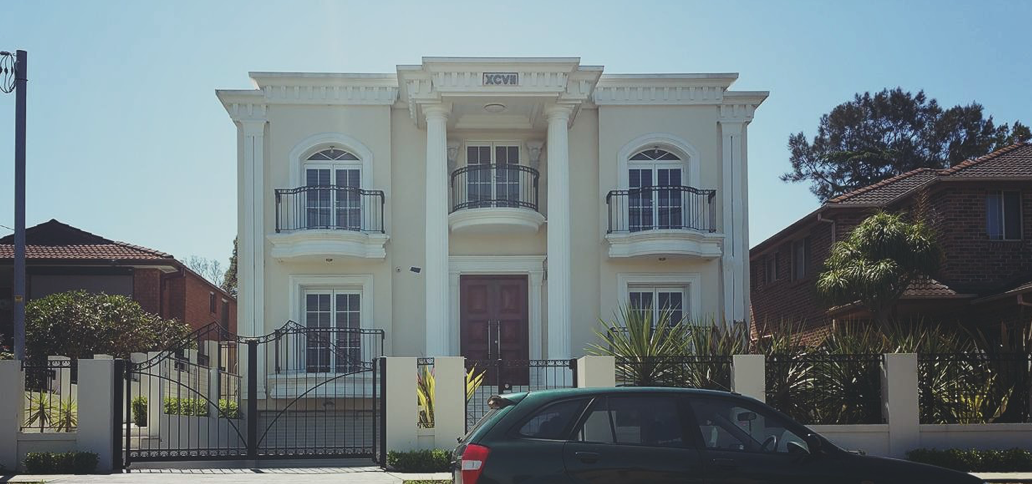
The snack sensation is even set to cross over into real estate. The most Muslim dominated suburbs have also seen property prices increase by 37% nationally, smashing the national average, and ‘buy near a great Halal Snack Pack shop’ might be the best, weirdest investment advice of 2016. 

We’ll focus on three Sydney suburbs that have had the best rated HSP in Australia and give a very brief overview of unique investment strategies for each one. These strategies are to give examples of the potential in these areas and are general information only. It’s important to consider your individual needs and get qualified advice before making any big decisions. 

Campbelltown – Granny Flats

Suburb: Campbelltown

Growth: 14.1%

Best HSP: King Kebabs

Strategy: Granny Flats

Free Microburbs Report: Here

King Kebabs Campbelltown is currently Sydney’s no.1 spot for HSP. Coincidentally, Campbelltown is also a sleeping giant in terms of property investment.

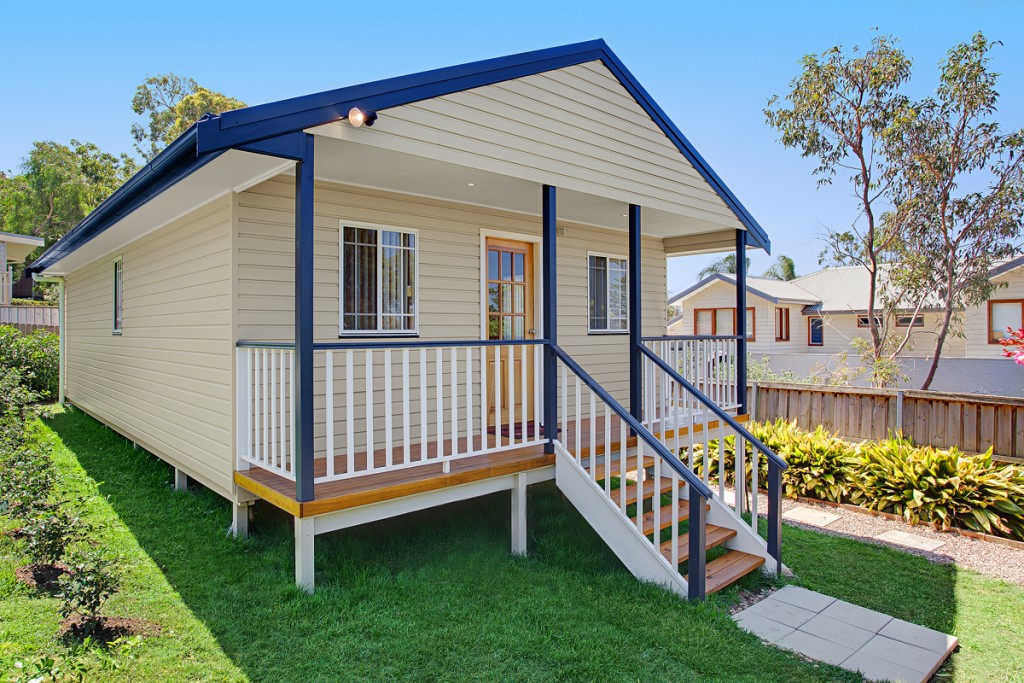
Located on the southern edge of metropolitan Sydney, C-town has had 14.1% growth in the past year. The key selling point for investment is that some of the older houses with large land sizes have the potential for granny flats to be built on them. The key benefit of building granny flats is that you can secure rent from both the tenants of the original house and the new granny flat at the same time. In today’s low interest rate environment, this investment can pay itself off and in many cases be positively geared.

What makes Campbelltown attractive is that the median house price is $580,000, nearly half the Sydney median.

It is possible to buy relocatable/portable granny flats from $80,000 (plus council contribution) including installation costs. Watch out for super low priced relocatables which may leave out major installation costs plus other essentials.

If you want to build on site, average costs range from $100,000 – $120,000 which doesn’t include council contributions that vary council to council.

The maximum size for a 2 bedroom granny flat is 60sqm. Additionally, the granny flat will need to be located at least 3m from the house, 3m from the back fence and 1m from the side fences.

If you’re concerned about being able to find tenants this far from the city, our data shows Campbelltown has a family score of 8/10. This is characteristic of suburbs in outer western Sydney where many families prefer the larger availability of day-care and schools (compared to the inner-west).

Blacktown – Duplexes

Suburb: Blacktown

Growth: 11.5%

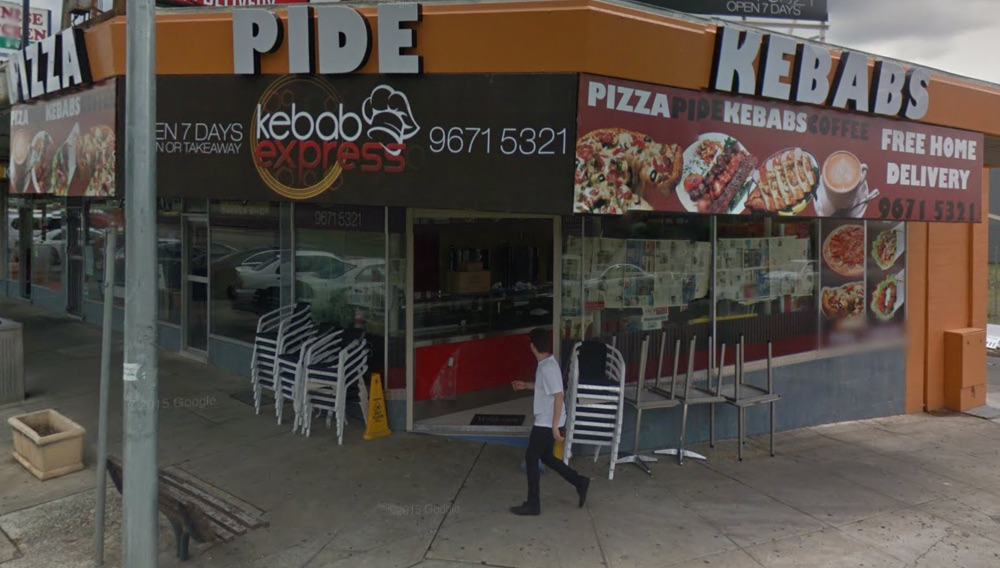
Best HSP: Kebab Express Blacktown

Strategy: Duplexes

Free Microburbs Report: Here

Kebab Express Blacktown is another top rated HSP location, and my personal favorite. Whilst they sadly no longer offer Shisha, it is open until midnight for all your late night banter.

For investment, the southern parts of Blacktown contain many properties with large land size and small houses. These properties are often over 1000sqm. Apart from the potential for granny flats, this also opens the opportunity for building a duplex or subdiving into two lots.

Once built, a duplex can then be strata titled and sold off individually for a great return. Whilst there are plenty of risks that could come into this, this strategy has been quite popular with investors across Australia in recent years.

Another strategy is to subdivide the property into two lots, build a duplex at the back lot, sell the old house at the front lot and rent out the new houses.

Despite the myth that Western Sydney has no culture, Blacktown has a Microburbs lifestyle score of 8/10, and our comprehensive report shows why. The Westpoint shopping centre has plenty to see and do, and there’s a great diversity of restaurants, including Ethiopian, Italian, Indian, Mexican and more. The motorway junction also makes Blacktown quick to reach by road from any side of Sydney. 

Kingswood- Rooming Houses

Suburb: Kingswood

Growth: 13.7%

Best HSP: Pizza Stop Kingswood

Strategy: Rooming Houses

Free Microburbs Report: Here 

Located near Penrith is the well known ‘Pizza Stop Kingswood’ which consistently gets 10/10’s on the HSPAS page.

With a three bedroom median house price of 590k and growth rate of 13.7%, it is a great opportunity for first time investors in one particular strategy known as rooming houses.

Located between the large Nepean hospital in Penrith and the Western Sydney University campus, there will be large demand from tenants seeking affordable options.

Simply put, rooming houses are a type of rental set-up where in a single house, each room is rented out to separate tenants. This strategy can be applied to any house, but during your research remember to check with the following agencies to be clear on the different rules for each council:

  • Local council
  • Department of Fair Trading
  • Residential Tenancy Act
  • Department of housing NSW

A tip for investors is to find a trustworthy handyman and build a good a good relationship with them. With all your properties, you’ll need someone who can fix things reliably and give their own advice on property management from a technical perspective.

If you would like to find out more about the investor data, hip score, safety score and much more about any suburb in Australia, you can search here: 

Also check out our other article about ethnic groups with the best real estate gains in Australia (spoiler: the Chinese aren’t no. 1.) 

For press enquiries about this article, please call Microburbs Founder Luke Metcalfe on 0414 183 210.

One Migrant Group’s Neighbourhoods Grew 48% … And It’s Not the Chinese

Our analysis reveals how canny new migrants are benefiting from Australia’s property boom, and why Westerners are falling behind.

It’s a sensitive subject, but not all ethnic groups are profiting equally in Australia’s property boom. In fact, nothing could be further from the truth. Our findings tell a different story to the stereotype of the Anglo Australian baby-boomer couple as the key beneficiary of the property growth.

I’ve often asked people “what do you think is the strongest demographic factor that influences growth”? Chinese, and other migrants, often laugh and say something like “Do you really want me to say? It’s not politically correct”.

At Microburbs, we use data science, machine learning and big data analytics to explain Australia’s real estate market. As such we’re very interested in growth factors, and leading growth indicators. The clear growth indicator nobody is talking about is ethnic and migrant communities. Areas where some migrant groups concentrate have greatly outperformed the average.

Our research has found that Microburbs with the highest proportions of indigenous and Northern European people did not grow much in the past 5 years, while southern European and Asian dominated areas mostly did incredibly well.

How did we find this? We started with Microburbs – small areas of a few blocks, with around 400 people. We then picked the 500 Microburbs that were the most concentrated for each ancestry using data from the 2011 census from the Australian Bureau of Statistics. Next we looked at the price of property in those top 500 Microburbs for that ethnicity and compared the 2012 median property price to the 2016 median property price to get a growth rate.

So, is it the Chinese who are most prevalent in the high growth areas? Well, there is certainly a correlation between Chinese areas and high growth, but the ethnic group which is associated with the best performing areas is actually the Lebanese. 

Birthplace of parents Median house price 2012 Median house price 2016 Growth Top suburbs (% growth)
Lebanese $540,000 $800,500 48% South Granville (74%), Greenacre (55%), Condell Park (36%)
Chinese $785,000 $1,150,000 46% Berala (33%), Eastwood (NSW) (62%), Hurstville (75%)
Korean $814,000 $1,170,000 44% Dundas Valley (84%), Eastwood (NSW) (62%), Oatlands (NSW) (41%)
Greek $768,400 $1,100,000 43% Sans Souci (57%), Earlwood (58%), Kingsgrove (57%)
Vietnamese $430,000 $595,000 38% Cabramatta (48%), Cabramatta West (60%), Canley Vale (78%)
Spanish $445,000 $604,250 36% Wetherill Park (80%), Hinchinbrook (NSW) (46%), Bossley Park(53%)
Croatian $480,000 $630,000 31% Forde (21%), Munster (9%), Oran Park (25%)
Filipino $460,000 $595,000 29% Burnside Heights (28%), Plumpton (NSW) (51%), Ropes Crossing(43%)
Maltese $460,000 $588,145 28% Taylors Hill (17%), Catherine Field (28%), Oran Park (25%)
Serbian $445,000 $561,000 26% Bonnyrigg Heights (46%), Dandenong North (34%), Mount Pritchard (77%)
Russian $691,500 $850,000 23% McKinnon (64%), Bentleigh East (61%), Carnegie (63%)
Polish $435,000 $529,975 22% Ardeer (32%), Bell Park (21%), Brighton East (53%)
Indian $515,000 $620,000 20% Wentworthville (54%), Parklea (43%), Girraween (NSW) (57%)
Dutch $390,000 $465,000 19% Mount Evelyn (33%), Monbulk (20%), Officer (-4%)
New Zealander $420,000 $495,000 18% Upper Coomera (19%), Maudsland (19%), Pacific Pines (16%)
Welsh $451,500 $525,000 16% Secret Harbour (7%), Apollo Bay (Vic.) (16%), Coal Point (14%)
Hungarian $487,500 $560,000 15% Selby (-1%), Hindmarsh Island (-3%), Bell Post Hill (1%)
Maori $355,000 $405,000 14% Upper Coomera (19%), Marsden (23%), Meadowbrook (10%)
Sinhalese $487,000 $548,750 13% Lynbrook (28%), Roxburgh Park (16%), Lyndhurst (Vic.) (32%)
Macedonian $489,000 $550,000 12% Port Kembla (38%), Banksia (64%), Lalor (33%)
English $420,000 $470,000 12% Stirling (SA) (25%), Bridgetown (22%), Mindarie (WA) (24%)
Italian $600,000 $665,000 11% Ingham (-17%), Greenvale (Vic.) (4%), Haberfield (71%)
South African $650,000 $720,000 11% Moggill (9%), St Ives Chase (72%), St Ives (NSW) (63%)
Australian $292,000 $318,500 9% South Grafton (-4%), Gilgandra (24%), Aberdeen (NSW) (-26%)
Turkish $440,000 $462,000 5% Auburn (NSW) (72%), Meadow Heights (12%), Roxburgh Park(16%)
Scottish $515,000 $518,000 1% Aireys Inlet (18%), Sorrento (Vic.) (13%), Lorne (Vic.) (-12%)
German $309,000 $310,000 0% Gatton (19%), Murray Bridge (15%), Boonah (Qld) (0%)
French $660,000 $660,000 0% Killarney Heights (44%), Apollo Bay (Vic.) (16%), South Coogee(62%)
Australian Aboriginal $303,750 $299,000 -2% Murgon (-10%), Goolwa South (11%), Kuranda (1%)
Irish $617,000 $586,250 -5% Apollo Bay (Vic.) (16%), Bardon (4%), Ashgrove (23%)

Now you might be thinking that this is clear evidence that some ethnic groups are sharper investors than others. It’s not that simple though. We have a connection, sure, but there’s more to the story.

Firstly, areas where people report their ethnicity as “Australian” or from the British Isles tend to settle in rural and regional areas, which don’t show strong growth. Take the Scottish community in Lorne, Victoria, which has seen median property prices fall 12% in the last 4 years in their town.

This is similar for people of Northern European ancestry. They seem to prefer living in places where there is more space, and as  such more land. Australia’s most German areas include Murray Bridge in regional SA and Boonah in regional QLD, for instance.

Asian migrants, on the other hand, tend to move into big cities and high density areas – close to shops and work. These areas tend to be short on land already, and increased popularity with an ethnic community increases demand, which drives price growth. They also tend to drive NAPLAN scores up.

Heading out of the cities, the link between indigenous communities and decreased median prices is explained by these communities typically being in very remote regional areas. Our country towns have certainly not shared equally in the recent property price growth.

It’s also worth noting that we’re comparing where these communities were living in 2011 with the increased cost of buying property. There’s every chance that these properties are being rented by the occupants and the beneficial owners could be from a totally different demographic. 

We can clearly see that different ethnic communities come to Australia seeking different lifestyles, which leads them to settle in different areas.

A quick and clever way to demonstrate these cultural differences is with a few Google Image searches. By translating ‘Australia’ into several languages and running a google image search, you’ll see very different Australias for different languages.

Searching for the word “Australia” in Arabic and Chinese gives you Australia’s most exclusive real estate, the Sydney Harbour foreshore:

image02

While searching for “Australia” in French and German gives you dirt cheap real estate, The Outback:

image00

So if Northern Europeans aspire to nature and wide open spaces, they can have it, and cheaply. But they shouldn’t be surprised not to do see any capital growth, because the very thing that attracts them to it – the expansive land – means also that there’s endless supply thereof.

So we can see the Western love of nature improving their housing affordability but also depriving them of capital growth.  

On the flip side, successive waves of immigrants who aspire to our big cities will continue to benefit from the fact that demand outweighs supply in those areas, assuming they can get a foot on the property ladder.

To identify migrant communities and explore the ethnic make up of your potential investment areas, search for the suburb or address below and head to the Ethnicity section of any Microburbs report.

For press enquiries about this article, please call Microburbs Founder Luke Metcalfe on 0414 183 210.