Our analysis reveals how canny new migrants are benefiting from Australia’s property boom, and why Westerners are falling behind.

It’s a sensitive subject, but not all ethnic groups are profiting equally in Australia’s property boom. In fact, nothing could be further from the truth. Our findings tell a different story to the stereotype of the Anglo Australian baby-boomer couple as the key beneficiary of the property growth.
I’ve often asked people “what do you think is the strongest demographic factor that influences growth”? Chinese, and other migrants, often laugh and say something like “Do you really want me to say? It’s not politically correct”.
At Microburbs, we use data science, machine learning and big data analytics to explain Australia’s real estate market. As such we’re very interested in growth factors, and leading growth indicators. The clear growth indicator nobody is talking about is ethnic and migrant communities. Areas where some migrant groups concentrate have greatly outperformed the average.
Our research has found that Microburbs with the highest proportions of indigenous and Northern European people did not grow much in the past 5 years, while southern European and Asian dominated areas mostly did incredibly well.
How did we find this? We started with Microburbs – small areas of a few blocks, with around 400 people. We then picked the 500 Microburbs that were the most concentrated for each ancestry using data from the 2011 census from the Australian Bureau of Statistics. Next we looked at the price of property in those top 500 Microburbs for that ethnicity and compared the 2012 median property price to the 2016 median property price to get a growth rate.
So, is it the Chinese who are most prevalent in the high growth areas? Well, there is certainly a correlation between Chinese areas and high growth, but the ethnic group which is associated with the best performing areas is actually the Lebanese.
| Birthplace of parents | Median house price 2012 | Median house price 2016 | Growth | Top suburbs (% growth) |
|---|---|---|---|---|
| Lebanese | $540,000 | $800,500 | 48% | South Granville (74%), Greenacre (55%), Condell Park (36%) |
| Chinese | $785,000 | $1,150,000 | 46% | Berala (33%), Eastwood (NSW) (62%), Hurstville (75%) |
| Korean | $814,000 | $1,170,000 | 44% | Dundas Valley (84%), Eastwood (NSW) (62%), Oatlands (NSW) (41%) |
| Greek | $768,400 | $1,100,000 | 43% | Sans Souci (57%), Earlwood (58%), Kingsgrove (57%) |
| Vietnamese | $430,000 | $595,000 | 38% | Cabramatta (48%), Cabramatta West (60%), Canley Vale (78%) |
| Spanish | $445,000 | $604,250 | 36% | Wetherill Park (80%), Hinchinbrook (NSW) (46%), Bossley Park(53%) |
| Croatian | $480,000 | $630,000 | 31% | Forde (21%), Munster (9%), Oran Park (25%) |
| Filipino | $460,000 | $595,000 | 29% | Burnside Heights (28%), Plumpton (NSW) (51%), Ropes Crossing(43%) |
| Maltese | $460,000 | $588,145 | 28% | Taylors Hill (17%), Catherine Field (28%), Oran Park (25%) |
| Serbian | $445,000 | $561,000 | 26% | Bonnyrigg Heights (46%), Dandenong North (34%), Mount Pritchard (77%) |
| Russian | $691,500 | $850,000 | 23% | McKinnon (64%), Bentleigh East (61%), Carnegie (63%) |
| Polish | $435,000 | $529,975 | 22% | Ardeer (32%), Bell Park (21%), Brighton East (53%) |
| Indian | $515,000 | $620,000 | 20% | Wentworthville (54%), Parklea (43%), Girraween (NSW) (57%) |
| Dutch | $390,000 | $465,000 | 19% | Mount Evelyn (33%), Monbulk (20%), Officer (-4%) |
| New Zealander | $420,000 | $495,000 | 18% | Upper Coomera (19%), Maudsland (19%), Pacific Pines (16%) |
| Welsh | $451,500 | $525,000 | 16% | Secret Harbour (7%), Apollo Bay (Vic.) (16%), Coal Point (14%) |
| Hungarian | $487,500 | $560,000 | 15% | Selby (-1%), Hindmarsh Island (-3%), Bell Post Hill (1%) |
| Maori | $355,000 | $405,000 | 14% | Upper Coomera (19%), Marsden (23%), Meadowbrook (10%) |
| Sinhalese | $487,000 | $548,750 | 13% | Lynbrook (28%), Roxburgh Park (16%), Lyndhurst (Vic.) (32%) |
| Macedonian | $489,000 | $550,000 | 12% | Port Kembla (38%), Banksia (64%), Lalor (33%) |
| English | $420,000 | $470,000 | 12% | Stirling (SA) (25%), Bridgetown (22%), Mindarie (WA) (24%) |
| Italian | $600,000 | $665,000 | 11% | Ingham (-17%), Greenvale (Vic.) (4%), Haberfield (71%) |
| South African | $650,000 | $720,000 | 11% | Moggill (9%), St Ives Chase (72%), St Ives (NSW) (63%) |
| Australian | $292,000 | $318,500 | 9% | South Grafton (-4%), Gilgandra (24%), Aberdeen (NSW) (-26%) |
| Turkish | $440,000 | $462,000 | 5% | Auburn (NSW) (72%), Meadow Heights (12%), Roxburgh Park(16%) |
| Scottish | $515,000 | $518,000 | 1% | Aireys Inlet (18%), Sorrento (Vic.) (13%), Lorne (Vic.) (-12%) |
| German | $309,000 | $310,000 | 0% | Gatton (19%), Murray Bridge (15%), Boonah (Qld) (0%) |
| French | $660,000 | $660,000 | 0% | Killarney Heights (44%), Apollo Bay (Vic.) (16%), South Coogee(62%) |
| Australian Aboriginal | $303,750 | $299,000 | -2% | Murgon (-10%), Goolwa South (11%), Kuranda (1%) |
| Irish | $617,000 | $586,250 | -5% | Apollo Bay (Vic.) (16%), Bardon (4%), Ashgrove (23%) |
Now you might be thinking that this is clear evidence that some ethnic groups are sharper investors than others. It’s not that simple though. We have a connection, sure, but there’s more to the story.
Firstly, areas where people report their ethnicity as “Australian” or from the British Isles tend to settle in rural and regional areas, which don’t show strong growth. Take the Scottish community in Lorne, Victoria, which has seen median property prices fall 12% in the last 4 years in their town.
This is similar for people of Northern European ancestry. They seem to prefer living in places where there is more space, and as such more land. Australia’s most German areas include Murray Bridge in regional SA and Boonah in regional QLD, for instance.
Asian migrants, on the other hand, tend to move into big cities and high density areas – close to shops and work. These areas tend to be short on land already, and increased popularity with an ethnic community increases demand, which drives price growth. They also tend to drive NAPLAN scores up.
Heading out of the cities, the link between indigenous communities and decreased median prices is explained by these communities typically being in very remote regional areas. Our country towns have certainly not shared equally in the recent property price growth.
It’s also worth noting that we’re comparing where these communities were living in 2011 with the increased cost of buying property. There’s every chance that these properties are being rented by the occupants and the beneficial owners could be from a totally different demographic.
We can clearly see that different ethnic communities come to Australia seeking different lifestyles, which leads them to settle in different areas.
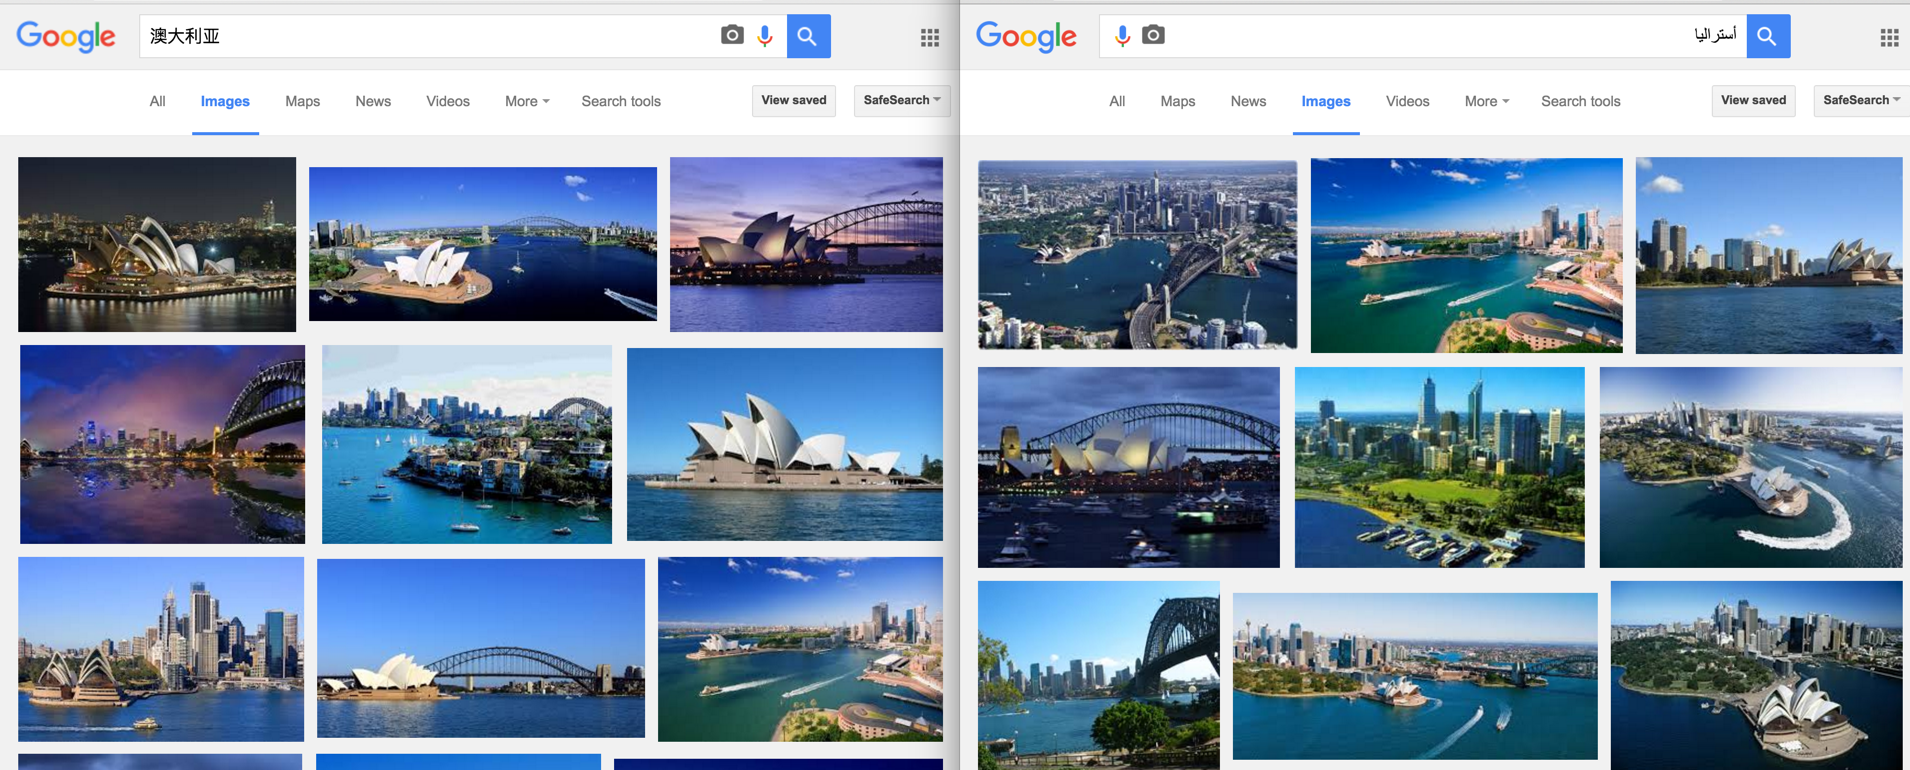
A quick and clever way to demonstrate these cultural differences is with a few Google Image searches. By translating ‘Australia’ into several languages and running a google image search, you’ll see very different Australias for different languages.
Searching for the word “Australia” in Arabic and Chinese gives you Australia’s most exclusive real estate, the Sydney Harbour foreshore:
While searching for “Australia” in French and German gives you dirt cheap real estate, The Outback:

So if Northern Europeans aspire to nature and wide open spaces, they can have it, and cheaply. But they shouldn’t be surprised not to do see any capital growth, because the very thing that attracts them to it – the expansive land – means also that there’s endless supply thereof.
So we can see the Western love of nature improving their housing affordability but also depriving them of capital growth.
On the flip side, successive waves of immigrants who aspire to our big cities will continue to benefit from the fact that demand outweighs supply in those areas, assuming they can get a foot on the property ladder.
To identify migrant communities and explore the ethnic make up of your potential investment areas, search for the suburb or address below and head to the Ethnicity section of any Microburbs report.
For press enquiries about this article, please call Microburbs Founder Luke Metcalfe on 0414 183 210.
Speak Your Mind