With some analysts predicting that real estate price growth may slow down in Sydney and Melbourne, real estate investing in Australia may no longer be all hot markets and high demand. Understanding where markets are hot and cold, fast and slow, is about understanding supply and demand, yield, days on market and OSI. But what does that all even mean?
Microburbs founder, Luke Metcalfe sat down with Jeremy Sheppard from DSR Data to get plain english explanations for the most important real estate investment metrics. In 2009, after building his career in IT and a portfolio of 16 properties, he launched DSR data to help make property investment more consistent and more effective for more people. Jeremy has been writing articles for Your Investment Property magazine since 2011, educating investors on how to use data to better their returns.

#1 “Vendor Discount”
This is the percentage difference between the original asking price and the eventual sale price. When a seller puts their property on the market, usually via real estate agent, they pick an initial asking price and it’s usually quite optimistic. Eventually the property sells – for a bit lower than that, usually – and that difference is, in percentage terms, your vendor discount. If we take the average vendor discount for all properties in a suburb, we can get a suburb vendor discount.
Why it matters
In locations where demand exceeds supply you’ll find that the vendor discount becomes quite low. In fact, you can even find that it’s negative where people start offering more than the asking price if they’re fighting over each other to try and get their hands on the limited number of properties that are available. In markets where supply exceeds demand you might find a discount in excess of about 10%, normal markets might be around about 5% and in very tight markets it will be zero or even negative. So the vendor discount is a great indicator of markets where demand exceeds supply.
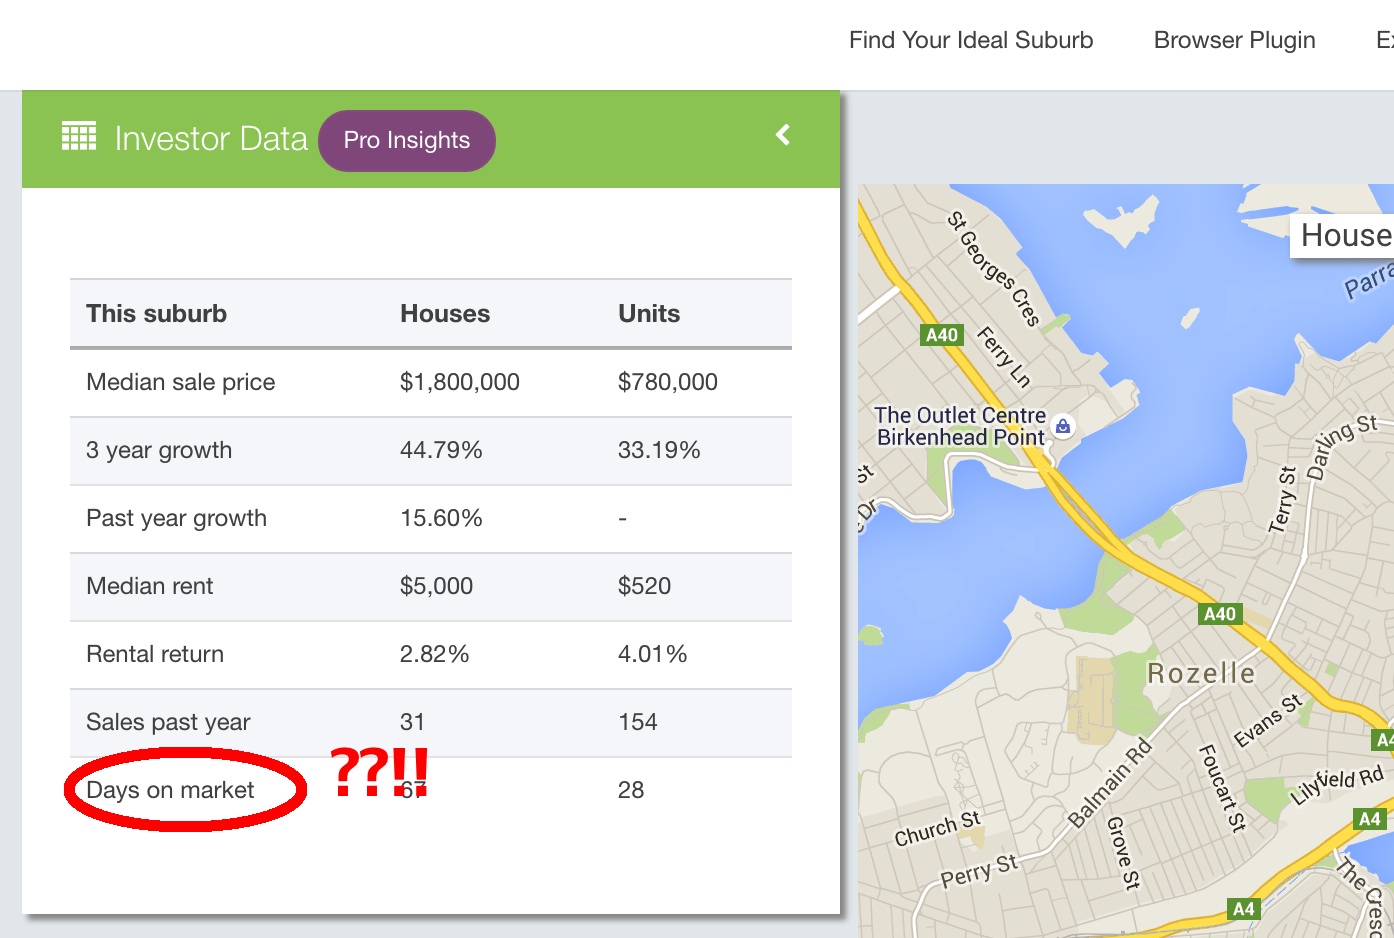
#2 “Days On Market”
This is the average count of the number of days it takes to sell a property once it is listed.
A real estate agent will list a property and people will come and visit it, they’ll look around and eventually someone will make a good offer and the vendor (the seller) will accept that offer and so the listing will be taken off the real estate’s portal etc. That period of time is the days on market.
Why it matters
The days on market generally gets very short in areas where demand exceeds supply. What happens is a whole bunch of people start competing over a small number of properties and they get desperate. They get urgent and so they try and get their due diligence done faster and they make quicker offers. They’re waiting for the next property to come on the market and they jump on it straight away so in high demand, low supply markets the days on market generally gets very small.
A typical sort of days on market might be around about 140 days, or about 3 and a bit months. Where it gets really tight is when you see days on market getting less than about 20 days. In some crazy markets where there is a massive oversupply you might see days on markets exceeding even a full year. So days on markets is a great indicator for demand exceeding supply when it’s a low figure.

#3 “Auction Clearance Rate”
Is the percentage of auctioned properties that actually sell at the auction or immediately after or just prior, rather than passed in. If bidding is fierce, you’ve got a large number of bidders at an auction, you will always find that the property sells. In markets where demand exceeds supply, that’s sort of typical and you will have very high auction clearance rates.
Why it matters
In markets where supply exceeds demand you’ll find not only a poor auction clearance rate but also less auctions. That’s because real estate agents will typically only choose auctions as a means to selling a property when the market suits it, and when that suits their vendor. So you’ll find high auction clearance rates when demand exceeds supply, low auction clearance rates and low counts of auctions in markets where supply exceeds demand. So the auction clearance rate and the number of properties sold by auction are excellent indicators of demand versus supply.
#4 “Proportion Of Renters To Owner Occupiers”
The proportion of renters to owner occupiers is the percentage of properties with residences that are renting but don’t actually own a property, so this can be a good indicator of supply levels for landlord-owned properties. As a property investor you are also a landlord – you will own property and you’ll rent it out to a tenant.
Why it matters
If you’re competing with other landlords then you may experience extended vacancies. You don’t want to have to compete, so you want to be ideally the only landlord in a local property market. That means you’re looking for markets where there’s a lower percentage of renters and you want most of them to be owner occupiers. Renters typically take less care of their properties than owner occupiers, so you may find the properties devalue a little bit more quickly in markets where there’s a heavy percentage of renters. Overall you ideally want a market with the lowest possible proportion of renters to owner occupiers.
#5 “Vacancy Rate”
This is the percentage of properties that are available to rent in a suburb that are currently vacant, so if you’ve got about 1000 properties in a suburb, and lets say 300 of them are owned by property investors, rented out to tenants, and then if you have 30 of those that are currently vacant than you have a 10% vacancy rate, which is a whoppingly high vacancy rate.
Why it matters
Vacancy rates are typically around about 2% – 3%. Anything less than about 2% is a helpful margin because as an investor obviously you don’t want to have a property that is vacant for a long period of time. So you’re looking for markets where there’s a vacancy rate as close to zero as possible. If it needs to be checked, a rough figure for vacancy rates, not in percentage terms, can be found by checking the rental pages of suburbs around Australia. See how many rental properties are currently listed, you may see some of them with a statement – available with some future date – so those aren’t currently vacant but they will become vacant and available at that future date. Vacancy rate, then, is a great indicator that property investors can use to make sure that they are going to have good rental income. A very low vacancy rate over an extended period of time will usually start to push yields up. Property managers will keep their eye on the market and they will inform their clients, the landlord, that this market could probably cope with an increase in rent, so low vacancy rates are usually a precursor to increasing rents and yields.
#6 “Yield”
The gross rental yield is the rent achievable in a year, divided by the value of the property as a percentage. Usually, if you’re getting a property for $400 a week in rent and it costs $400,000 in value than that’s typically about a 5% rental yield, in order for a property to be cashflow positive, with long term interest rates of around about 7%, you will need a yield close to about 9% for that to be a positively geared property. The Net Yield is the profit achievable in a year divided by the value of the property. That is, the rent, minus all expenses like rates, strata, financing etc.
Why it matters
Yield is of course is of great importance to investors because it’s all about cash flow, if you have strong cash flow, you can stay in the game and there’s less risk of you having to sell your property. For those who want to retire on a portfolio of positively geared properties, yield is very important, of course capital growth is the ants pants of investing but yield is what keeps you in the game, so looking for markets with a higher than average yield is usually a good choice for investors. You don’t want to go crazy with it, buying in mining towns or other regional towns that hinge on one industry because they could evaporate overnight. The yield, in general, you want to healthy. You don’t want to be buying in markets with a ridiculously low yield like 2.5% – 3%. The average nowadays is about 4% – 4.5% so anything about 5% or up is a healthy sign.
#7 “Stock On Market Percentage”
Is the number of properties that are currently listed for sale, as a percentage of the total number of properties in a market.This is a great indicator of supply in a market. You want low supply, high demand and the percentage stock is your supply indicator. You want this figure to be as low as possible, ideally 0%. That would mean that there are no properties currently available for sale, which of course makes it hard to enter the market.
Why it matters
The stock on market percentage typically is around about 1%. Ideally you want that, of course, to be lower. Some markets that are quite dangerous will have stock on market percentage of even 5% which is like 1 in 20 properties currently for sale. Stock on market percentage can be a little bit volatile from or time to time, so you need to look at a historical chart and just make sure that the long term average, at least over the last few months, is relatively stable. Stock on market is used in the Jeremy’s Demand Supply Ratio to measure supply. For a growth area, you want a high demand matched with the supply, just having low supply isn’t the only side of the equation, you also need high demand as well.

#8 “Online Search Interest”
This is a figure where the number of people searching for property online is compared with the number of properties available online. You want the most number of people searching for property (that represents demand) and the least number of property available for sale, which represents the supply.
Why it matters
The online search interest or OSI for short is a mini demand versus supply ratio, it’s only one statistic and it can suffer from some anomalies but overall it’s not a bad indicator and when combined with other statistics it can be quite useful for investors targeting locations with high demand versus supply.
Have you found some of these useful when you invested?
If you’re ready to find your investment property go to microburbs.com.au to find the next neighourhood ready to boom!
For press enquiries about this article, please call Microburbs Founder Luke Metcalfe on 0414 183 210.