Coalition loses rich, migrants. Labor gains miners. Far right gains Middle Easterners.

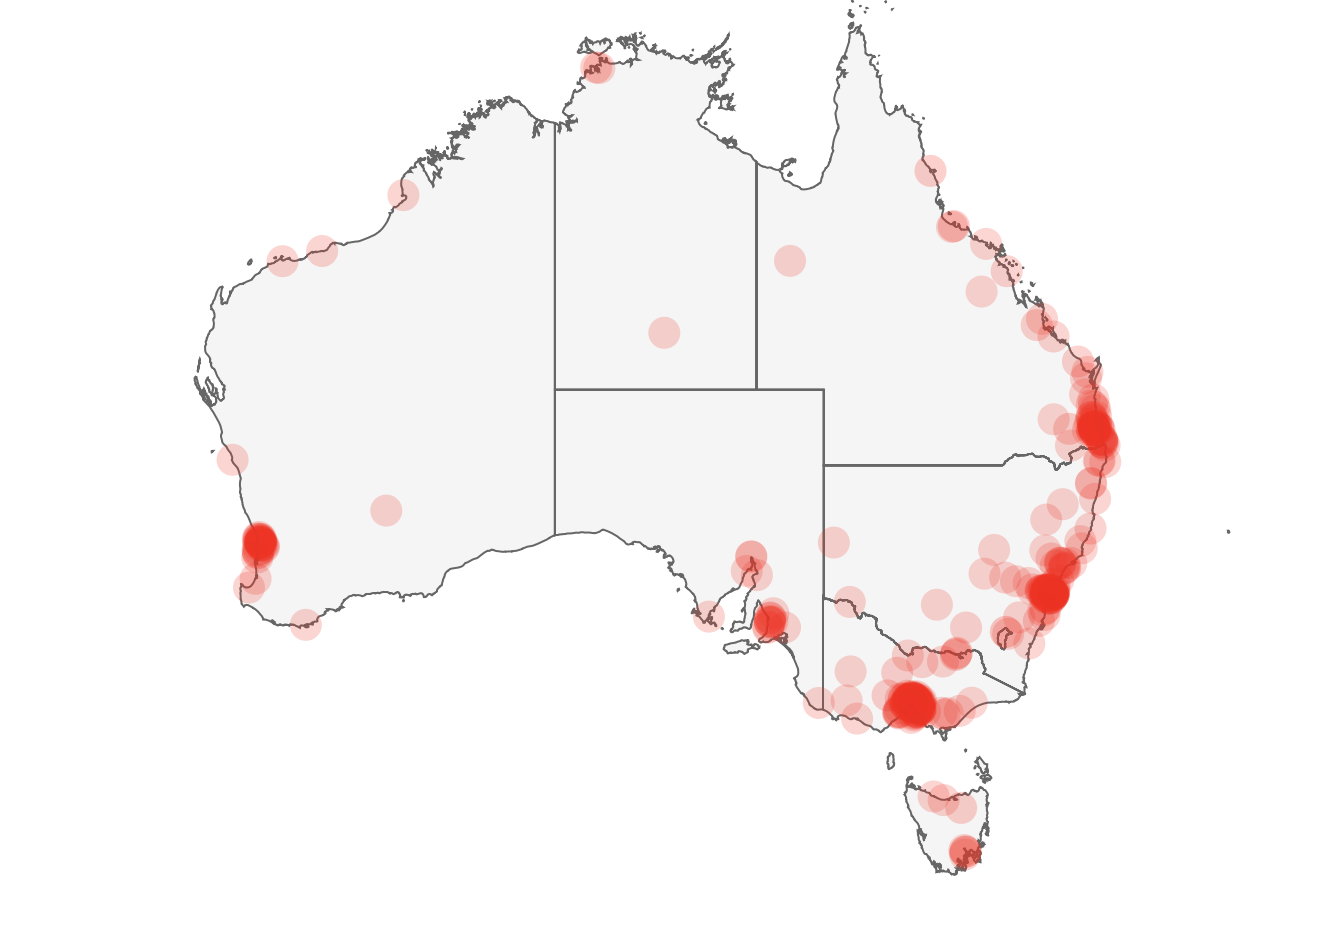
A Microburbs analysis: I analysed every polling booth’s vote in yesterday’s federal election to find high resolution insights on where Australian politics is heading.

Most of the commentary we see so far is on an electorate level, but there are far more polling booths than electorates, so we can much more confident about analysis at this level.

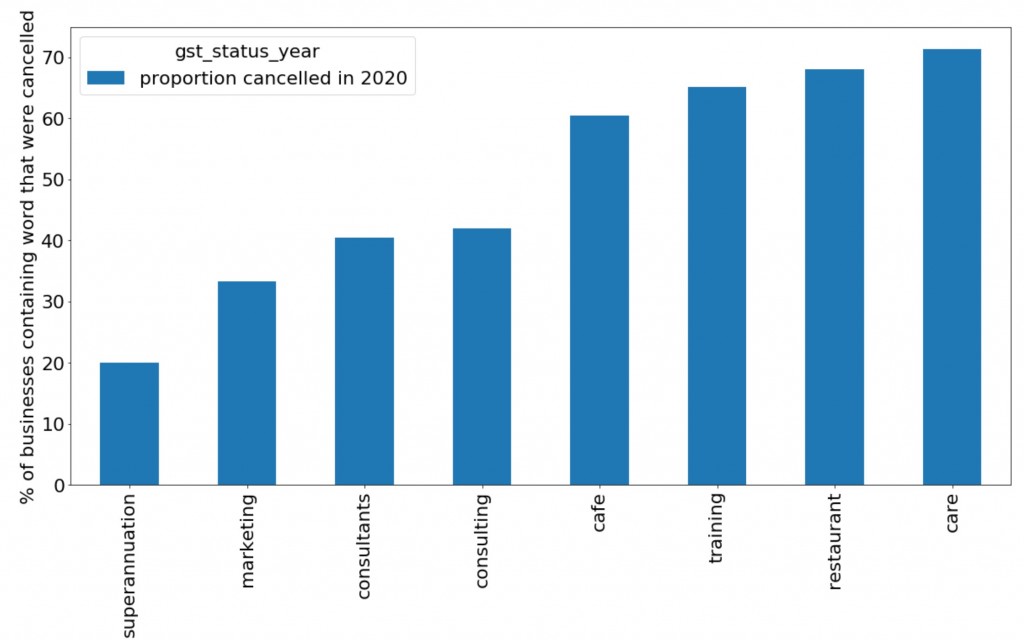
Coalition continues to trend poor

The big takeout is we’re seeing a continuation of the trend in the federal last election where the Coalition’s support base is shifting towards poorer, less skilled, the less educated people born in Australia.

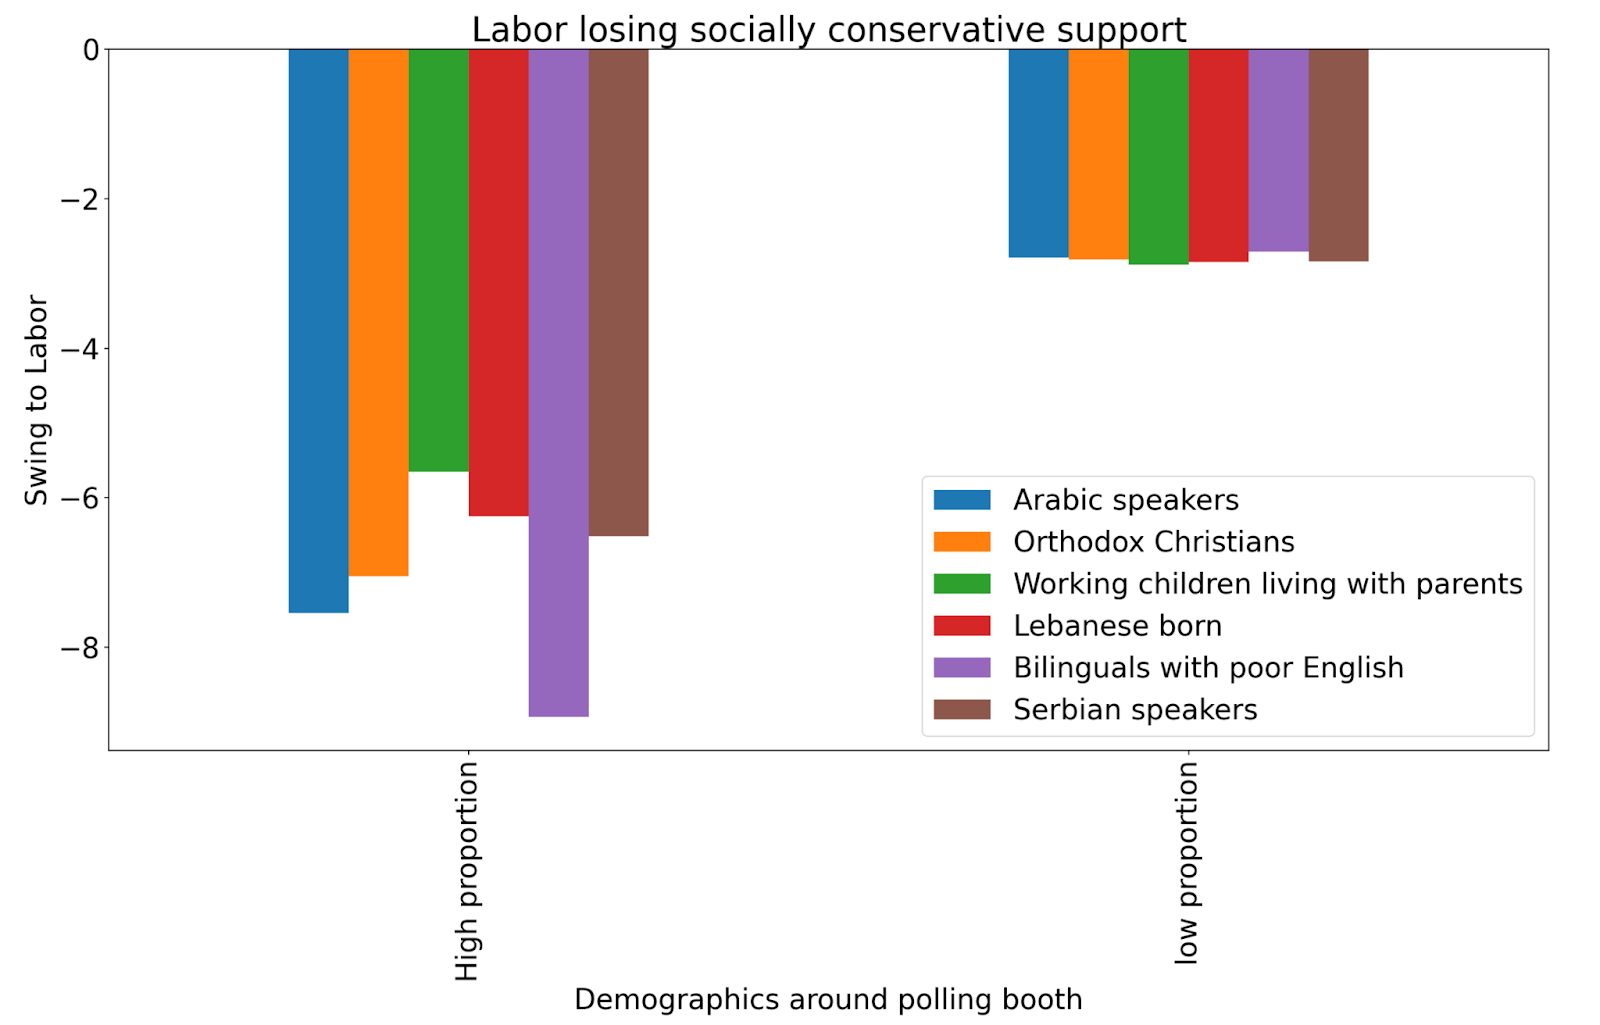
Increasingly the Coalition represent the Australian-born working class, as independents deprive them of their previous base of rich, professionals. Labor is losing social conservatives seemingly to the minor right wing parties.

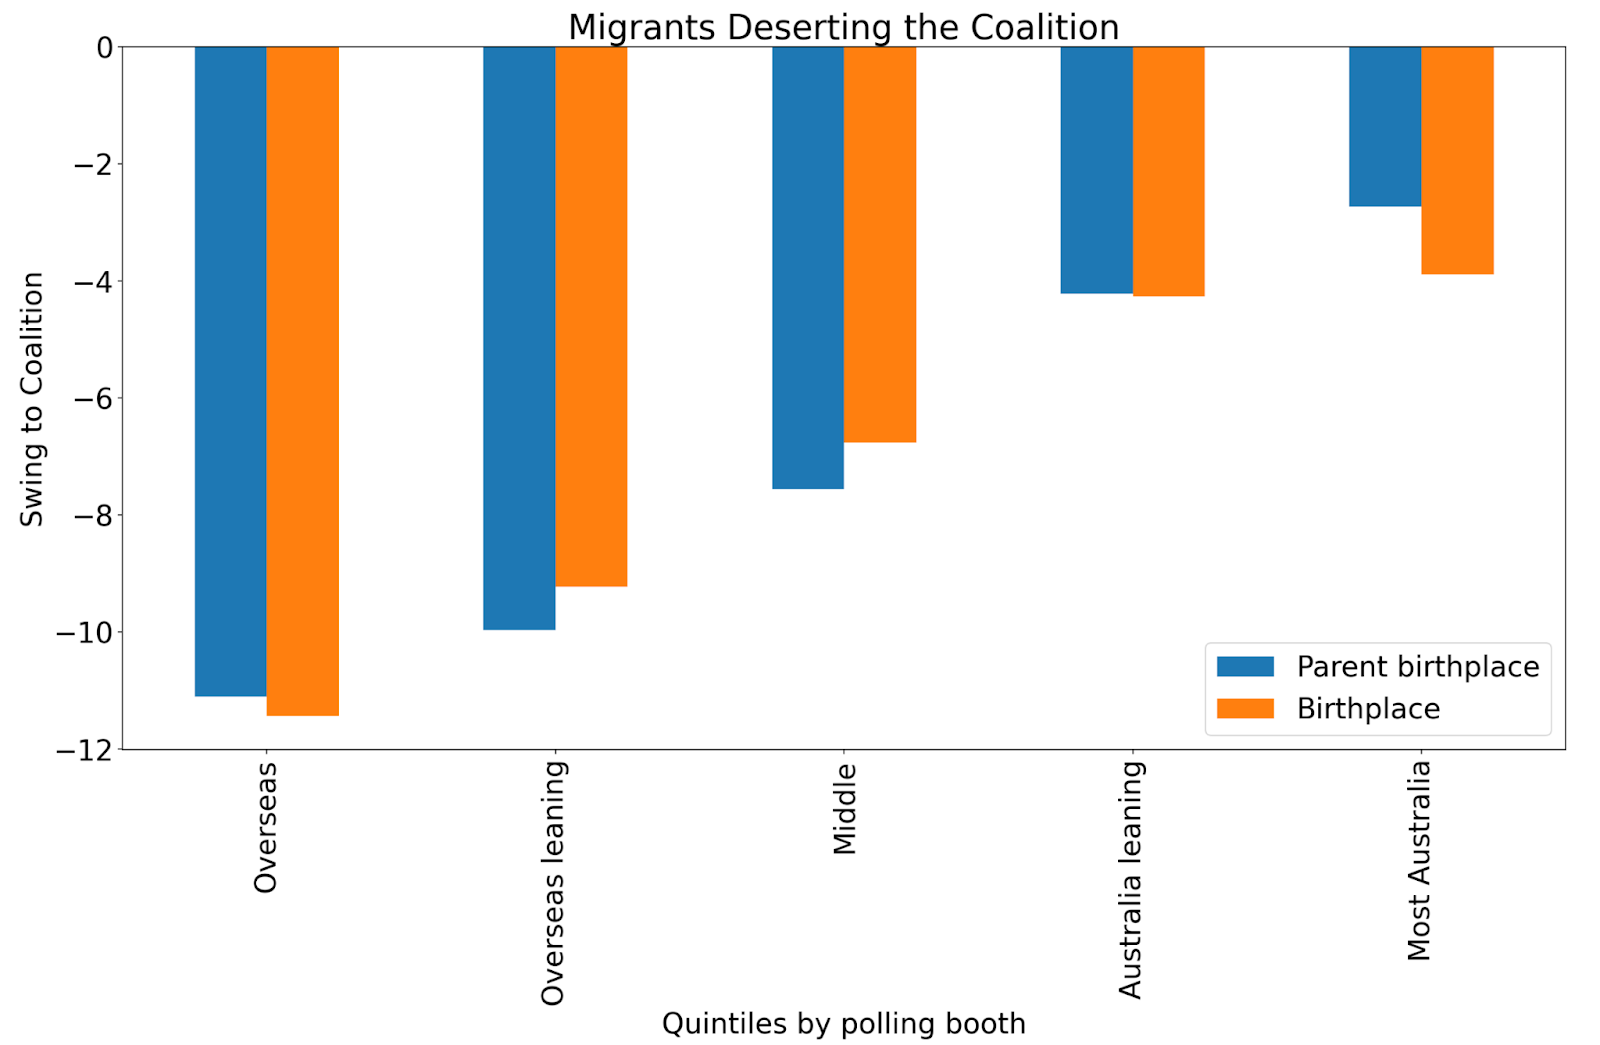
The top 20% of polling booths with the most international citizens, swung against the Coalition nearly 12%, while the most polling booths with a majority third generation ancestry only suffered a similar swing against them to what Labor endured nationally.

Rich, educated professionals swung 11-12% against The Coalition, while the country’s working poor swung only 3-4% against them.

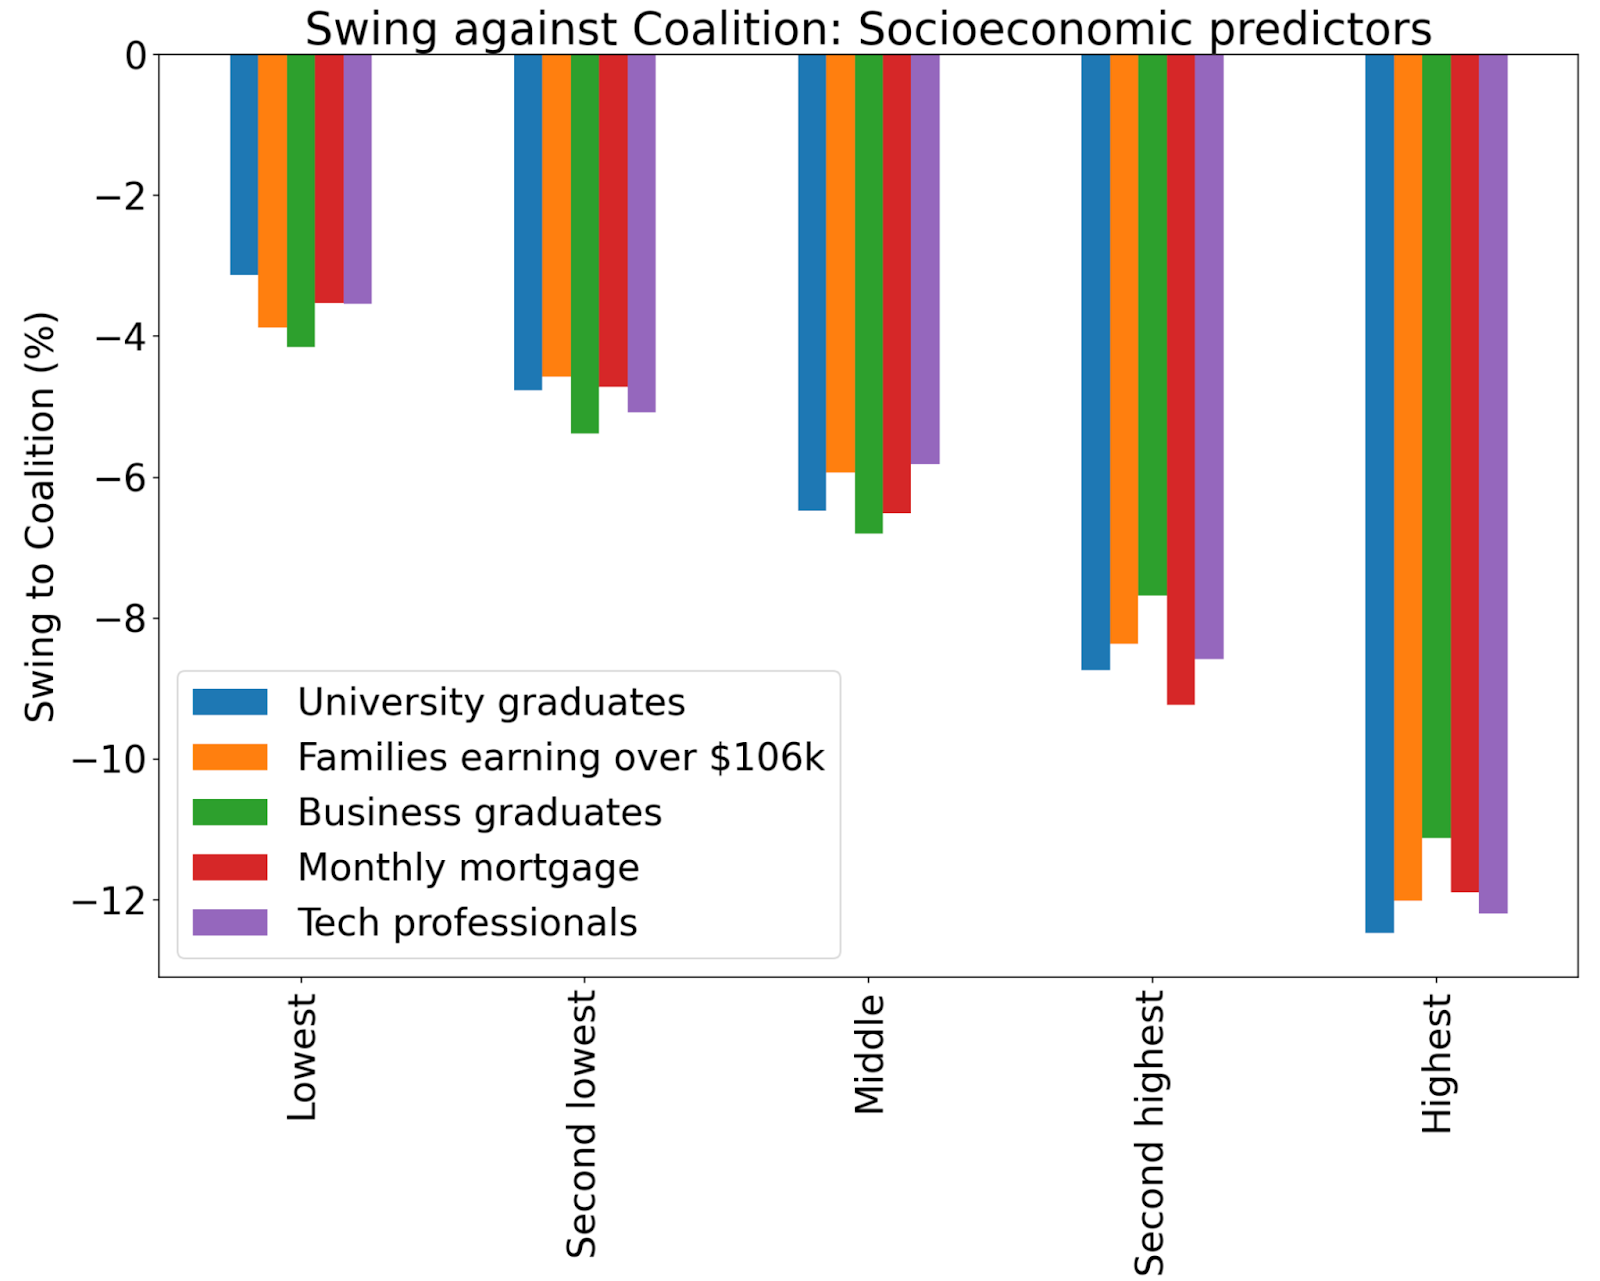
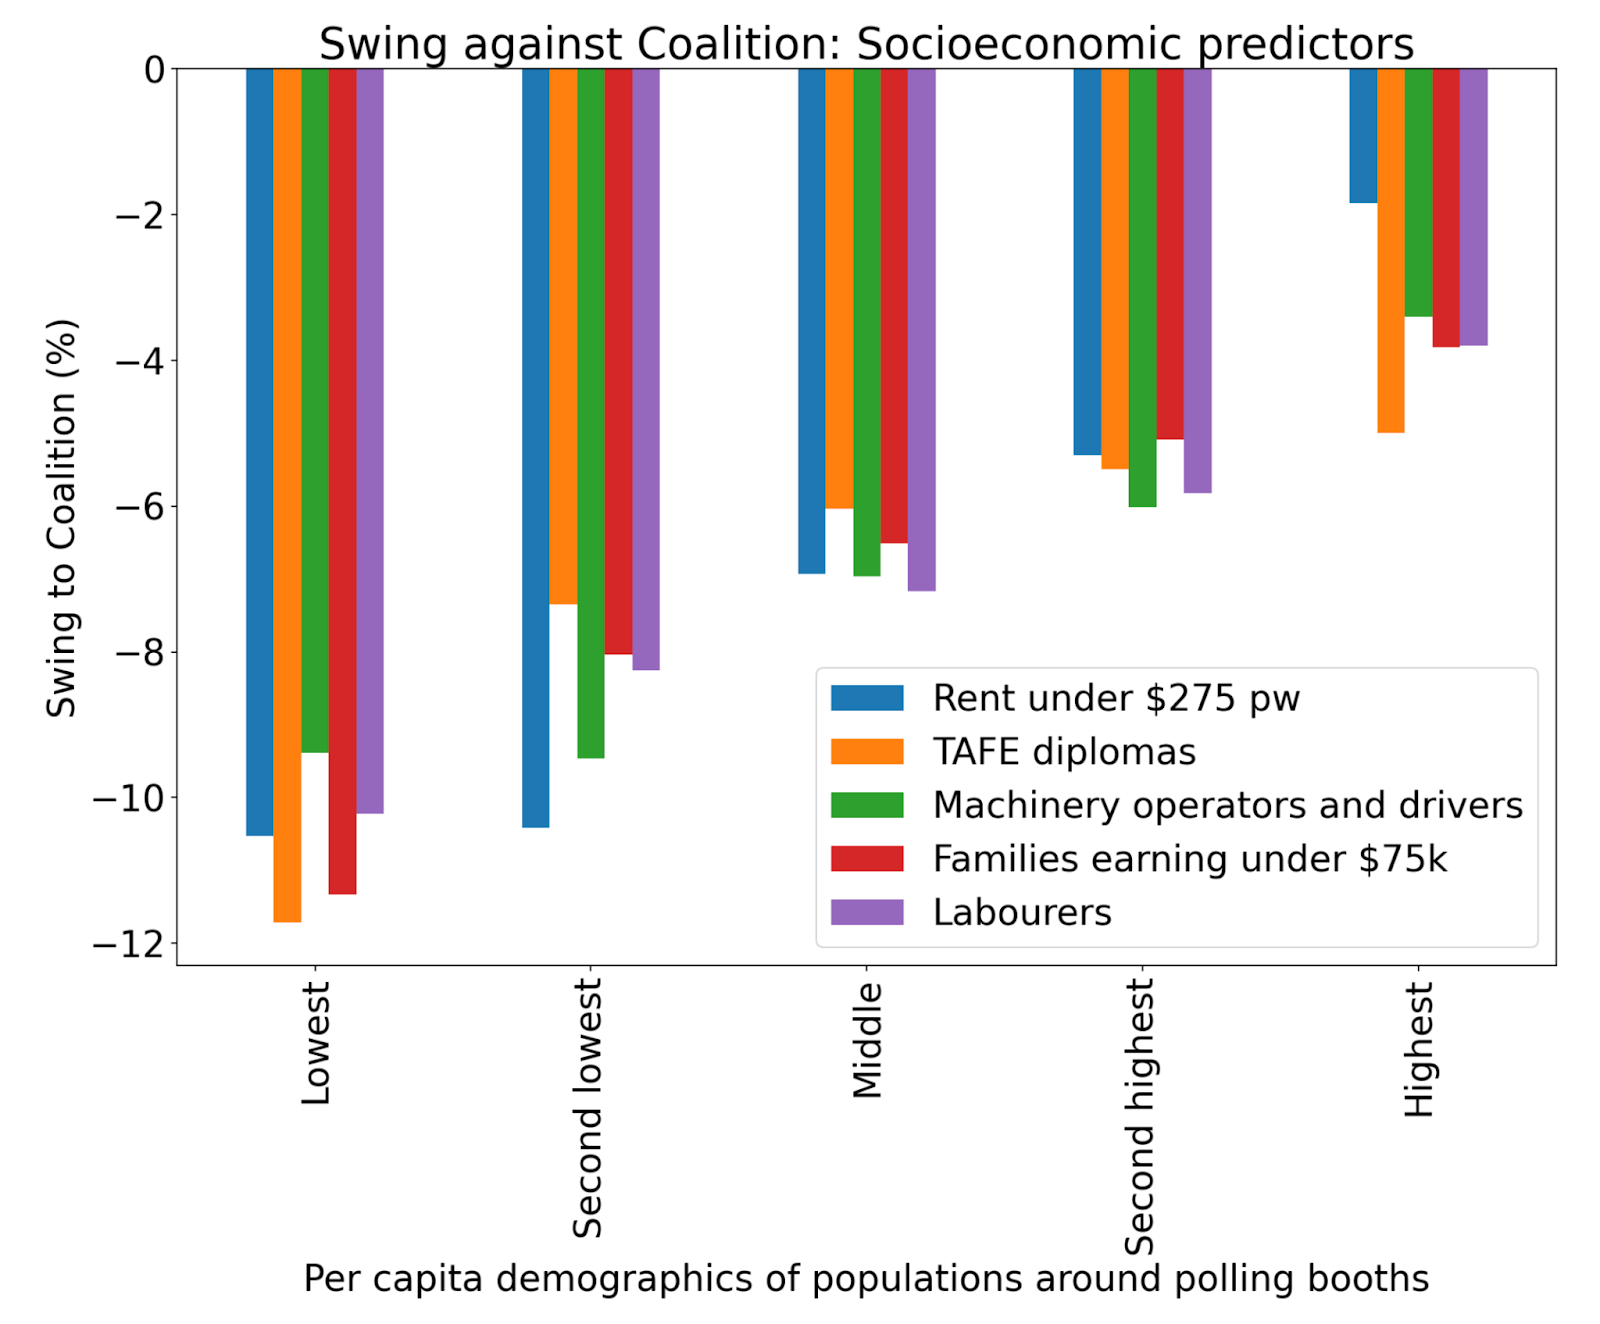
So 20% of polling booths with paying the lowest rent, earning the lowest incomes and with the least skills swung 2-4% against the government, while the fifth of Australia’s polling booths where such people are rarest saw a 10-12% collapse in LNP primary vote.

Labor wins back miners

The best predictor of a swing to Labor were miners. The 665 polling booths in the country who had over 5% of the population in mining, Labor enjoyed an average swing to them of 1.5% while the rest of the country swung against them 3.5%.

Minor right wing parties grow among Middle Easterners

Perhaps due to anti-vaccination, anti-lockdown sentiments and common social conservatism, the minor right wing parties have surged amongst people of Arabic and Serbian background. Where the polling booth is in the top 5% of these demographics, such parties more than doubled their swing.

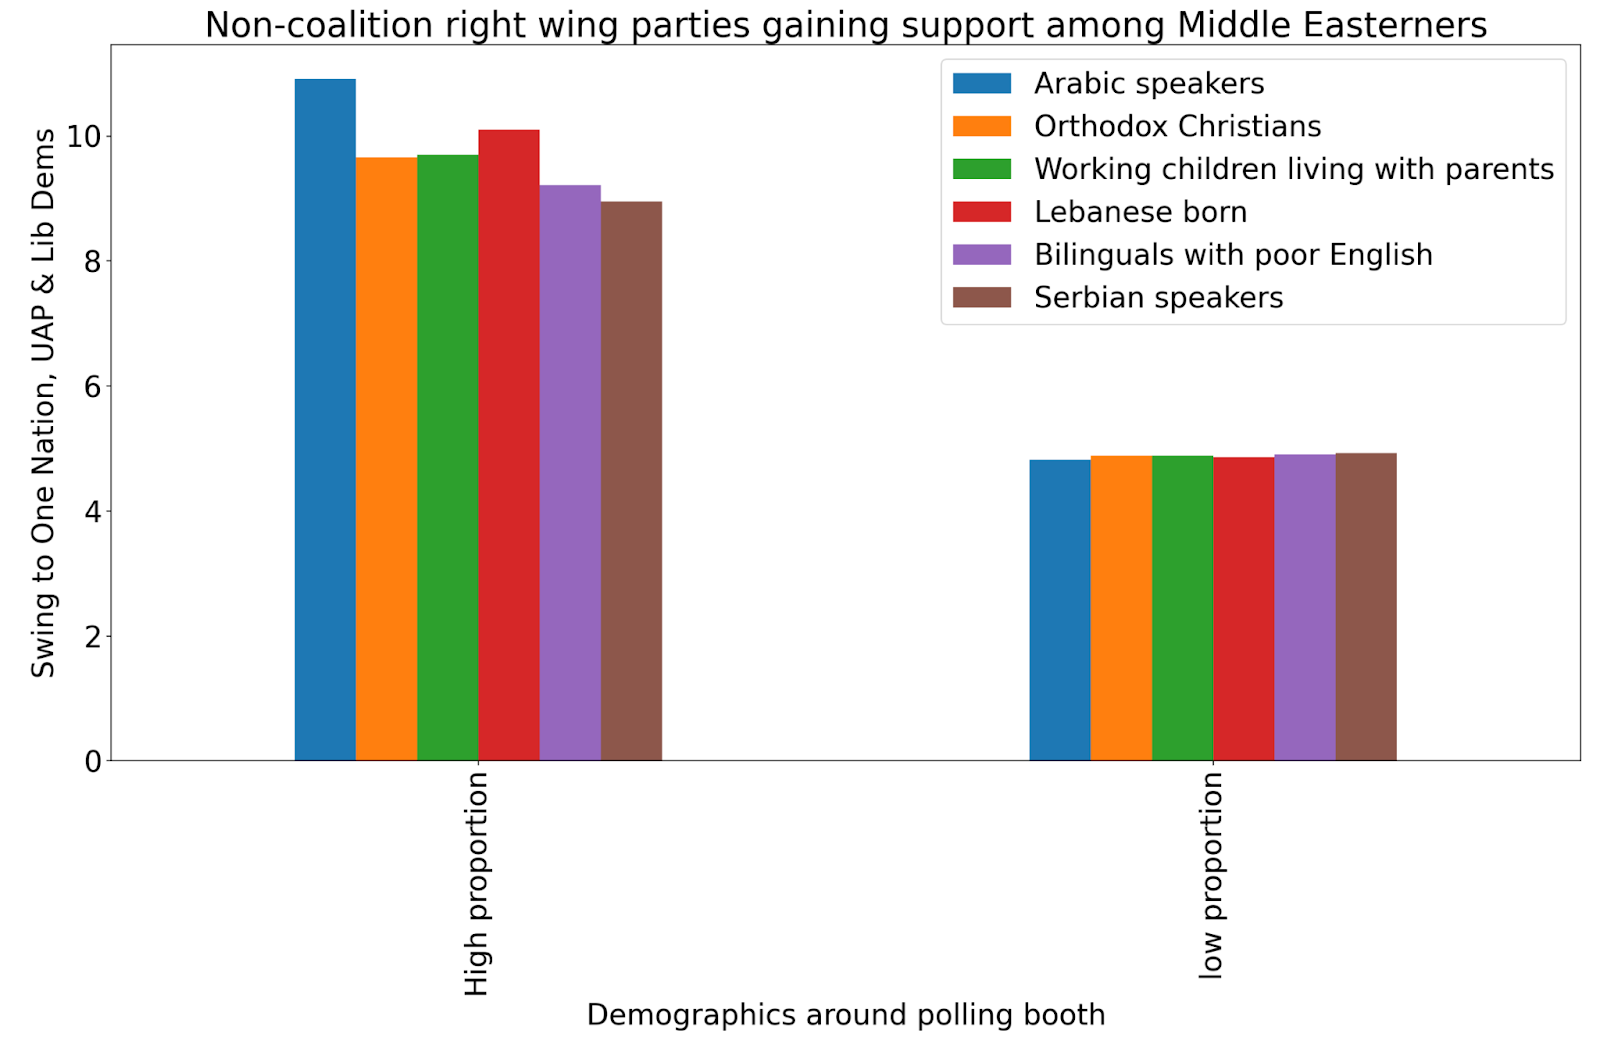
There is a matching swing against Labor in these same places.

There will be plenty more demographic analysis to come with the coming reboot of Microburbs for 2022.

COVID 19: Is Australia really different?

Sociodemographics and COVID-19

Is Australia really different from Italy and Spain?

Australia has thus far managed to keep its rate of new infections related to COVID-19 low and its total number of issued tests high relative to other Western developed nations. Watching the numbers climb amidst the rest of the world, many have growing concerns, wondering if the current rate of infections will continue to climb for the next several months in Australia or if the curve will level sooner. Government Deputy Chief Medical Officer Professor Paul Kelly issued a public statement expressing his profound faith in the Australian government moving forward, stating, “We are not Italy, Iran, or Spain…we have reason to be confident we will keep ahead of the curve.” He goes on to list government efforts alongside common sense health guidance, leaving many to wonder if this is an unfounded sense of exceptionalism or if there really is something unique about Australia compared to other countries. 

As it turns out, there are significant differences between European nations such as Spain and Italy, who have been hit particularly hard by COVID-19, and Australia. But there are also similarities. Thorough analysis of these various social, spatial, and demographic factors which predate COVID-19 could offer valuable insight into its possible spread. It is only through first understanding this framework that we are able to accurately predict what is to come and safeguard against it.

Proxemics: The Study of Personal Space

Southern Europeans consistently have lower personal space requirements than average, rivaled only by Eastern Europeans and Latin Americans. Though this varies based on the individual, on average Italians and Spaniards in social situations are comfortable standing 90cm apart from strangers and around 70cm from acquaintances. When speaking with close family and friends, Spaniards were comfortable with slightly under 60cm where Italians were comfortable with as little as 40cm. The result of these social conventions is a greatly reduced proximity well below the 1.8 meters of social distance recommended  to prevent the spread of coronavirus. 

In Italy, it is considered rude to position oneself towards the door rather than towards other individuals when in public, even in close proximity situations such as elevators. In both cultures, there was an overall tendency towards physical touch as an expression of friendliness or politeness. Reaching out to touch a friend’s arm in conversation is seen as a sign of friendliness. A kiss on both cheeks is considered to be a simple polite greeting. 

Both Spain and Italy are considered contact cultures, which embrace a high level of social engagement and reduced personal space restrictions. By contrast, Australia is a non contact culture, in which a much larger amount of personal space is considered the norm, even between close friends or family. 

When considering whether Australia will experience greater numbers of outbreaks in the coming months similar to what Italy or Spain has experienced, it is important to note that the behavioural adaptations Australians would have to make to comply with COVID-19 safety guidelines are much less drastic than people in contact cultures such as Italy or Spain. Behaviour that is considered basic manners in these places unfortunately pose a risk, as COVID-19 is primarily spread through respiratory droplets as a result of sneezing, coughing, speaking and even breathing. 

Population Density

While both Italy and Spain have larger overall populations, Australia has more major cities with over one million people residing there. The national population distribution in Australia is very stratified, with the majority of its population residing in urban areas but a large portion residing in rural areas. As COVID-19 seems to have spread more rapidly in densely populated areas, this may present a problem for the slight majority of Australia’s population.

While Australia is more heavily stratified in its population distribution than either Italy or Spain, this difference pales in comparison to the radically different land distributions of Australia compared to either Spain or Italy. The national area distribution is a measure of how the landmass of the country is used. Australia is dominated by rural land, leaving its population congregated into a smaller overall area than either Spain or Italy.  

Both Italy and Spain feature a relatively even distribution of its population in either intermediate or urban areas located throughout the countries. In contrast, Australia features an extremely dense concentration of its population in various cities in the Southeast. Almost 50% of Australia’s total population is located in Sydney, Melbourne, or Brisbane. The most populous area of Australia extends between Melbourne and Sydney along the ocean. 

While the overall population density of Australia is extremely low at only three residents per km2 due to the vast amount of rural areas, its urban population density is around 400 residents per km2

In contrast, the overall population density of Italy is reported at 206 residents per km2, with an urban population density that varied widely from 376 (Bologna) to 2,279 (Naples) residents per km2

The overall population density of Spain was somewhere in the middle at 94 residents per km2, but with an extremely high population densities in major metropolitan areas such as Barcelona and Cádiz at 15,991 residents per km2 and 9,700 per km2, respectively.

All of this seems to suggest that there is indeed a dramatic difference between the most densely populated areas of Spain and Italy as compared to Australia. If one was to journey by car from Sydney to Melbourne, the trip would take roughly 875km, requiring the driver to pass through several small to medium sized cities, with only Albury boasting over 50,000 residents. In contrast, a trip from Madrid to Barcelona would take roughly 621km, bypassing Lleida (over 430,000 residents) and Guadalajara (over 258,000 residents) along the way. The journey from the major hubs of Italy, Rome and Milan, is shortest of all at 573km. Yet along the way the driver would pass Parma, Bologna, and FLorence, all with populations of over 190,000. So while Australia’s population is concentrated in the same region, there is a reduced overall chance of spreading infection between major population hubs. 

While it is true that COVID-19 has the capacity to infiltrate rural areas, its reach is limited should individuals follow safety guidelines. Within rural areas, engagement with others is much less frequent and outside of a few household tasks such as grocery shopping, refueling gasoline, and picking up prescriptions, it is not inevitable. Those in rural areas are accustomed to a certain degree of social isolation and already have a culture of self-sufficiency that lends well to the unique safety precautions surrounding the virus.

Furthermore, unlike both Italy and Spain, Australia is an isolated continent. This makes it more difficult to circumvent regulations which attempt to safeguard against international spread of the disease. 

Aging Population

For many years now, Italy has had difficulty dealing with an aging population. Compared to Australia or Spain, Italy has a significantly higher percentage of its population over sixty-five and up to 60% of its population is over forty years of age. 

In Italy, around 96% of all elderly people continue to live in their own homes, relying largely on relatives to care for them when needed. Significant portions of the elderly population lived in homes with their adult children, which some critics argued may be putting these elders at risk. The impact of this when it comes to COVID-19 are debatable, as the country has experienced a wave of deaths in its nursing homes despite relatively low uptake for these services. It is possible that family members, who are often not medical professionals, may not take the necessary precautions to prevent the spread of illness.

In Spain, a significant proportion of the population considered caring for elderly relatives to be a moral duty, especially amongst the older and conservative members of the population. Though there was a distinct difference in that Spanish elders preferred to remain in their own homes out of a sense of pride rather than move in with the family members caring for them. Last year, over two million Spanish elders lived alone and heavily valued their autonomy. 

By contrast, Australia has a highly developed home care programme available to elders alongside traditional nursing home programs. Australian elders are more likely to request informal assistance from their spouses or formal assistance from private commercial organisations or government entities than other family members. This indicated a less strong cultural trend to require familial involvement in the care of elders than either Spain or Italy.

Cultural Components

Both Spain and Italy place a high value on family embeddedness, demonstrated in a reluctance for young people to obtain their own places of residence well after they are financially able to do so. These cultures highly value a high level of engagement with family members, with an increased value placed on the extended family than in Australia. This is indicated by the high levels of young people up to twenty-nine who continue to live with their parents, in both Italy and Spain. Though slightly over half of young people continue to live at home in Australia, there is a much less pronounced cultural trend that encourages young adults to continue to live with family.

Both Spain and Italy had distinct emphasis on their food cultures, often gathering with large groups of family, friends, or coworkers to share meals. Both countries offered generous lunch breaks in the middle of the day to encourage workers to gather for an extended meal break or take a siesta at home. 

Australians have marginally higher levels of internet usage as compared to either Spaniards or Italians, which has continued to be the case in the midst of the pandemic. This could help fortify individuals in their attempts to social distance, as habitual social media usage will lend to a decreased disruption in their social lives. 

Ultimately, no country is immune to the impacts of COVID-19, which has been demonstrated by news reporting and the lived experiences of healthcare workers the world over. There are some shared risks between Italy, Spain, and Australia regarding urban areas which feature higher levels of population density. Studies based in Africa have shown that coastal areas with large populations carry a greater importation risk than their landlocked counterparts. 

Overall, the sociodemographic data available before the COVID-19 outbreak would seem to indicate that there are significant differences in social behavioural patterns, cultural components, and urban sprawl when comparing the three countries. While only time will tell when the curve will flatten, it would seem that there are several components unique to Australia which provide significant fortifications against the spread of the virus.

(datawrapper.de)


The World Bank: Population, total – Italy, Spain, Australia
Italy SpainAustralia
Total60,431,28346,723,74924,992,369

Worldometers
ItalySpainAustralia
Net population Density (perkm2)206943

World Population Review
cities > 1M100,000-1M10,000-100,000
Italy231892
Spain288770
Australia514375

OECD (% of total pop) in 2018
ItalySpainAustralia
Total population (million)60.44246.77324.993
Young population (<15)13.314.818.8
Working age population (15-64)6465.865.5
Elderly population (>65)22.6819.2915.66

WorldometersTotal casesNew Casestotal deathsnew deathstotal recoveredactive casesserious, crittot cases/1M popdeaths/1M poptotal teststests/1M pop
Italy1394221766926491952623693230629280712513349
Spain148,22014,79248,02185,4077,0693,170316355,5507,593
Australia60525028133189872372319,78412541

**Importation risk

(https://www.sciencedirect.com/science/article/pii/S0140673620304116?casa_token=efNXKIKXYrUAAAAA:Vp2yssOjnLFhcF7WLHfjiLDkluCLCvm9UQ6PH4jgivX_Xpyv6VQhU-zG2RIWrhFqRMPPxLky9Q)

Gilbert et. al

Preparedness and vulnerability of African countries against importation of COVID-19

(https://science.sciencemag.org/content/early/2020/03/05/science.aba9757.abstract?casa_token=9UaHvgd9noMAAAAA:XAJg29gCAD7whhK_ugymKFGsOSz_0u_D3RUP69YlfEmg4hMMLUbl5ZmUOZ6OH7qvUfkmImOGfIOz_A)

Chinazzi et. al

The effect of travel restrictions on the spread of the novel coronavirus outbreak

Australia total land: 7,692,024 km2

.7% urban

53,844 km2 urban area

Spain total land: 505,990 km2

14.4% urban

72,862 km2 urban area

Italy total land: 301,338 km2

24.6% urban

74,129 km2 urban area

Italy

(https://worldpopulationreview.com/countries/italy-population/cities/)

(https://www.thelocal.it/20200309/map-which-parts-of-italy-are-affected-by-coronavirus-outbreak)

(https://github.com/pcm-dpc/COVID-19/blob/master/schede-riepilogative/regioni/dpc-covid19-ita-scheda-regioni-20200408.pdf)

Spain

(https://worldpopulationreview.com/countries/spain-population/cities/)

Australia

(https://worldpopulationreview.com/countries/australia-population/cities/)

10% of population in rural towns


Coronavirus: Early signs point towards a “frozen” economy with some personal services evaporating.

The Australian economy is showing signs of being put on hold today with actually 32% fewer GST cancellations of sole traders in March 2020 vs March 2019. There were also 9% fewer company GST cancellations. This of course despite greatly reduced economic activity.

Annotation 2020-04-07 142601

Businesses involving daily customer contact look hardest hit in 2020, with two thirds of businesses containing restaurant, training or care in their names closing in March 2020 (out of the total for March 2019 and March 2020). More abstract services like super and marketing held strong in 2020 and were far more likely to be lost last March.

Annotation 2020-04-07 143226

GST tends to update in bursts and of course many businesses may be still running just to complete existing orders. April will be interesting to see! Data from the Australian Business Register.


6 Reasons People Will Own Their Own Self-Driving Cars

Cars for kids, movie-length commutes and mega-garages. What the strange new world of self-driving cars means for you and your property.

There’ll be far more cars in future, not less!

There’s a lot of excitement at the moment about self driving cars and how they’ll transform cities to become far more efficient. Futurists say the rapidly approaching self driving cars will bring an end to car ownership. Consumers will wake up to how much more efficient it is to just “rent from the cloud”. Parking spaces, wide roads and garages will give way to more productive urban uses and everyone will get to where they want to go faster.

That would certainly be efficient for urban modelling people but I just can’t see that happening. Consider these 5 points: 

  1. Cars are about status and comfort

First, it’s not getting from A to B that you pay for. In India, you can buy a new car for $5,000. The cheapest available car in Australia is about $11,000. The fact that there isn’t even a market for cheap cars tells you something about what cars are really for.

An Indian family car costs as little as $5000.

An Indian family car costs as little as $5000.

How many 4 wheel drive ads talk about urban planning or even fuel efficiency? No, they feature jealous pedestrians, self-assured upper middle-class drivers free to roam and explore.

Most people don’t see your beautiful home but wherever you show up, if driverless taxis really take off, people will be ask if it’s yours, just like they ask if you own your home or rent.  

2. Cars will become personalised comfort pods

Cars are already our mobile homes. They have your spare pair of glasses, a soccer ball for the kids, some emergency suncream. But imagine what they’ll be like when they’re also your super-comfortable home cinemas, bedrooms and offices. Soon you’ll be able to catch up on your favourite TV shows without any danger of carsickness as the road is still there behind you. In fact, a really smooth drive would be a selling point of self-driving cars. You could enjoy a movie on the way to work but half a movie is only half as satisfying. This is not far off. You can already buy windscreen heads up displays today:

Screen Shot 2017-01-18 at 9.45.00 am

If you’re feeling diligent, your work day could start the moment you sit down at the (now comfortably absent) wheel. Or if you’re not a morning person, it’ll be your mobile sleep pod.

It’ll be your zone, customised to you. It wouldn’t be as cozy spending 90 minutes in a taxi. The longer you spend in a car, the more status and comfort will become important.

You want a home, not a hotel room. You already have the garage space. Why convert it to a rumpus room that never gets used when it could house your new prize possession?

  1. Car ownership won’t be limited to drivers anymore.

Currently only drivers have cars. The young, the old, the disabled and the fearful are excluded from this and by extension they’re not full participants in the suburban dream. For millions of people, driverless cars brings the exciting prospect of owning a car for the first time.

  1. Advertisers will make you want one

There’s far more money to be made in selling everyone their own car. Capitalism has been very good at getting people to own things they don’t rationally need. Does your street really need more than one lawn mower? You buy single-use objects like books when you could borrow them for free from the local library.

Are you going to feel safe at high speeds in some taxi with hundreds of thousands of kilometres on it? Whether or not private cars will actually be safer, advertisers will tell you so. Your child is much safer on a public bus but that doesn’t stop parents picking their kids up from school and exposing them to the biggest killer of young people: car accidents. There’s a fundamental belief now shared by all classes that privately owned cocoons are safe and the public sphere is dangerous. Perhaps it’s not that likely you’ll sit on a used drug needle in a driverless taxi, but you can bet the media will let you know when it happens.  

Two visions of the future, one with decidedly more consumer appeal.

Two visions of the future, one with decidedly more consumer appeal.

  1. Advertisers will make you want several!

Sometimes you need an 8 seater to transport the family, the dog and the daughter’s best friend. Sometimes your son wants to go out hooning. Sometimes you want to weave through dense traffic to work and that width really slows you down.

Yet most homes only have one car per driver – a compromise vehicle that’s rarely the right vehicle for the job. Why? Driving ability! You don’t want your teenage son driving a sports car. You don’t own a bus license. You don’t think motorcycles are safe.

With self driving cars, your options are limited only by your imagination. Sports cars will be marketed at 12 year old boys. Beauty spa cars will be marketed at mums. Older people will be be enticed to own classic cars that were hard to drive. Some cars will be all about sending your kid to dance class and keeping them safe and stimulated on the way. Touring will be much more pleasant in the future, so there’ll be holiday cars too, addressing a larger market than currently buy RV’s and caravans.

Advertisers sell personal choice, freedom, status and comfort. Their job will actually be much easier in the era of driverless cars. There’s nothing authentic or special about being carted around in a headless public taxi.

With so many more uses, and no need for a responsible driver, it all adds up to more time on the road. We already know prolific drivers own more cars.

  1. There’ll be much more space to garage all those extra cars

The rise of the comfort pod vehicle will make outer suburbs and satellite cities far more attractive. The further you go out from a city centre, the more supply there is. In this future, all existing residential house owners will lose and farm owners within 90 minutes of the city could massive windfalls.

And this is even before you take human drivers off the road, when self driving cars have to stay slow and follow road rules to avoid accidents. Once the humans are gone, cars will sail through intersections in all directions and accelerate as fast as the passengers can bear.

Just as the car lead to much lower density housing further from the city centre, the speedy self-driving car will give people even more land to share. Big land calls for big houses. And what major lifestyle change determine which room grows in size? The self driving car.  

So what does this mean for property owners?

So self driving cars won’t be creating space-efficient suburbs. There’ll be more cars and   even more parking spots: Instead of dropping your daughter off at piano lessons, you’ll be able to send her off in the self driving car. That car will stay parked there, dutifully waiting for your daughter like you have your own private driver.

This is good news for property owners too. If the future did go rental, governments would start eyeing all that unused land on suburban streets – roads that no longer need parking or buffer zones. You and your neighbours will want it turned into public land to protect your area’s privacy, tranquillity and character. But developers will be very keen to get in on your sought-after street, so expect some serious urban consolidation too. This would be a nightmare for property owners, as every part of every city would be inundated with new supply.
So far from creating a communal hub of common property with a public fleet of cars, self-driving cars will make people more suburban than ever – with bigger houses further from the city and more cars. Buckle up!

How Far Will You Have To Go? The Price of Proximity

Recently I had an exciting opportunity to sit down with acclaimed property investment coach Jane Slack-Smith. You may know Jane from the Your Property Success courses or her frequent media appearances. We got to talking about how Microburbs data can assist property investors, and she raised the very early step of finding areas that are in your target price range.

Melb_zoom

“It may seem fine to look at monthly reported information regarding median house prices in your local capital city”, said Jane, “but cities are made up of hundreds of suburbs. In some instances you may find that the older more established suburbs with bigger blocks have less properties and less residents compared to the many new development suburbs opening up on the outskirts of town. Just because the median for Brisbane seems cheap, does that mean you can get a blue chip property less than $600,000? The answer is no.” There is a ‘rule of thumb’ which can get you started, but it’s no substitute for hard data.

“Within 10km of the CBD I would add a margin of +20%, and within 20km, 10% of the median. This is because often by the sheer number of suburbs outside the 10km range compared to the number inside can greatly affect the median for those area. That is that there are many cheaper suburbs below the median in the outskirts that will bring the city median down, hence why I add that buffer. Being able to find out though what the real medians are within an area allows you to assess quickly if you can afford within 10km or even 20km of the CBD or if in fact you are looking at the outskirts.”

You can imagine how excited Jane was to learn that we can make that data available. Based on reported sales for 2016, we have profiled all of Australia’s state capitals to help you find an investment property that fits your budget.

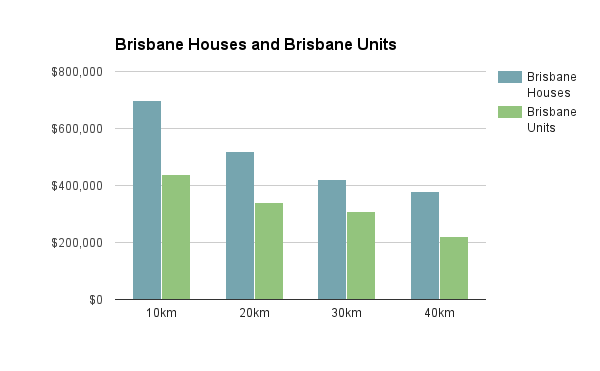
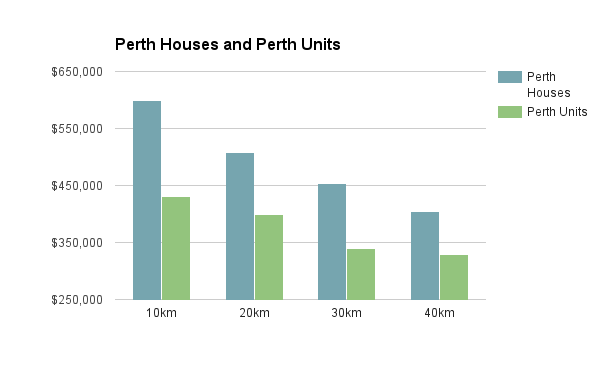
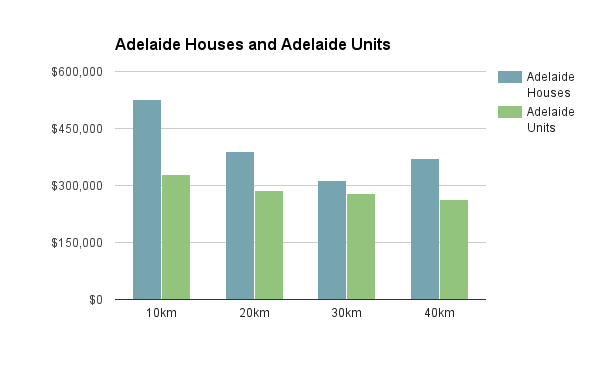
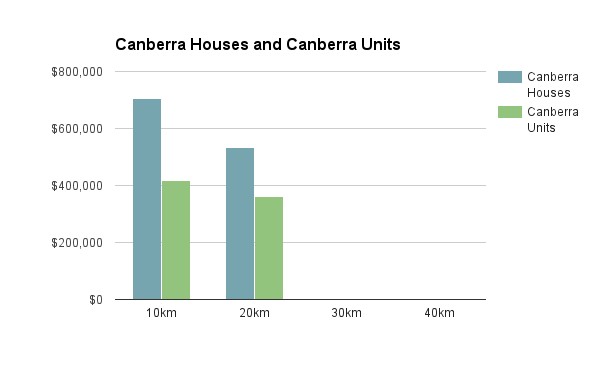
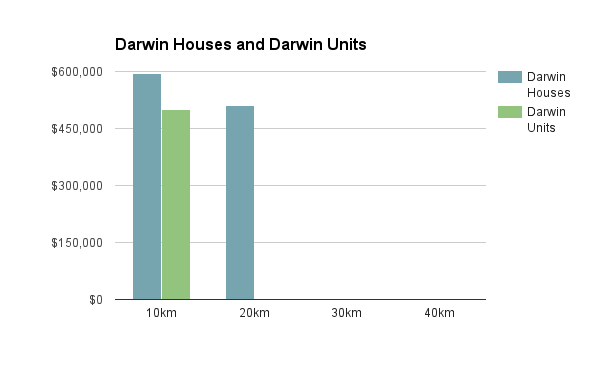
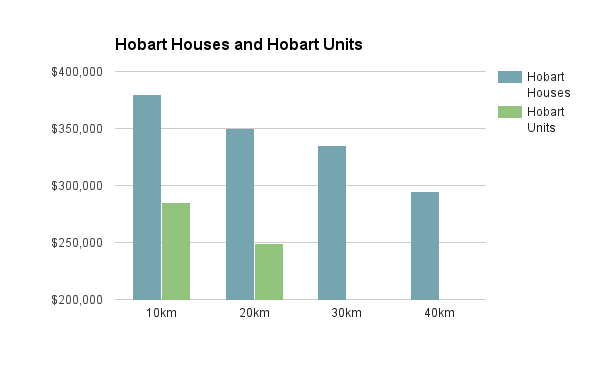
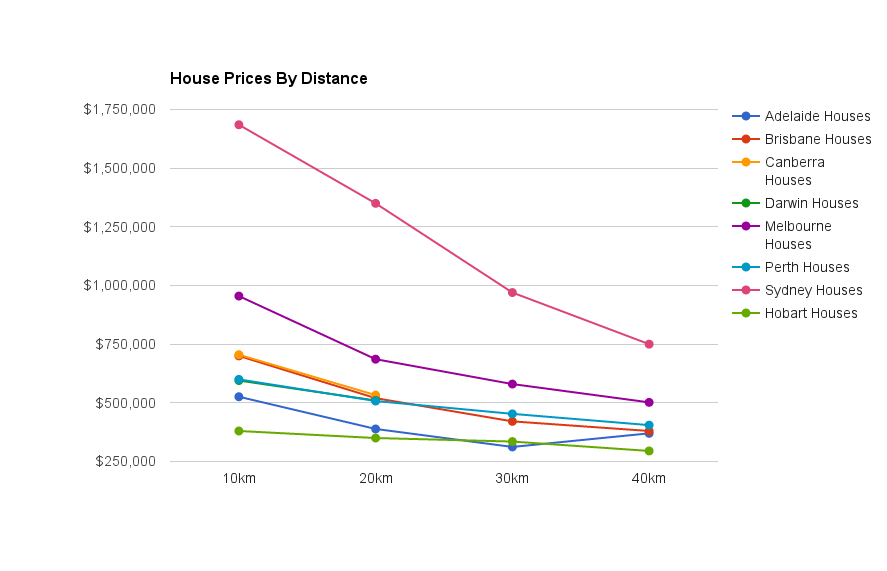
First we’ll look at house prices for all state capitals, grouped by whether they are 0-10km from the centre of the city, 10km-20km and so on. For instance, we can see that if we had a $600,000 budget, we could look at central Perth or Adelaide, 10-20km from the centre of Brisbane or Canberra, 20-30km from the heart of Melbourne and more than 40km from the middle of Sydney.

If we look at units rather than houses, the prices are lower overall and the curves are more closely matched. It’s interesting to see that units in the centre of Melbourne have a lower average price in the 10-20km band. This may be because units a little further out are larger. To normalise for the fact that properties tend to be bigger as we get further from the city, we’ve also done a chart of square metre pricing by distance to the city centre. This is a measure more commonly used with commercial real estate, but is basically just the purchase price divided by the size of the floor space of the property to give a price per square metre. This shows us that properties in the centre of Sydney are actually much more expensive than anywhere else in the country, in terms of the space you get for your money. We also see that distance effects on property prices are fairly uniform elsewhere, once property size is accounted for.

Area Prices

Sydney


Sydney

Sydney
Houses Units per Sq Metre
10 km $1,685,000 $815,000 $6,000
20 km $1,350,000 $680,000 $2,175
30 km $970,000 $590,000 $1,528
40 km $750,000 $487,000 $1,286

Sydney’s peak of $6000 per square metre for residential space within 10km of the city centre is off the charts by national standards. The popularity of downtown Sydney is not just about proximity, but also the harbour and there are plenty of harbour views and even ocean vistas to be had in the 10km inner circle. Sydney’s sprawl extends even beyond the 40 km line, with residential areas 55+km from the city centre.

Melbourne


Melbourne
Houses Units per Sq Metre
10 km $955,000 $499,500 $2,160
20 km $686,000 $534,500 $1,313
30 km $580,000 $470,000 $1,062
40 km $502,000 $380,000 $768

Brisbane


Brisbane
Houses Units per Sq Metre
10 km $700,000 $440,000 $1,192
20 km $520,000 $340,000 $828
30 km $421,000 $310,000 $606
40 km $380,000 $220,000 $490

Perth


Perth

Perth
Houses Units per Sq Metre
10 km $600,000 $430,000 $1,099
20 km $507,750 $399,000 $861
30 km $453,000 $339,000 $697
40 km $405,000 $329,000 $513

Adelaide


Adelaide
Houses Units per Sq Metre
10 km $526,000 $330,000 $998
20 km $388,750 $286,000 $576
30 km $312,000 $280,000 $469
40 km $370,000 $262,000 $437

Canberra


Canberra
Houses Units per Sq Metre
10 km $705,000 $419,000 $939
20 km $532,900 $362,400 $825
30 km
40 km

Darwin


Darwin
Houses Units per Sq Metre
10 km $595,000 $500,000 $698
20 km $510,000 $694
30 km
40 km

Hobart


Hobart
Houses Units per Sq Metre
10 km $380,000 $285,500 $573
20 km $350,000 $248,850 $392
30 km $335,000 $250
40 km $295,000 $210

You can explore any city in Australia with Microburbs. To get started, search in the box below:

For press enquiries about this article, please call Microburbs Founder Luke Metcalfe on 0414 183 210.

One Migrant Group’s Neighbourhoods Grew 48% … And It’s Not the Chinese

Our analysis reveals how canny new migrants are benefiting from Australia’s property boom, and why Westerners are falling behind.

It’s a sensitive subject, but not all ethnic groups are profiting equally in Australia’s property boom. In fact, nothing could be further from the truth. Our findings tell a different story to the stereotype of the Anglo Australian baby-boomer couple as the key beneficiary of the property growth.

I’ve often asked people “what do you think is the strongest demographic factor that influences growth”? Chinese, and other migrants, often laugh and say something like “Do you really want me to say? It’s not politically correct”.

At Microburbs, we use data science, machine learning and big data analytics to explain Australia’s real estate market. As such we’re very interested in growth factors, and leading growth indicators. The clear growth indicator nobody is talking about is ethnic and migrant communities. Areas where some migrant groups concentrate have greatly outperformed the average.

Our research has found that Microburbs with the highest proportions of indigenous and Northern European people did not grow much in the past 5 years, while southern European and Asian dominated areas mostly did incredibly well.

How did we find this? We started with Microburbs – small areas of a few blocks, with around 400 people. We then picked the 500 Microburbs that were the most concentrated for each ancestry using data from the 2011 census from the Australian Bureau of Statistics. Next we looked at the price of property in those top 500 Microburbs for that ethnicity and compared the 2012 median property price to the 2016 median property price to get a growth rate.

So, is it the Chinese who are most prevalent in the high growth areas? Well, there is certainly a correlation between Chinese areas and high growth, but the ethnic group which is associated with the best performing areas is actually the Lebanese. 

Birthplace of parents Median house price 2012 Median house price 2016 Growth Top suburbs (% growth)
Lebanese $540,000 $800,500 48% South Granville (74%), Greenacre (55%), Condell Park (36%)
Chinese $785,000 $1,150,000 46% Berala (33%), Eastwood (NSW) (62%), Hurstville (75%)
Korean $814,000 $1,170,000 44% Dundas Valley (84%), Eastwood (NSW) (62%), Oatlands (NSW) (41%)
Greek $768,400 $1,100,000 43% Sans Souci (57%), Earlwood (58%), Kingsgrove (57%)
Vietnamese $430,000 $595,000 38% Cabramatta (48%), Cabramatta West (60%), Canley Vale (78%)
Spanish $445,000 $604,250 36% Wetherill Park (80%), Hinchinbrook (NSW) (46%), Bossley Park(53%)
Croatian $480,000 $630,000 31% Forde (21%), Munster (9%), Oran Park (25%)
Filipino $460,000 $595,000 29% Burnside Heights (28%), Plumpton (NSW) (51%), Ropes Crossing(43%)
Maltese $460,000 $588,145 28% Taylors Hill (17%), Catherine Field (28%), Oran Park (25%)
Serbian $445,000 $561,000 26% Bonnyrigg Heights (46%), Dandenong North (34%), Mount Pritchard (77%)
Russian $691,500 $850,000 23% McKinnon (64%), Bentleigh East (61%), Carnegie (63%)
Polish $435,000 $529,975 22% Ardeer (32%), Bell Park (21%), Brighton East (53%)
Indian $515,000 $620,000 20% Wentworthville (54%), Parklea (43%), Girraween (NSW) (57%)
Dutch $390,000 $465,000 19% Mount Evelyn (33%), Monbulk (20%), Officer (-4%)
New Zealander $420,000 $495,000 18% Upper Coomera (19%), Maudsland (19%), Pacific Pines (16%)
Welsh $451,500 $525,000 16% Secret Harbour (7%), Apollo Bay (Vic.) (16%), Coal Point (14%)
Hungarian $487,500 $560,000 15% Selby (-1%), Hindmarsh Island (-3%), Bell Post Hill (1%)
Maori $355,000 $405,000 14% Upper Coomera (19%), Marsden (23%), Meadowbrook (10%)
Sinhalese $487,000 $548,750 13% Lynbrook (28%), Roxburgh Park (16%), Lyndhurst (Vic.) (32%)
Macedonian $489,000 $550,000 12% Port Kembla (38%), Banksia (64%), Lalor (33%)
English $420,000 $470,000 12% Stirling (SA) (25%), Bridgetown (22%), Mindarie (WA) (24%)
Italian $600,000 $665,000 11% Ingham (-17%), Greenvale (Vic.) (4%), Haberfield (71%)
South African $650,000 $720,000 11% Moggill (9%), St Ives Chase (72%), St Ives (NSW) (63%)
Australian $292,000 $318,500 9% South Grafton (-4%), Gilgandra (24%), Aberdeen (NSW) (-26%)
Turkish $440,000 $462,000 5% Auburn (NSW) (72%), Meadow Heights (12%), Roxburgh Park(16%)
Scottish $515,000 $518,000 1% Aireys Inlet (18%), Sorrento (Vic.) (13%), Lorne (Vic.) (-12%)
German $309,000 $310,000 0% Gatton (19%), Murray Bridge (15%), Boonah (Qld) (0%)
French $660,000 $660,000 0% Killarney Heights (44%), Apollo Bay (Vic.) (16%), South Coogee(62%)
Australian Aboriginal $303,750 $299,000 -2% Murgon (-10%), Goolwa South (11%), Kuranda (1%)
Irish $617,000 $586,250 -5% Apollo Bay (Vic.) (16%), Bardon (4%), Ashgrove (23%)

Now you might be thinking that this is clear evidence that some ethnic groups are sharper investors than others. It’s not that simple though. We have a connection, sure, but there’s more to the story.

Firstly, areas where people report their ethnicity as “Australian” or from the British Isles tend to settle in rural and regional areas, which don’t show strong growth. Take the Scottish community in Lorne, Victoria, which has seen median property prices fall 12% in the last 4 years in their town.

This is similar for people of Northern European ancestry. They seem to prefer living in places where there is more space, and as  such more land. Australia’s most German areas include Murray Bridge in regional SA and Boonah in regional QLD, for instance.

Asian migrants, on the other hand, tend to move into big cities and high density areas – close to shops and work. These areas tend to be short on land already, and increased popularity with an ethnic community increases demand, which drives price growth. They also tend to drive NAPLAN scores up.

Heading out of the cities, the link between indigenous communities and decreased median prices is explained by these communities typically being in very remote regional areas. Our country towns have certainly not shared equally in the recent property price growth.

It’s also worth noting that we’re comparing where these communities were living in 2011 with the increased cost of buying property. There’s every chance that these properties are being rented by the occupants and the beneficial owners could be from a totally different demographic. 

We can clearly see that different ethnic communities come to Australia seeking different lifestyles, which leads them to settle in different areas.

A quick and clever way to demonstrate these cultural differences is with a few Google Image searches. By translating ‘Australia’ into several languages and running a google image search, you’ll see very different Australias for different languages.

Searching for the word “Australia” in Arabic and Chinese gives you Australia’s most exclusive real estate, the Sydney Harbour foreshore:

image02

While searching for “Australia” in French and German gives you dirt cheap real estate, The Outback:

image00

So if Northern Europeans aspire to nature and wide open spaces, they can have it, and cheaply. But they shouldn’t be surprised not to do see any capital growth, because the very thing that attracts them to it – the expansive land – means also that there’s endless supply thereof.

So we can see the Western love of nature improving their housing affordability but also depriving them of capital growth.  

On the flip side, successive waves of immigrants who aspire to our big cities will continue to benefit from the fact that demand outweighs supply in those areas, assuming they can get a foot on the property ladder.

To identify migrant communities and explore the ethnic make up of your potential investment areas, search for the suburb or address below and head to the Ethnicity section of any Microburbs report.

For press enquiries about this article, please call Microburbs Founder Luke Metcalfe on 0414 183 210.

Sydney’s Babycino Belt: Family Friendly Suburbs That Haven’t Lost Their Cool

So you have kids, or are planning some. They need great schools and safe places to play,  but you want to keep the vitality of places you’ve lived in your younger, freer days. You’re not ready to move to a typical suburban place just yet. You may now feel the urge to share with your childless friends how little sleep you’re getting and still feel solidarity even though their sleeplessness was very much by choice.

Is it possible to have it all? Can kids and parents all be happy in the one place? Of course you can, but how much is it going to cost you? I’ve mined our Microburbs data to find out, and present my top picks:

5. Rushcutters Bay

More than just a place to jog past hundreds of yachts, Rushcutters Bay is our eastside representative of Sydney’s fringe.

This exclusive suburb is 5 minutes walk from uber hip Kings Cross combined with access to Sydney’s east. It’s a halfway mark between gentrifying hipness on the west to the elite lifestyle of Darling Point to its east. A midpoint between star performer private schools SCEGGS and Ascham (both top 1%).

Just be careful with the young ones as mediocre performance in day cares might make a nanny a good option.

Family Score around Rushcutters Bay is shown here,  rising from middling (yellow) to high (green) in the east:

4. Bondi Beach

We’ve all been to Bondi and admired the brash culture of the East, where money meets backpackers, but have you considered raising a family there?

With a family score of 8 out of 10, your kids won’t want for surf and public gym equipment. Admittedly, Bondi Beach Public School doesn’t perform that great for its area with top 38% NAPLAN. But if you can afford to buy in Bondi, you may have the spare change to afford an excellent private school like Reddam House. For a mere $565,000 you could see your three children all the way through primary and high school. What price is too high for top 1% NAPLAN?

3. Neutral Bay

Our top performer north of the Bridge is Neutral Bay. For many it’s a drive-through suburb dominated by a single pub, but recent developments of small bars and funky cafes along Grosvenor St make Neutral Bay deserving of a second look.

It will not surprise many that Neutral Bay and St Mary’s public schools perform well. After all it’s an affluent area with parents who value their time so much, they only just live outside the city. But these schools perform really well – Netural Bay, St Mary’s Catholic and North Sydney boys and girls are all top 1%ers. Mind the day care costs though – they typically charge around $160 per day.

Also showing a strong performance are neighbouring Cammeray and Cremorne, which share their ample parks, playgrounds and sporting grounds.

2. Forest Lodge

Tucked away behind its more famous neighbour, Glebe, Forest Lodge is another suburb that resides at the top of our hip score list but still provides a very good lifestyle for families. With Forest Lodge in the top 10% for NAPLAN and St Brendans Catholic School at top 5%. Nearby Sydney Secondary college also performs well (top 8%).

4358974940_64bcb15229_b 
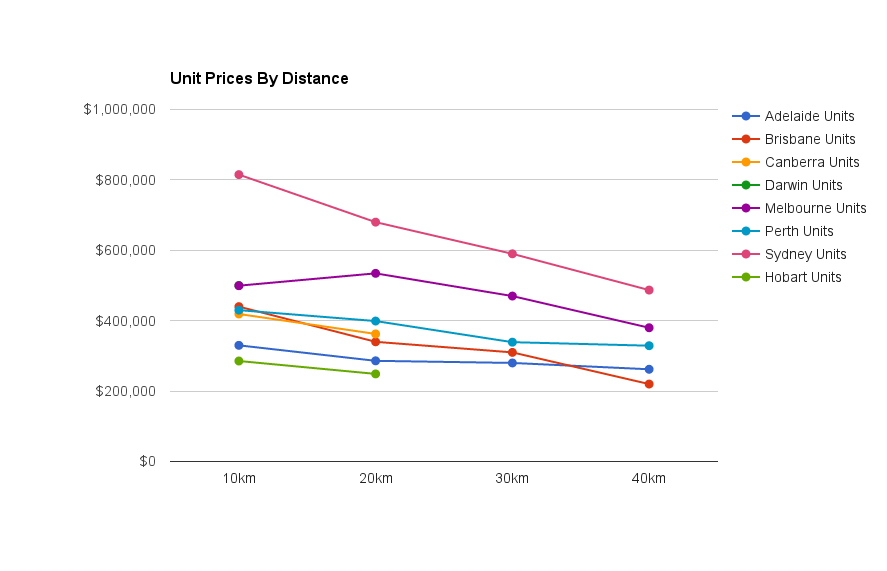
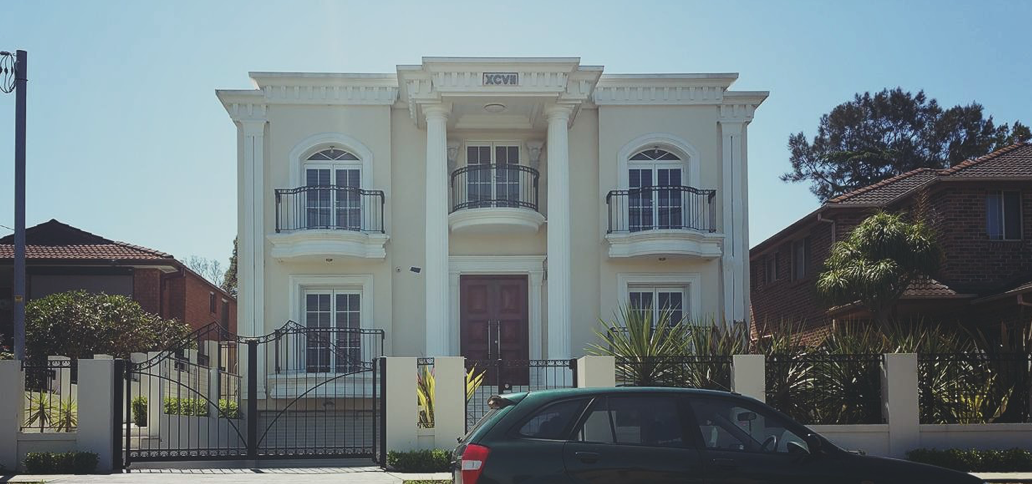
Unlike the Erskineville, Newtown, Camperdown troika, Forest Lodge stands alone at serving both families and hip people with neighbouring Glebe to its east serving hipsters and more spacious Annandale to its west providing for family.
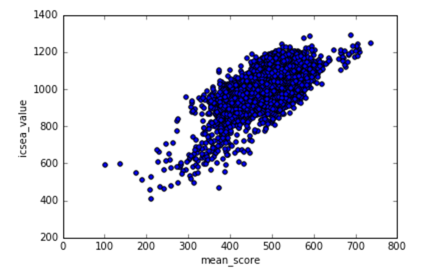
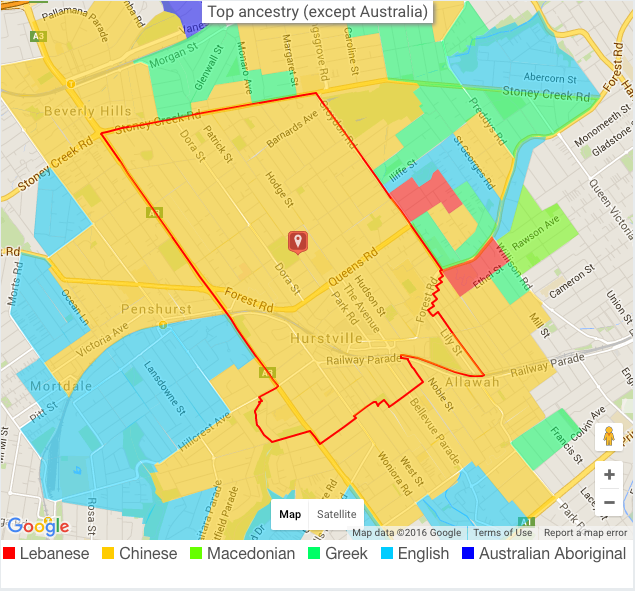
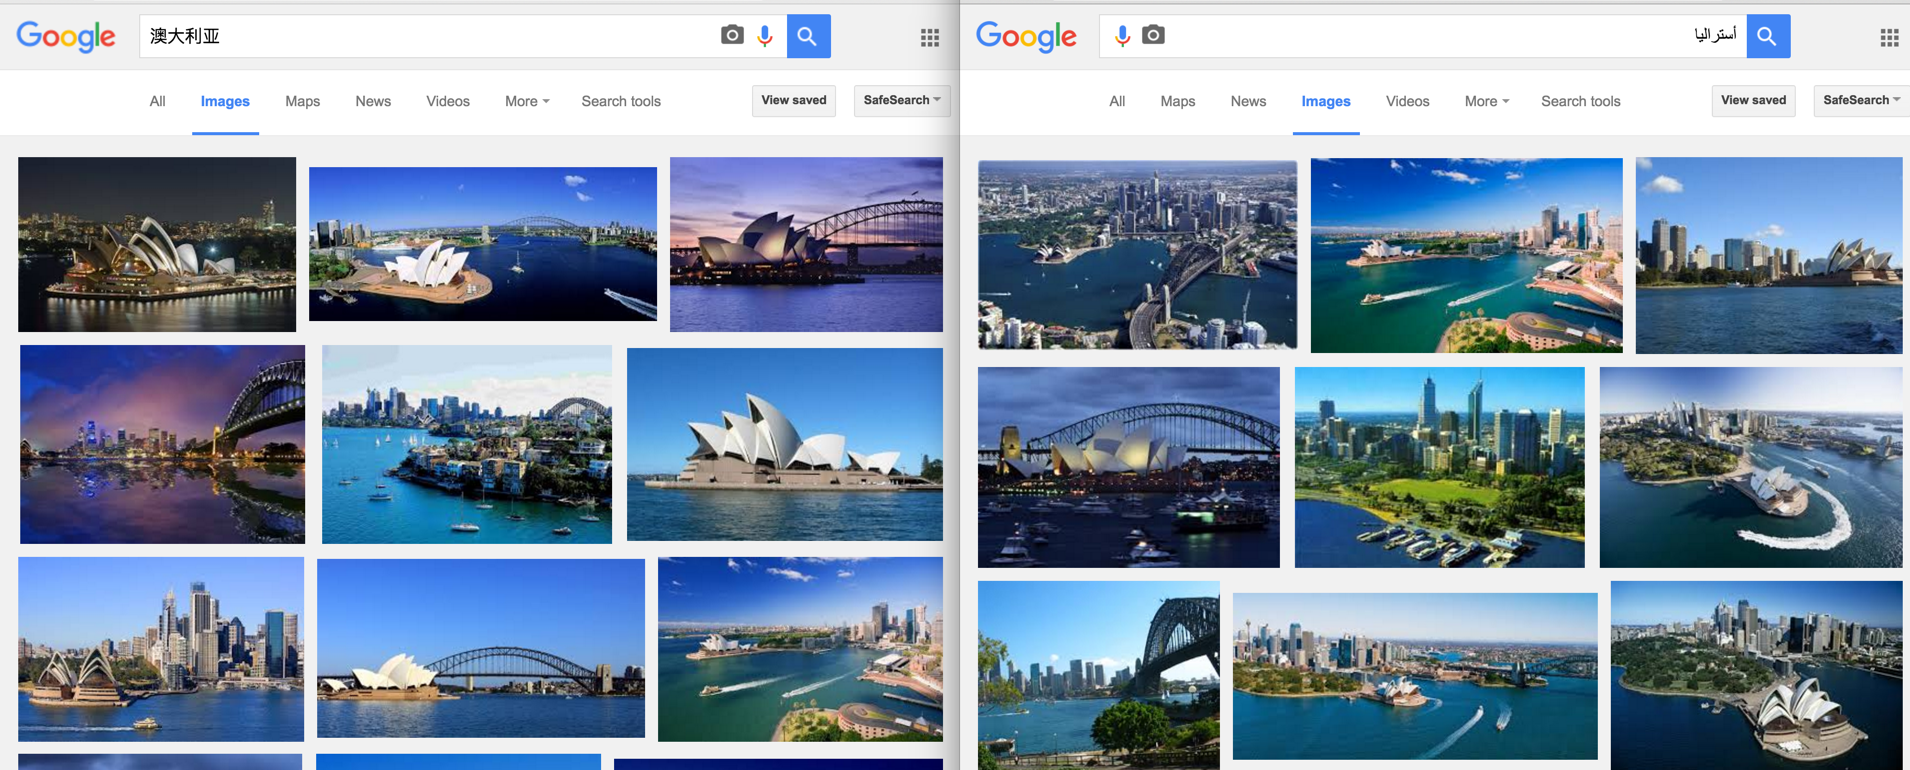
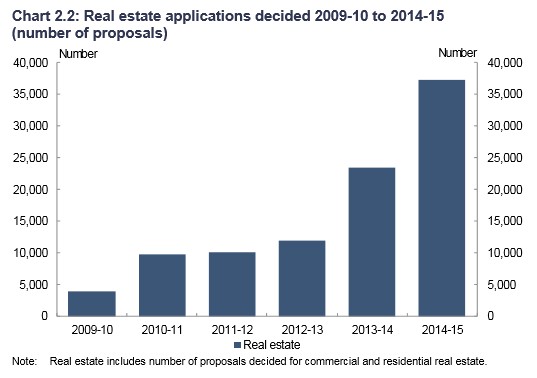
1. Erskineville / Newtown / Camperdown

These neighbouring suburbs are all hip and serve families so well, we had to put them together for first place. Sydney’s Erskineville has a lively community with ample creative professionals, bountiful cafes and 20 art schools within 2km. Its dining options are also vast, courtesy of neighbouring Newtown. You could eat at a new Thai place every day for a fortnight.

hipsterparents1

Family score typically doesn’t accompany hip score but this sought after suburb is definitely an exception. Erskineville public school gets top 8% in NAPLAN.

It’s not so great in terms of tranquillity though, having 9 times Sydney’s average population density. For a bit of space, look the sprawling Sydney Park at its southern tip, which makes for an excellent respite to densely packed inner city living.

Our Official Top 20

Rank Suburb Family Score Hip Score Median House Price 2016
1 Erskineville 8.2 8.9 $1,315,000
2 Camperdown 8.4 8.7 $1,352,500
3 Bondi 8.6 8.5 $2,555,000
4 Newtown 8.1 8.9 $1,301,000
5 Forest Lodge 8.4 8.6 $1,680,000
6 Centennial Park 8.9 8.1 $2,650,000
7 Wollstonecraft 9.3 7.7 $3,537,500
8 Neutral Bay 9.5 7.5 $1,750,000
9 Queenscliff 9.2 7.7 $1,610,000
10 Cammeray 9.7 7.1 $4,050,500
11 Stanmore 8.7 8.1 $1,570,500
12 Waverton 9.4 7.5 $4,750,000
13 Paddington 8.6 8.2 $1,700,000
14 Fairlight 9.6 7.2 $1,583,500
15 Bondi Beach 8 8.8 $2,990,000
16 Newtown 7.8 9 $1,301,000
17 Cremorne 9.5 7.3 $1,947,000
18 Rushcutters Bay 7.8 9 $2,562,500
19 Bronte 9.1 7.7 $3,010,000
20 North Bondi 8.9 7.9 $2,550,000

Microburbs Report – Family Score

The Family Score panel of each microburbs report includes the performance of all classes of local schools, along with catchment boundaries and travel times. For a limited time, we’re offering a comprehensive family scores report for all Australian suburbs, which we can send you instantly:

Oh no...This form doesn't exist. Head back to the manage forms page and select a different form.

For press enquiries about this article, please call Microburbs Founder Luke Metcalfe on 0414 183 210.

Punching Above Their Weight: Sydney’s Struggle Street Schools That Perform Really Well

The federal government’s MySchool website is a treasure trove of data about schools and how they perform. Like it or not, it’s a statistical fact that rich suburbs’ schools perform better and that educated parents have kids who, in turn, do well at school. You can see a pretty strong correlation here with Socio-Educational Advantage (ICSEA) and mean NAPLAN score:

Socio-economic advantage is not the end of the story though. There’s still plenty of variation. Some schools perform way better with the children they’re given than others. This article seeks to recognise the fantastic work of those educators and institutions.

But before we get too excited, remember that NAPLAN is just about maths and literacy. It doesn’t tell you which students are going to build the next global restaurant chain or write the next Hollywood blockbuster.  There is much more to a child’s development, and some schools have educational philosophies that aren’t conducive to strong NAPLAN results. It’s possible that some of these schools are just “teach the test” hothouses.

Regardless, maths and literacy are the foundations upon which many other skills can be learnt. We may celebrate the tech founder who drops out of university to create a billion dollar business, but you can be pretty sure that person didn’t drop out because they couldn’t read or write.

 1. Canley Vale High School

What makes Canley Vale really a standout is that on our ranking it actually beat out all the other selective schools too. That means that they did more with the local children than selective schools can do with a hand-picked intake. Something is definitely going right in this very poor south western Sydney suburb. The average income per week is just $495, yet this school ranks in the top 25% for NAPLAN across the country.

 2. Cabramatta High School

Nearby to Canley Vale is Cabramatta High School, our second top performer. The majority of the students are from a Vietnamese or Chinese background. 68% of students from here come from economic backgrounds in the bottom quarter of the state, yet the school still produce results around the state average.

3. Fairvale High School

Our next best performer is also from Sydney’s South West. If you look carefully at the faces, you may see a familiar pattern:

The high cultural priority that Asian families place on education may be showing up here. This may be why high schools in immigrant areas beat primary schools. It’s a tough call for immigrant primary school children to outperform their peers while also learning a new language.

4. Chifley College Shalvey Campus

Despite 26% being from an indigenous background, 25% being from a non-English speaking background and 83% of their students in the bottom quarter of the state socio-educationally, this public high school manages to achieve NAPLAN results in line with national averages.

5. Sydney Distance Education High School

We tried to make this article about what schools that outperform, though it seems having Asian kids extends the pressure to perform into the home. Also Asian parents may be particularly keen on conventional measures of academic achievement over most extra-curricular pursuits that we don’t cover here.

So we also looked for the school that performs the best with an English speaking population and this one came top. Although the name sounds like it might be for isolated, remote families, it actually supports on children with special needs, like the pregnant or disabled. Their NAPLAN scores show that they are certainly coming through for their students.

Microburbs Report – Family Score

The Family Score panel of each microburbs report includes the performance of all classes of local schools, along with catchment boundaries and travel times. We also have available a full report for Australian suburbs, which we can send you instantly:

Oh no...This form doesn't exist. Head back to the manage forms page and select a different form.

 
For press enquiries about this article, please call Microburbs Founder Luke Metcalfe on 0414 183 210.

Analysis Reveals which Australian Chinese Stereotypes are Actually True

With ever increasing amounts of Chinese expats calling Australia home, we look to our extensive suburb and property data for insight. Stereotypes abound, but can you sort the factual from the phoney? 

We’ve looked at Australia’s 55,000 microburbs and done the numbers. Microburbs are smaller areas that make up a suburb, each with about 400 people. By looking at microburbs, we can get a much sharper picture of an area than by looking at overall suburbs.

There are 1,879 microburbs with 20% of their residents reporting Chinese ancestry in the census, which we’ll call Chinese microburbs.

State # Chinese Microburbs
New South Wales 1069
Victoria 571
Queensland 139
Western Australia 79
South Australia 13
Australian Capital Territory 5
Tasmania 3


Let’s have a look at how Chinese microburbs compare to the rest of Australia and explore a few commonly held perceptions.

1460704159

Stereotype 1: Chinese people love to live in high density, convenient places.

According to our modelling, the Chinese microburbs are certainly more convenient. The average Microburbs Convenience Score is 8% higher than the national average. We can break this down further to look at what makes these areas convenient:

  • An amazing 99.6% of Chinese microburbs are within 30km of a major work centre. For the rest of the country it’s just 61%.
  • 29% of people in Chinese areas use public transport compared to 10% for the rest of the country. Cars per household is only 1.4 vs 1.8 elsewhere.
  • The average distance to shops in these Chinese areas is 297m, compared to 3km for the rest of us.

With convenience often comes high density housing. In Chinese microburbs, 35% of people live in units. That’s 4 times the national average.

High scoring Chinese microburbs for Convenience Score can be found in Ultimo in Sydney, West Melbourne, and Adelaide CBD

Chinese people love to live in high density, convenient places?  TRUE

Stereotype 2: Chinese people don’t integrate

On the one hand, there is only one suburb in Australia which is majority ethnic Chinese, being Hurstville, in Sydney. There are 106 microburbs in Australia which are majority chinese, but nearly a third of those are in Hurstville. If we look at the amenities available in Chinese microburbs, they are 26 times more likely to contain a Chinese restaurant and 130 times more likely to contain a Chinese Medicine business.

It can’t be denied that there are ‘Chinatowns’ around Australia. We covered Sydney’s Hurstville, but similarly, Melbourne has Glen Waverley and Brisbane has Sunnybank Hills.

On the other hand, Chinese people, like their restaurants, are spread all around Australia, living in around 57% of Australia’s microburbs. With a dispersion like that, it wouldn’t be reasonable to say Chinese in Australia were particularly clustered.

Chinese people don’t integrate? FALSE

Dot map of every Chinese person in Australia by Monash City Science

Stereotype 3: Chinese love to become professionals, like doctors

Are the residents of Chinese areas all professionals? Certainly more of them than average. 29% of working adults in these areas are professionals, which is 50% higher than the rest of the country. Chinese Microburbs have twice as many university graduates and nearly 3 times as many residents with postgraduate degrees. On top of that, the amount of university students is more than 3 times the expected level.

Residents of Chinese microburbs are certainly highly educated. At the pinnacle, are the Chinese microburbs in university areas like Crawley in Perth, St Lucia in Brisbane and Acton in the ACT.


Chinese love to become professionals: TRUE


Stereotype 4: The Chinese make lots of money

We can’t say what kind of wealth Chinese immigrants might be bringing to Australia, but we can see the way wages differ in Chinese microburbs.

There are higher numbers of people reporting no income, but that is in line with there being triple the number of students, who often have no income.

Aside from non-earners, incomes are very similar to any other area. The levels of high income earners, particularly, are right in line with national averages.

This is remarkable, however, because of the high number of professionals and postgraduates in these areas. Typically these experts would command higher wages. This may be a the effect that Australia’s race discrimination commissioner, Dr Tim Soutphommasane, has described  as the ‘Bamboo  Ceiling‘ – an analogy to the ‘glass ceiling’ experienced in business by women.

There are suburbs with high earning Chinese microburbs, like Balwyn in Melbourne, Bruce in Canberra and Castle Cove in Sydney, but all up, Chinese microburbs report average wages, despite all of those masters degrees.

Chinese people are high earners: FALSE

Microburbs in Hurstville shaded by Ancestry

Stereotype 5: The Chinese are good students

Oh yes. The average NAPLAN rank for schools in Chinese areas is top 23%. They certainly do their local schools proud.

This is particularly prominent in Sydney’s North Shore suburbs of Chatswood, Lindfield and St Leonards, Brisbane’s St Lucia and Melbourne’s Glen Waverley.

The Chinese are good students? TRUE


The Rise of the Australian Chinese

The Foreign Investment Review Board (FIRB) has just released their annual report, revealing continued explosive growth in Chinese investment in Australian real estate. The federal government moving against illegal foreign investment on one front and China increasingly choking the flow of money out of the country on the other has done nothing to slow the tide.
FIRB_approvalsImage source: FIRB

In 2013-4, Chinese investors overtook Americans as our biggest source of foreign investment, and in 2015, the numbers only continued to rise. All investors in Australian residential markets need to know what this means for them, so we’ve looked at Australia’s 55,000 microburbs and done the numbers.
We are offering a free analysis of the Chinese in Australia, and what it means for your investment portfolio here. Informed buyers should know where Australia’s Chinese microburbs are and how they compare, in detail, to the rest of Australia.

Get the Full Report

Download now:

Oh no...This form doesn't exist. Head back to the manage forms page and select a different form.

realAs Review

realAs predicts property prices to beat underquoting and unrealistic guide prices from agents.  Backed by a sophisticated algorithm developed at RMIT, realAs predictions are within 5% of the sale price on average, including auctions as well as private sales. Almost 9 out of 10 of realAs predictions are just 10% off the final home selling price. Armed with realAs.com or the realAs iPhone app, buyers can get right price to pay for a home.

realAs.com

realAs was conceived by David Morrell, a veteran buyers’ agent and advocate responsible for changes in law in his crusade against under-quoters.  He has long known that it’s buyers who decide how much to pay and that knowing what a sale price will be levels the playing field – and puts an end to agents’ manipulations.

In addition to the quantitative algorithm, realAs also offers estimates and commentary from agents and buyers on properties. Users input their own estimates, and the algorithm will weight them in determining a price, depending on how accurate the user has been in the past. By comparing the accuracy of past quotes against realAs predictions and selling prices, buyers would also be able to form a view about the market knowledge of a particular agent and whether they underquote.

We think realAs represents another invaluable, and free, tool for buyers and investors. If you like Microburbs for the facts the property ad left out, you’ll love realAs.com for the right price to pay.