Microburbs today released its cuisine diversity index, ranking Australian suburbs on the uniqueness of their dining options.
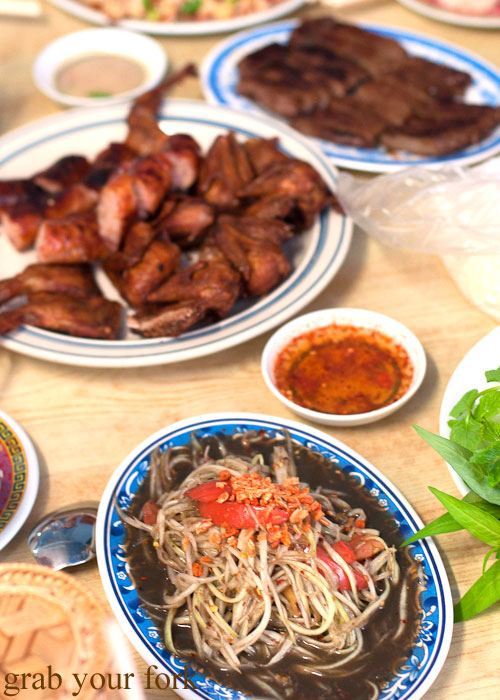
Lao Village, Fairfield – Image credit Grab Your Fork
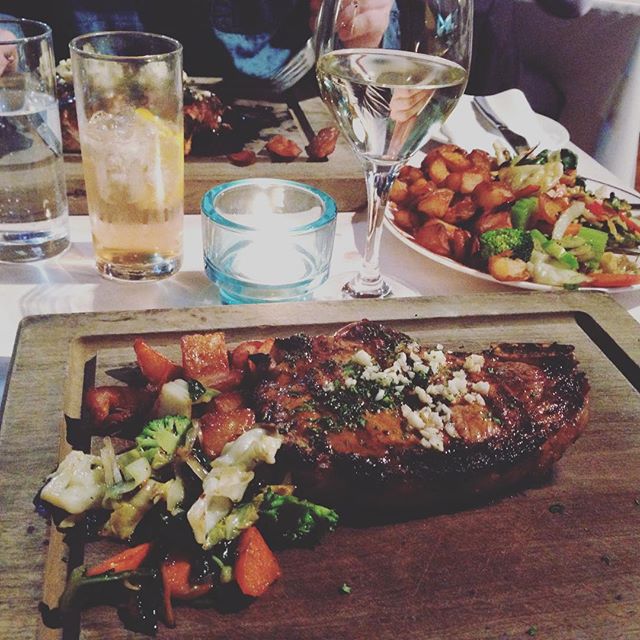
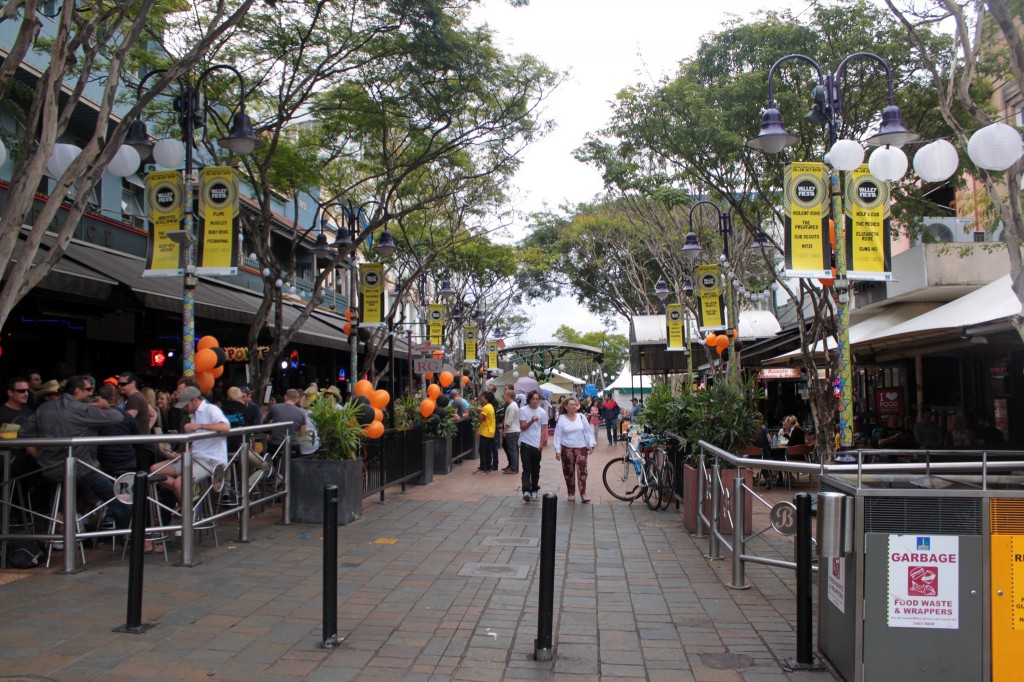
What would cultured urban life be without a new cuisine to try every night? Most major suburbs have a pizza place, a Chinese and a Thai but how many have a Belgian, a Persian and a Moroccan?
The cuisine diversity index is part of our ongoing research into the Microburbs Hip Score – our measure of the elusive cool factor of some Australian suburbs. You probably feel it when you’re in a hip area, but we’re scientifically and statistically quantifying it. You could say we’re putting the genius back into je ne sais quoi.
If we were to consider the sheer number of restaurant types in a suburb, we would be strongly biased to suburbs with simply a lot of restaurants. Instead, we look at the ratio of interesting options to commonly available cuisines. The higher the proportion of unique cuisines, the higher the ranking.
Some of these suburbs may not look all that hip, but cuisine diversity makes an area a destination for dining, which brings vitality into an area in the evenings. Good local restaurants are a big part of urban lifestyle, making diverse dining suburbs ones to watch.
Sydney
| Rank | Sydney | Go for… |
| 1 | Fairfield | Laotian |
| 2 | Strathfield | Burmese |
| 3 | Marrickville | Peruvian |
| 4 | Glebe | Polish |
| 5 | Enmore | African |
| 6 | Bankstown | Egyptian |
| 7 | Kingsford | Russian |
| 8 | Brighton-Le-Sands | Greek |
| 9 | Newtown | Balkan |
| 10 | Balmain | Turkish |
Melbourne
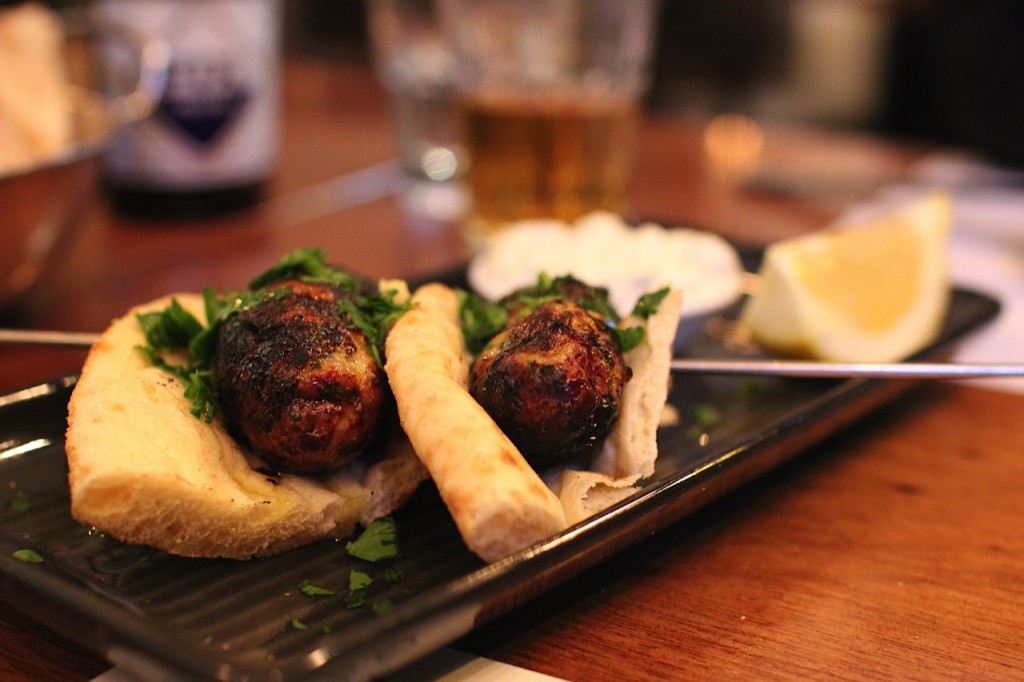 Alpha Ouzeri, Brunswick – image credit Chasing A Plate
| Rank | Melbourne | Go for… |
| 1 | Brunswick | Greek |
| 2 | Footscray | Ethiopian |
| 3 | Coburg | Pakistani |
| 4 | Brunswick East | Persian |
| 5 | Fitzroy | Cuban |
| 6 | Prahran | Nepalese |
| 7 | Sunshine | Afghani |
| 8 | Collingwood | Laotian |
| 9 | Doncaster | Greek |
| 10 | Elsternwick | Russian |
Brisbane
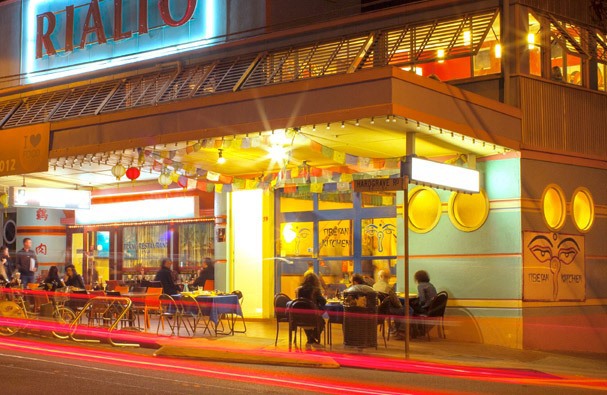
Tibetan Kitchen, West End – image credit Weekend Notes
| Rank | Brisbane | Go for… |
| 1 | West End | Tibetan |
| 2 | South Brisbane | Peruvian |
| 3 | Fortitude Valley | Filipino |
| 4 | Paddington | French-Vietnamese |
| 5 | South Bank | Crepes |
| 6 | Upper Mount Gravatt | Malaysian |
| 7 | New Farm | Tibetan |
| 8 | Brisbane CBD | Indian |
Perth
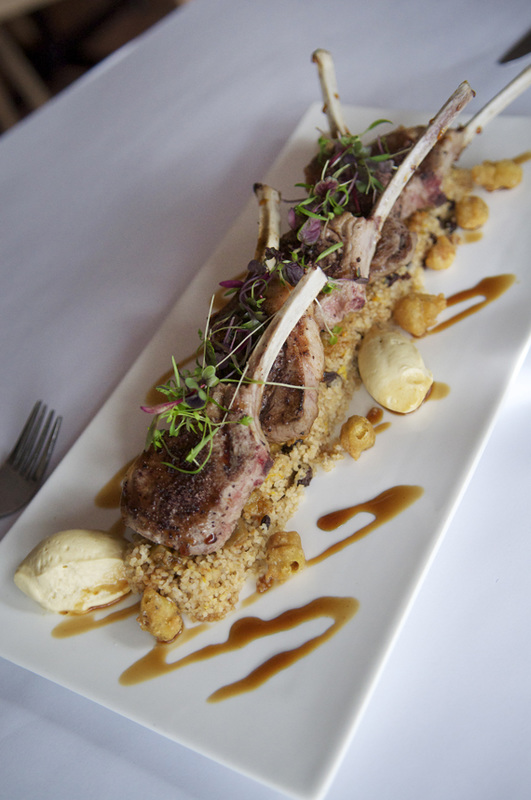
Meeka Moroccan, Subiaco – image credit Meeka
| Rank | Perth | Go for… |
| 1 | Subiaco | Moroccan |
| 2 | Mount Lawley | Indonesian |
| 3 | Northbridge | Vietnamese |
| 4 | East Victoria Park | Szechuan |
| 5 | Perth CBD | Korean |
| 6 | Fremantle | Nepalese |
| 7 | Hillarys | African |
| 8 | Joondalup | Pakistani |
Adelaide
Norberto’s Buenos Aires Brasserie, Adelaide – image credit @timyerrell
| Rank | Adelaide | Go for… |
| 1 | Adelaide City | Argentinean |
| 2 | Glenelg | Peruvian |
| 3 | North Adelaide | Tibetan |
Canberra
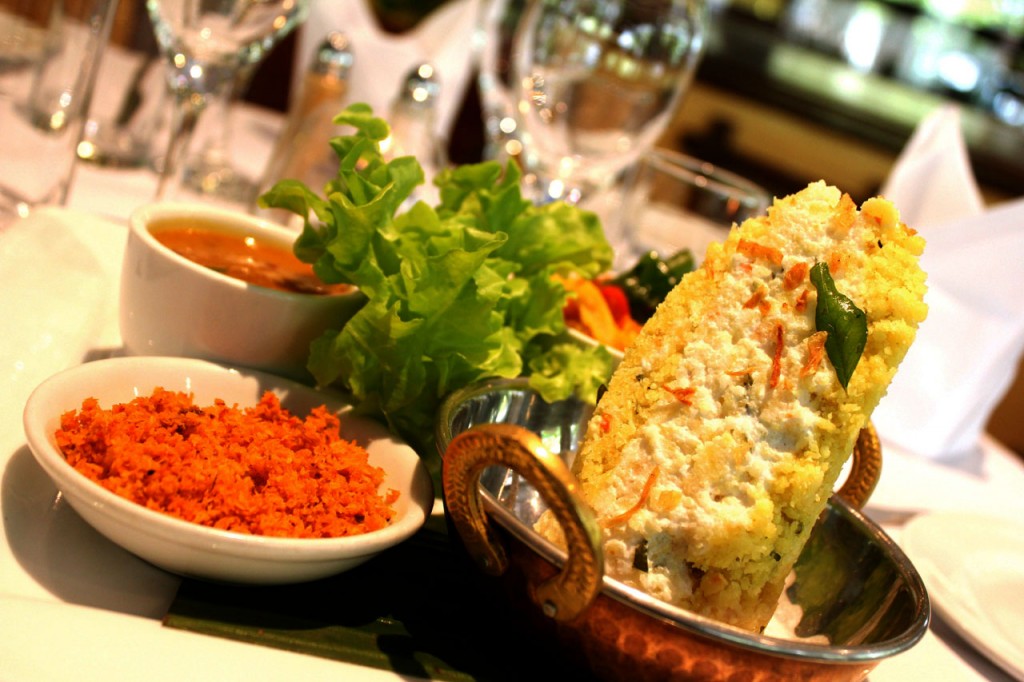
Banana Leaf Sri Lankan Restaurant, Canberra – image credit Banana Leaf Restaurant
| Rank | Canberra | Go for… |
| 1 | Canberra City | Sri Lankan |
| 2 | Belconnen | Cambodian |
| 3 | Woden | Ethiopian |
Having trouble choosing between your city’s hot restaurant districts? Our sophisticated suburb finder uses all of our collected data and analysis to find your ideal suburb.
 * Data source: Every BBQ and dinner party you’ve ever been to
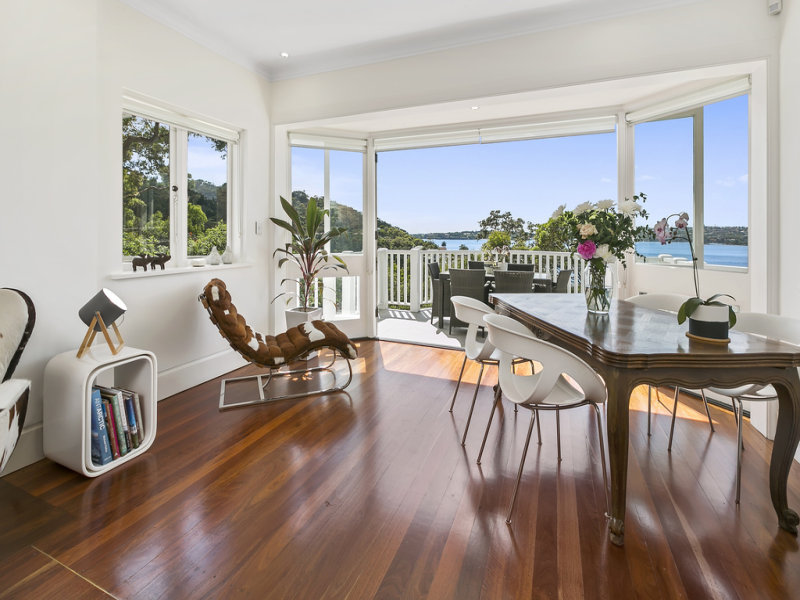
 image:stonerealestate


 (
(


