
25 Years of Research. One Easy Interface.
We tested every property metric across 25 years of Australian transactions and built them into a single platform. Green means a metric drives growth. Red means it drags. You see the signals. We did the research.
Looking for Classic Microburbs?
See a Real Suburb Report. Right Now.
Open any of these full Microburbs reports — 40+ pages of growth indicators, street-level medians, risk maps, and demographics. No signup. No paywall on the first read.
You Already Have Data. What You Need Is an Answer.
Investors and buyers' agents juggle 3 to 5 separate subscriptions. Dozens of tabs. Hours of cross-referencing. And still the question remains: is this suburb actually going to grow?
Every Research Project. One Interface.
Since 2014, Microburbs has published research on market cohesion, rental growth thresholds, public housing proximity, noise impact, school catchments, and dozens more factors. Each finding is integrated into the platform.
You do not need to read the papers. The Growth Indicators distil every finding into a single colour per metric, per suburb. But if you want the detail, every paper is published and open.
What Other Platforms Give You
What Microburbs Gives You
Street-Level Precision. Not Suburb Averages.
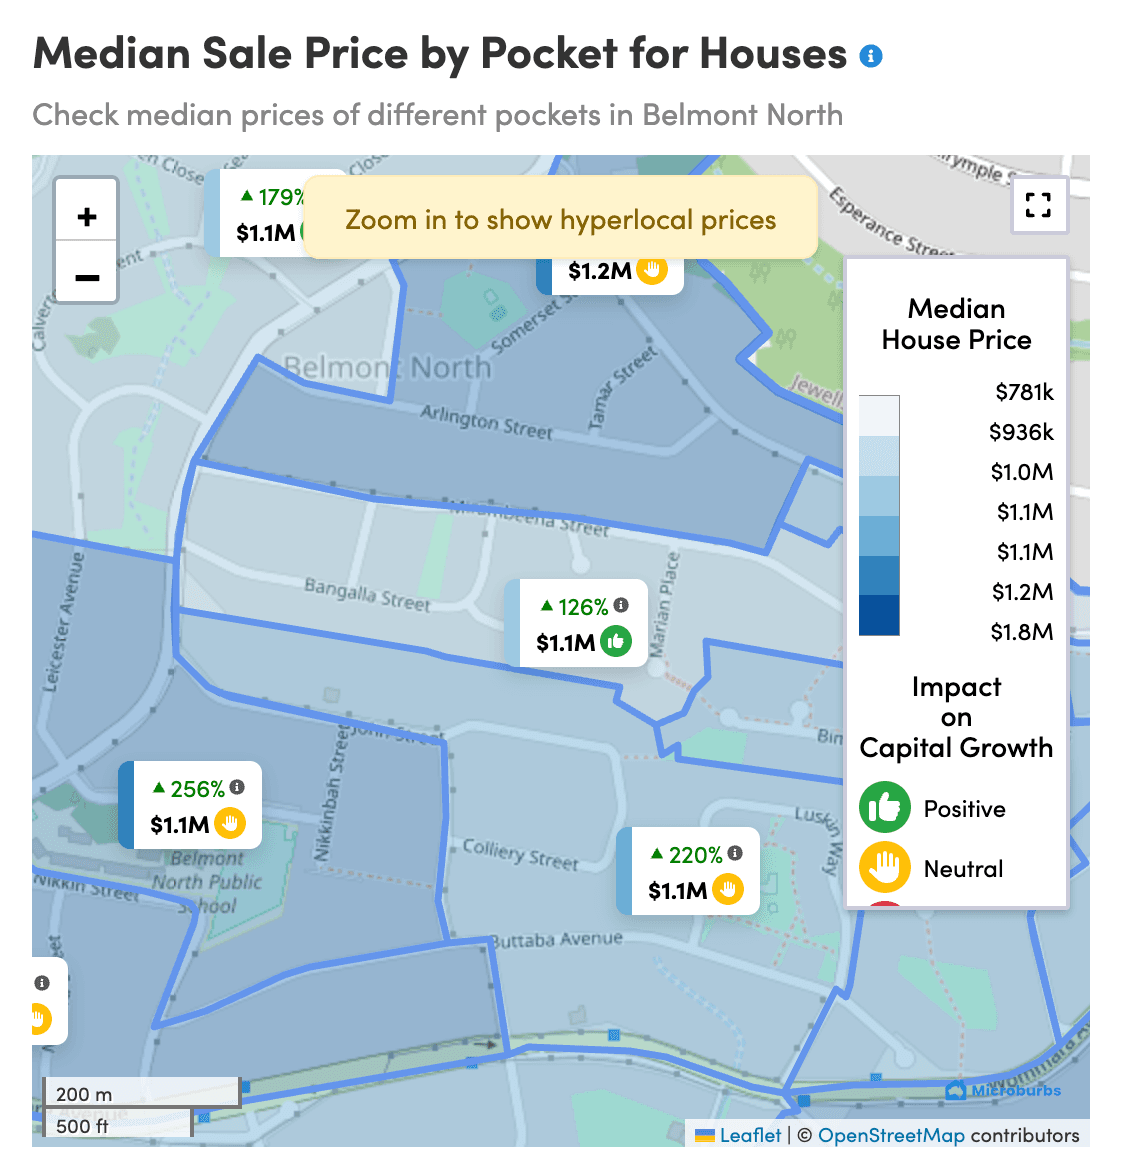
Properties on the same street move in the same direction 96% of the time. Every suburb average hides streets that outperform and streets that underperform. Microburbs maps growth and indicators at the block level.
Price agreement: how often properties at each geographic level move in the same direction. Read the paper →
What Investors and Agents Actually Say
These are direct quotes from customers explaining how they use the platform.
"This is what I was trying to do, is to get to a point where we were utilising one tool rather than four. And that's great."
"It just gives them so much certainty... independent data... it quantified for our clients, and gave them peace of mind."
"What I was missing with so many things was street level data."
"The valuation -- CoreLogic has an error rate of around 13%, you have around 6%, so yeah, it's amazing."
"So much better than leaning on multiple websites here and there, getting those public housing, then flood zone and those sort of things."
"I do think it's going to give me an edge... dialog that's going to make me just stand out a fraction."
The Platform in Action. This Week.
Live data from the Microburbs platform. Updated weekly.
Suburb Movers · Live
Independent Study
Can GPT Pick Growth Suburbs?
We asked every version of GPT to name the top 20 growth suburbs in each state. Then we checked the actual prices.
GPT-3.5 ranked Sandy Bay as its 2nd strongest pick, predicting 8% growth. Three years later, prices fell 15%. Anyone who bought lost $201,000. Jindabyne was its 46th pick. Down 18.1%. Lost $243,000.
GPT recites phrases from real estate articles. It does not analyse live market data. Six of seven versions underperformed a random selection.
From Region to Property in Four Steps
Each step narrows the funnel. At every level, the Growth Indicators guide your decision.
Filter Suburbs
Use the Suburb Finder to screen 4,000+ suburbs by growth indicators, price range, yield, and dozens more filters.
Analyse the Suburb
Run a 40-page suburb report. Every metric carries a traffic light. Drill down to street-level medians and growth.
Find Properties
Search listings within green-light suburbs. Filter by price, features, and distance to amenities.
Run Due Diligence
Deep property report: AVM valuation, comparable sales matched on 30+ features, risk maps, and growth signals.
What the Industry Is Saying
Buyers agents, investors and property commentators on Microburbs — in their own words.

"Excellent team. Quick responses and personalised support. The data is well-organised and easy to understand, and the visuals are great. The features I use the most are the suburb analysis and property reports. The members area is very active, and the community is extremely helpful."

"Microburbs makes property research so much easier. Instead of jumping between sites, I can see all the key stats in one place. The suburb reports are straightforward and actually useful when comparing areas. It's saved me time and helped me feel more confident in my decisions."
"This is an absolute game changer. I've bought several investment properties during the past ten years and each purchase involves so many hours of research. I am so impressed with Microburbs."
"Luke and his team created an awesome product and website. If you're looking to pick a suburb for your home or investment property and want data to guide you, their website is a game-changer."

"I wish I had known this tool earlier as I could have avoided a few mistakes. It identifies things like nearby public housing that are hard to spot during inspections."
"Microburbs provides unmatched level of detail from suburb reports all the way to ultra localised property reports. The team is also available to help you analyse the data and give support."
"I used this website while purchasing a property. It allowed me to determine whether the property was in a flood or bushfire zone and check the noise levels in the area."

"An excellent tool. Only if I knew about this 10 years ago. Microburbs gives so much valuable insight into areas you are looking to purchase in."
"Started loving the tool. I was doing my own analysis in real estate and domain till now. With Microburbs I am able to make decisions based on data, drill down the suburb."
"Great product for quickly finding out key stats for a suburb relevant to property purchase. The maps and graphs are easy to read and informative."
Updated daily and weekly. Not last month.
As Featured In






Trusted By





Walk Through Your Shortlist With the Founder and CEO
Book 15 minutes with Luke. He will walk you through the Growth Indicators for your suburbs, explain the signals, and help you read the data.
Book an Appointment NowStop guessing. Start reading the signals.
25 years of research, 100+ data sources, and 2 billion data points. All reduced to green, amber, or red.

Common questions
The things people ask before their first report.
What data does Microburbs actually give me?
Street-level detail for every Australian suburb: median house price, median rent, 10-year growth, renter percentage, and rental and sales turnover — plus demographics, schools, transport, and flood, bushfire and other risk mapping. Street-level means you can find the streets with 8% renters inside a suburb averaging 35%.
Where does the data come from?
We gather it ourselves. Our own database holds more than 90 million property listings, collected first-hand rather than bought in — which is what lets us go all the way down to street level and refresh it every week.
How often is it updated?
Median prices and growth forecasts weekly, every Monday. Property listings daily. Demographics annually, aligned with ABS releases. Risk maps as councils and government sources update them. Most competitors update monthly.
How accurate is the growth forecast?
The annualised growth forecast has an 85% success rate across 15 years of backtesting and more than 180 monthly tests. When we predict a suburb will beat the 7% national average, we are right 85% of the time. Our top picks have historically returned 14.8% compound annual growth over four years.
Why are your median prices different from other property sites?
We use a Smart Median — a hedonic model that accounts for capital improvements, market timing and property mix. A simple median is just the middle sale price, which skews whenever only expensive or only cheap properties happen to sell that period. Ours reflects the typical property in a suburb, which often means a lower but more accurate number.
Is there a free trial?
Not a traditional trial. A free account gives you access to every product but not all of the data. Monthly plans can be cancelled at any time, so you can test for a single month at full price with no lock-in. You can also buy individual reports without a subscription: $49 for a suburb report, $39 for a property report.
More questions? Read all 50+ answers.