Microburbs
EOFY Sale50% off all reports & plansuse code EOFY26
Microburbs Consulting

Predict and explain human decisions at the address, anywhere in Australia.

Microburbs fuses 633 property attributes, 5,182 suburb fields, and 473 government datasets onto every one of Australia's roughly 16 million addresses. Whether you need a franchise territory drawn around a true demand surface, a polling booth model that explains why working-class Labor voters voted No, or a forecast of who is most likely to switch to an EV, we already hold the data and the modelling pipelines. You bring the question.

Luke Metcalfe
Luke Metcalfe
Founder · Microburbs
~16M
Australian addresses, every property linked from GNAF up to SA4
11.87M
Validated repeat-sales pairs in the cleaned holds register
473
Government datasets ingested, modelled and joined
350k
Mesh blocks scored across eight livability dimensions and thousands of features
The moat

Hyper-local resolution, on every Australian household

Most place-data vendors operate at suburb or local-government level. Microburbs operates one to two levels finer. The 14% price gap we routinely observe between neighbouring streets in the same suburb in the same year is the clearest proof that the resolution matters, and that the questions worth answering are address-level, not suburb-level.

01

Address-level, not suburb-level

Every one of Australia's roughly 16 million GNAF addresses linked to its street, mesh block, SA1, SA2, SA3, SA4, postcode, LGA, SUA and the whole country. 350,000 mesh blocks scored across eight livability dimensions and tens of thousands of features each.

02

Largest validated repeat-sales register in Australia

11.87 million paired property holds, cleaned with twenty noise filters that reject bulk replicas, deposit-versus-settlement duplicates, and price-parsing errors. Underpins capital-growth, AVM, gentrification and forced-sale models.

03

Six years of fused data layers

Council minutes scraped and parsed across major LGAs. Listings, agents, builders. Cadastre, zoning, heritage. Satellite imagery and street-view computer vision. Demographics, schools, NAPLAN, crime, climate peril, slope, terrain, NBN, infrastructure.

04

Predictive ML, not just description

Capital-growth forecasts. Distressed-sale signals. Mortgage-stress index. Gentrification trajectory. House, unit and rental AVM. Internal benchmarking against actual outcomes since 2002.

05

The general principle

Give Microburbs an address-level survey or label of any attribute, income, wellbeing, mobility, attitude, behaviour, and we can build a national propensity model off the FeatureStore. This is the single most important sentence on this page.

06

Defensible to a regulator

Every prediction ships with a sample data display, EDA, expert sanity check, confidence intervals, and a driver explanation written for a non-technical buyer. Methodologies have stood up to grant audits and bank credit committees.

Sectors we serve

Where address-level data changes the answer

The same FeatureStore that powers a property report powers a franchise territory map, a political booth analysis, an APRA climate vulnerability submission, and an aged-care site selection brief. Below is what we have built or prototyped for each sector.

Real estate, residential and commercial

The home-court sector. Twenty-five years of Australian property data, AVMs, repeat-sales registers, listings, agents, council pipelines, and microburb livability, all tuned for buyers' agents, developers, syndicators, REITs, valuers and asset managers.

  • Site finding and site scanning, residential and commercial
  • Net effective rent modelling (incentives, rent-free periods, fit-out)
  • Unusual commercial classes: childcare, BTR, last-mile, medical, data centres, self-storage
  • House, unit and rental AVM with confidence intervals
  • Capital-growth forecasts at suburb, street and address level
  • Below-AVM bargain detection and hidden-price detection
  • Distressed-sale radar, sold-at-a-loss, mortgage-stress signals
  • Tightly-held, gentrification trajectory and street typology scoring
  • Investor concentration, owner-occupier ratio, tenure mix
  • Agent quoting accuracy and underquoting detection
  • Council-pipeline and rezoning-probability overlays
  • Lead lists and actionable insights pushed to your CRM
Public examples: AVM, capital-growth forecast, mortgage stress, distressed properties, tightly held, council minutes NLP. All linked under Featured research below.

Franchise and retail territory mapping

Draw franchise territories around the demand surface, not the LGA boundary. Combine population, household income proxies, lifestyle, competitor coverage, drive-time and council-approved development pipelines to rank candidate sites and balance existing networks.

  • Demand surface at mesh block resolution
  • Competitor coverage and cannibalisation modelling
  • Drive-time and catchment fit
  • Development pipeline scraped from council minutes
  • Investor-ready maps and territory packs
Heritage work: Oporto and Red Rooster store quality and behavioural CRM. Stores cutting cancellations by 50 percent or more saw delivery growth of around 130 percent.

Political and electoral analytics

We model voting at polling-booth granularity using the same demographic, livability and economic features we use to model property markets. Past work explains why Labor's working class base voted No on the Voice, and why the educated and rich were most likely to vote Yes.

  • Polling booth propensity models with SHAP drivers
  • Two-party preferred swing forecasts at SA1
  • Issue-salience modelling at microburb level
  • Targeting overlays for candidates and campaigns
  • Demographic counterfactuals (what swung whom, and why)
Public output: the 2023 Voice referendum analysis on microburbs.com.au, plus the polling booths research project linked below.

Federal, state and council

Microburb-level vulnerability indices, place-based program targeting, site selection for aged care, childcare, GP clinics, EV chargers and community hubs. Civic intelligence subscription for developers, regulators and NGOs.

  • Gentrification trajectory and deprivation indices
  • Site selection and demand forecasting
  • Council minutes NLP and rezoning probability
  • NDIS, aged-care and childcare demand at street level
  • Custom national data layers delivered by API or parquet
Buyers: ABS, AIHW, Geoscience Australia, AURIN, AHURI, PHNs, state planning agencies, councils, foundations.

Banks, insurers and regulators

House, unit and rental AVM with confidence intervals. Capital-growth forecasts at suburb, street and property level. Mortgage stress and forced-sale signals. Address-level climate vulnerability defensible to APRA.

  • AVM and rental AVM, audit-ready methodology
  • Mortgage-stress and tenant-turnover indices
  • Forced-sale radar and sold-at-a-loss detection
  • APRA Climate Vulnerability submission support
  • White-label scores embedded in lending workflows
Buyers: APRA-regulated banks and insurers, mutuals, mortgage brokers, RBA, ASIC and ATO data analytics teams.

Health and social services

Place-based health-needs assessments, aged-care and childcare demand, public housing need, financial inclusion gap maps, women's safety and domestic-violence prediction (where label data is available).

  • School-zone gentrification and enrolment forecasts
  • Aged-care and childcare site selection
  • Public-housing detector built from street-view CV
  • Heat and flood vulnerability at household level
  • Health-service utilisation by mesh block
Buyers: 31 PHNs, Department of Health, Department of Social Services, AIFS, NDIS providers, foundations.

Energy, climate and infrastructure

Address-level EV adoption propensity, rooftop solar uptake, climate peril, infrastructure deficit mapping. Built on dwelling type, off-street parking, household income proxies, electricity demand profile, neighbour adoption and charging access.

  • EV propensity layer over every Australian address
  • Solar uptake and DER adoption forecasts
  • Climate vulnerability index per microburb
  • Aircraft noise, slope, power-line proximity layers
  • Network planning support for distributors
Buyers: Net Zero Authority, ARENA, CEFC, AER, ESB, distributors, retailers, charger operators.
What we measure

Six thousand fields, on every Australian address

A working inventory of the FeatureStore. We measure what other vendors describe. Each category below is one slice of the data we already hold, ready to be joined to your label or your customer file.

~16M
Australian property addresses (GNAF, every state and territory)
350,000
Mesh blocks, the finest geography Microburbs operates at
33,610
Features per mesh block in the all-features build (Chatswood-Lane Cove SA3 example below)
5,182
Suburb-level fields modelled across SAL, SA1, SA2, SA3, SA4
473
Government and external datasets ingested and joined
94M
Real estate listings going back to 1990, full descriptions
90M
Demographic data points down to ~120-household resolution
11.87M
Validated repeat-sales pairs in the cleaned holds register

What 33,610 features per mesh block actually looks like

The screenshots below come from one SA3, Chatswood-Lane Cove, with 1,521 mesh blocks. Multiplied across the country we hold tens of billions of feature observations, refreshed from the underlying datasets on a rolling basis.

1,521
mesh blocks in this SA3
33,610
features per mesh block
~50M
cells, this SA3 alone

Examples shown are from internal Microburbs builds. Available to consulting clients under NDA.

PR

Property attributes

~140 fields per address
  • Beds, baths, garages, ensuites, study, granny flat
  • Land area, building area, frontage, depth, slope
  • Year built, last renovation, dwelling type, construction material
  • Pool, deck, verandah, solar, off-street parking
  • Title type, parcel geometry, easements
  • Zoning, heritage overlay, planning constraints
  • NBN technology type, electrical capacity, gas connection
  • Hidden features parsed from listing descriptions via NLP
Plus computer-vision features from satellite and street view (roof condition, vegetation cover, public-housing detector).
VL

Valuation and market

~85 fields per address and street
  • House AVM, unit AVM, rental AVM, all with confidence intervals
  • 10-year capital growth, 5-year, 1-year
  • Capital growth forecast (4-year horizon)
  • Days on market, price drift, withdrawal rate
  • Below-AVM bargain detector, hidden-price detection
  • Repeat-sales CAGR, hold-period analysis
  • Suburb median, street median, microburb median
  • Investor concentration, owner-occupier ratio
  • Tightly-held score, turnover rate
DM

Demographics and population

~700 fields per microburb
  • Current population, projected population, density
  • Age distribution, fertility rate, household composition
  • Country of birth, language at home, ancestry
  • Australian Aboriginal population
  • Religion, conservatism score, alienation index
  • Educational attainment, occupation mix, employment status
  • Mortgage repayment to income, rent to income
  • Average welfare payments, income deciles
  • Bicycle, car, public-transport, work-from-home commuters
Includes Microburbs ethnicity composition predictions where census suppression hides cell counts.
LV

Livability scores (eight dimensions)

8 composite scores per microburb
  • Affluence Score
  • Community Score
  • Convenience Score
  • Family Score
  • Hip Score
  • Lifestyle Score
  • Safety Score
  • Tranquillity Score
Each score decomposes into 30 to 50 underlying components, all individually queryable.
SC

Schools and childcare

~50 fields per address
  • Catchment area for primary, secondary and selective schools
  • NAPLAN performance trajectory by school
  • School ICSEA, enrolment trend, ethnicity mix
  • Independent and Catholic school presence
  • Childcare centre density and average rating
  • Distance to nearest school, time to school by mode
  • Catchment-zone gentrification trajectory
CR

Crime, safety and disadvantage

~120 fields per microburb
  • Common assault, sexual assault, robbery, break-and-enter
  • Property damage, drug offences, public-order offences
  • Mesh-block crime score, trend over five years
  • Addiction levels index
  • Underclass and disadvantage indices
  • Domestic-violence proxy where label data exists
  • Public-housing concentration (street-view CV detector)
  • Mortgage stress and forced-sale precursors
EN

Environment and climate

~95 fields per address
  • Bushfire prone area classification
  • Flood zone, riverine and coastal inundation
  • Sea-level-rise exposure
  • Heat vulnerability, urban heat-island intensity
  • Air quality index, particulate exposure
  • Slope, terrain, elevation, aspect
  • Vegetation cover, tree-canopy from satellite
  • Distance to beach, river, national park
  • Insurance peril composite
IN

Infrastructure and amenity

~110 fields per address
  • Distance to CBD, train station, light rail, bus stop
  • Aircraft noise contour exposure
  • Power-line and substation proximity
  • NBN technology type, mobile coverage
  • Hospital, GP, pharmacy and dentist density
  • Retail, supermarket, cafe, restaurant, gym density
  • Library, town hall, place of worship density
  • Volunteer organisation density (community proxy)
PL

Planning, zoning and heritage

~75 fields per parcel
  • Current zone, height limit, FSR, setback rules
  • Heritage overlay, conservation area
  • Tree preservation order
  • Zoning history (rezoning probability prediction)
  • Development application pipeline
  • Builder commencement signal
  • Council minutes signals (rezoning, infrastructure, contention)
  • Land valuation history, objection propensity
EC

Economic activity and business

~90 fields per microburb
  • Business activity index (entries and exits per capita)
  • Industry employment mix
  • Mining workforce share (capital-growth drag indicator)
  • Tourism intensity
  • Innovation economy readiness
  • Premium renovation index
  • Home office and work-from-home propensity
  • ABN density and turnover
RT

Rental, listings and agent dynamics

~80 fields per address and street
  • Time on market, days to sell, days to lease
  • Price drift between list and sale
  • Withdrawal pattern, relisting frequency
  • Agent identity and performance score
  • Tenant turnover rate, MRI rental data
  • Strata levies, body corporate fees
  • Agent quoting accuracy, underquoting detection
  • Rental yield, gross and net
PB

Political and electoral

~60 fields per polling booth
  • Two-party preferred history, federal and state
  • Primary vote by party at booth and SA1
  • Voice referendum Yes/No vote per booth
  • Demographic drivers via SHAP at SA1
  • Incumbent margin, swing trajectory
  • Polling-booth catchment population
  • Issue-salience proxies (housing, climate, immigration, cost of living)
  • Cultural-integration index

Browse a sample of the public field dictionary at microburbs.com.au/definitions. The full FeatureStore is available to consulting clients under NDA, including the 5,182 suburb fields, the 633 per-address attributes, and every join key needed to bring your own data alongside.

Some of who we have worked with

Public-facing chains, healthcare networks, and Luke's earlier ventures

Microburbs Consulting and its predecessor Rapid Intelligence have delivered to commercial chains, healthcare providers and government clients. A selection where the work has been spoken about publicly is below.

LendleaseAustralia's largest property and infrastructure group.
IAGInsurance Australia Group. Address-level peril and exposure work.
EG FundsAustralian property funds manager.
News CorpEditorial and audience data work.
WoolworthsSite selection, catchment and demand modelling.
Property BuyerAustralia's longest-running buyers' agency.
Physio InqNational healthcare franchise. Demand mapping and market modelling.
OportoQSR chain. Store-quality, cancellation drivers, behavioural CRM.
Red RoosterQSR chain. Store-level uplift from quality intervention.

Selected past and present clients of Microburbs and the Rapid Intelligence consulting practice. Many engagements are under NDA and are not listed.

Client interview, on camera

Jonathon Moody, Physio Inq, on working with Luke

The Physio Inq team brought Luke in to bring data-driven thinking to franchise growth and market modelling. The interview covers how the work shaped their decisions and what changed as a result.

"Luke is one of the most data-driven people I have ever worked with. He brought a level of rigour to the work that we just had not seen before."
Jonathon Moody, Founder, Physio Inq
Service menu

Twelve service lines, all already plumbed

Each line is something Microburbs has either delivered, prototyped, or has all the data plumbing to build inside a quarter. Engagements are scoped to the brief.

#Service lineWhat you getTypical buyer
1Address-level decision predictionTrain a propensity model at GNAF resolution for any binary or continuous decision a funder cares about. You bring the dependent variable, we bring the feature stack.Federal departments, regulators, utilities, banks, insurers
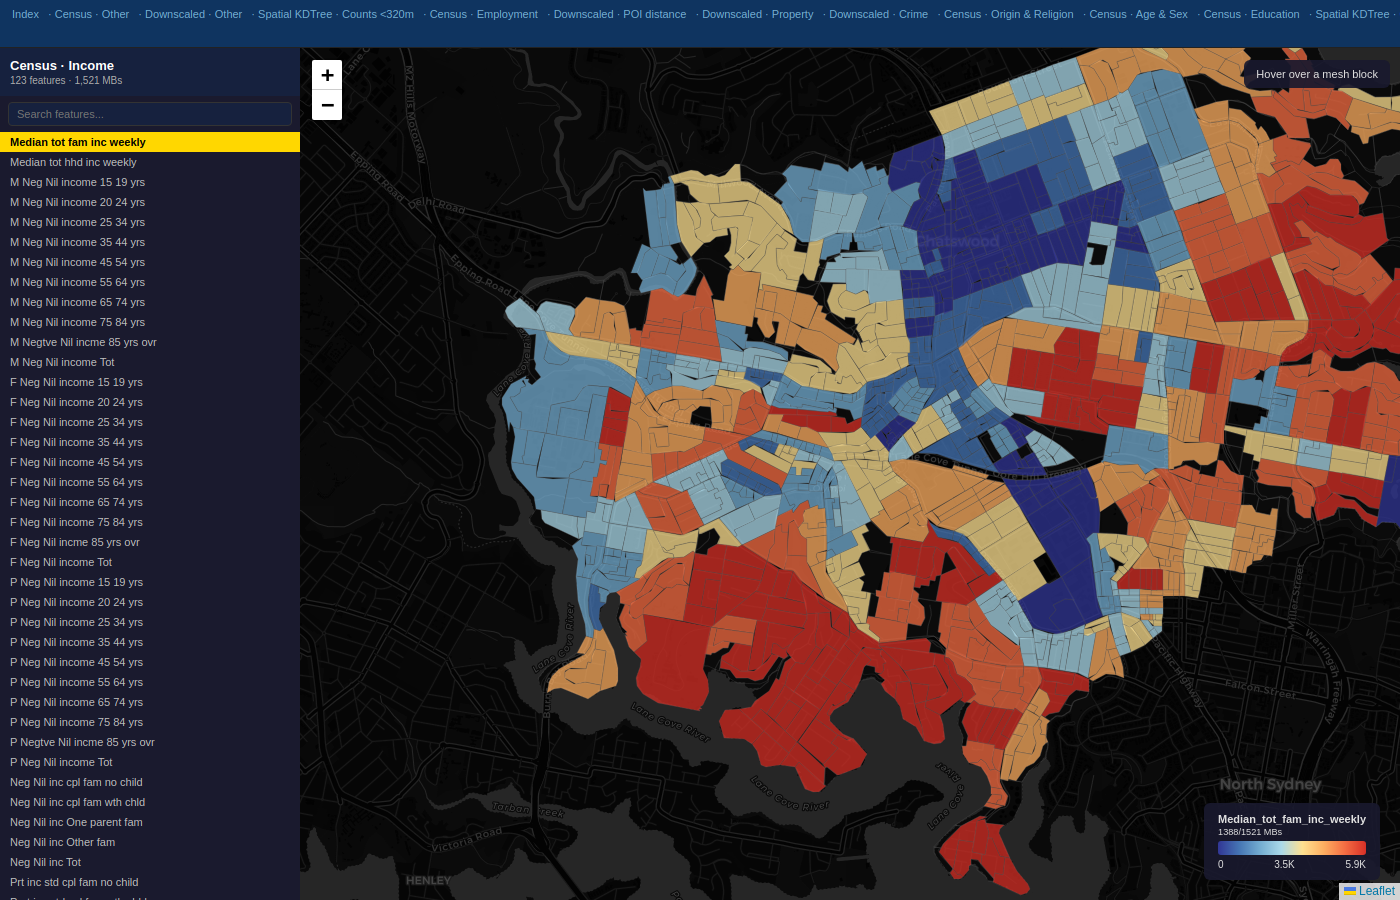
2Microburb mapping and vulnerability indicesPlace-based mapping at mesh block level. Gentrification, deprivation, affluence, climate vulnerability, family stability, social cohesion.Federal social services, state planning, councils, foundations, PHNs
3Site selection and demand forecastingOptimal locations for aged care, childcare, GP clinics, schools, EV chargers, retail, community hubs.Health infrastructure, energy, retailers, councils
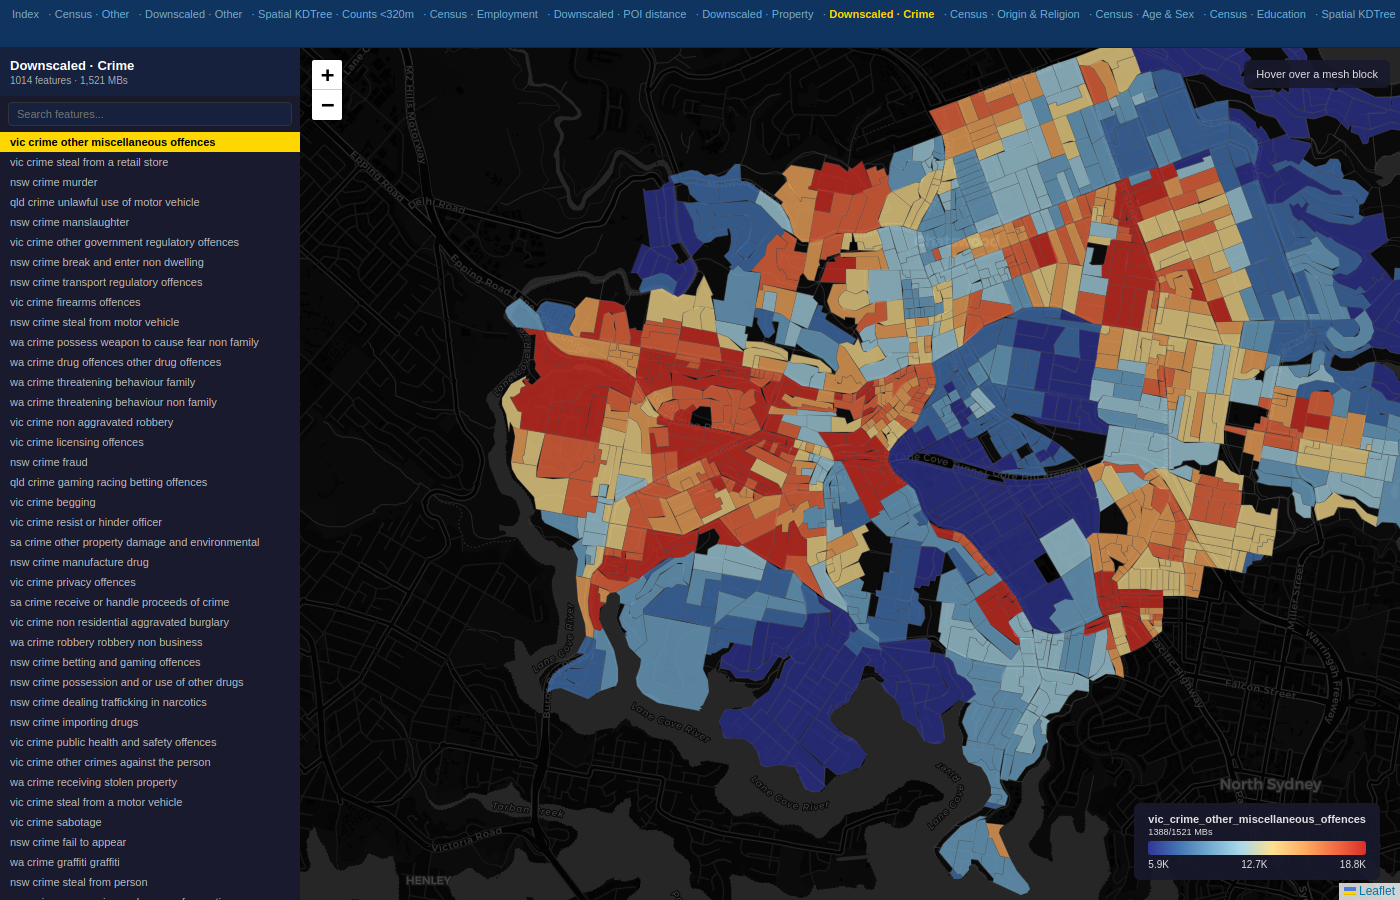
4Place-based risk and resilience scoringMicroburb-level scoring across climate peril, crime trajectory, mortgage stress, tenancy churn, insurance peril.APRA, ICA, NEMA, insurers, banks, emergency services
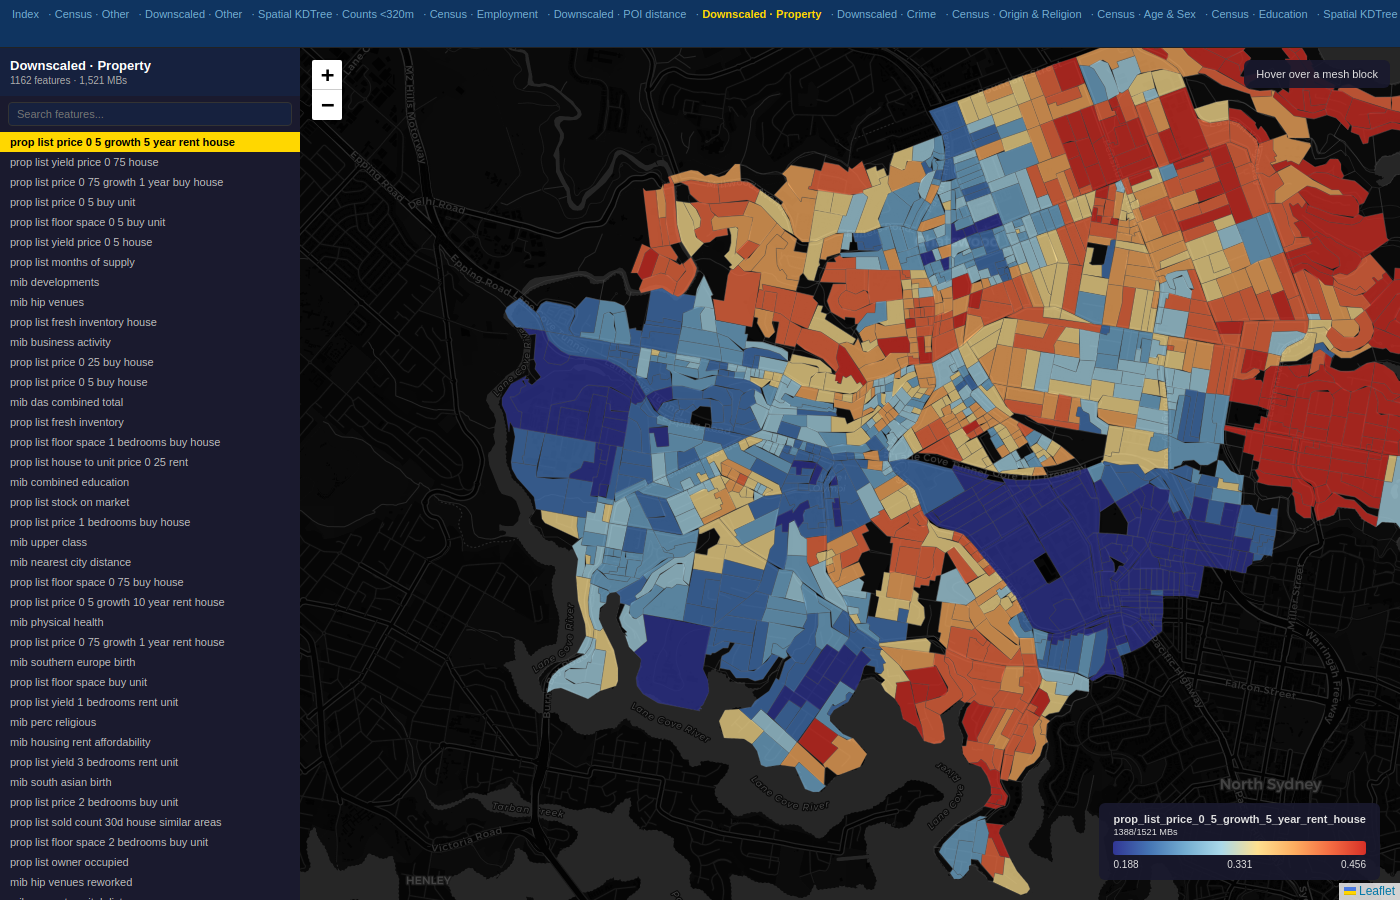
5AVM and capital-growth disclosureHouse, unit and rental valuations with confidence intervals. Defensible to bank credit committees and regulators.Banks, regulators, developers, investors
6Civic intelligence subscriptionStructured feed from council minutes, planning decisions, builder commencement, heritage and zoning changes.Developers, regulators, lobbyists, environmental NGOs
7Custom national data layerNational layer of X at GNAF level delivered as parquet, CSV, API, or hosted dashboard.ABS, AIHW, Geoscience Australia, AURIN, AHURI, large agencies
8Behavioural CRM and program-uptake analyticsDirect port of the loyalty, churn and store-quality work delivered to commercial chains, applied to citizen-segment uptake and program retention.Services Australia, BETA, DSS, utilities, NFP membership bodies
9Whitepapers, disclosure and tender writingInvestor-grade whitepapers, methodology disclosures, landing pages and blog posts, sellable as a standalone capability.Banks, insurers, regulators, consulting firms, applicant SMEs
10Population mobility and migration analyticsForecast internal migration, workforce shifts and demographic ageing at sub-LGA resolution.State regional development, transport, NDIS demand planners
11Computer vision on street-view and satellitePublic-housing detector already shipped. Extensible to amenity audits, building-condition scoring, vegetation cover, rooftop solar potential.Social housing, urban planning, ABS, environment agencies
12Embedded data scientist and co-designShort-term secondment of the Microburbs team into your analytics function, with knowledge transfer and model handover.Treasury, Health, Planning, ABS, large research institutions
Hero deliverables

What "the deliverable" actually looks like

Concrete examples of the kind of product Microburbs ships, useful when a procurement officer asks what this would actually look like.

Site finder for residential developers and buyers' agents

Filter every Australian property by AVM, growth forecast, yield, livability, zoning headroom, council pipeline pressure and any number of buyer-specific criteria. Outputs a ranked candidate list with a one-page brief per site.

Buyer: developers, buyers' agents, syndicators, family offices, BTR operators

Commercial real estate site scanner

Scan all-of-Australia for sites that match a brief: childcare-permissible parcels with 800+ kids in catchment, BTR-zoned land within 1 km of a station, last-mile logistics on industrial-zoned parcels with three-phase power, data-centre-grade lots with NBN-backbone proximity, medical-suite sites near established GP catchments.

Buyer: commercial developers, REITs, fund managers, healthcare and childcare operators, logistics

Net effective rent and incentive modelling

Headline rent versus net effective rent, modelled across office, retail and industrial leases, accounting for rent-free periods, fit-out contributions, breaks and stepped reviews. Benchmarked at building, precinct and SA2 level.

Buyer: office and industrial REITs, valuers, leasing teams, tenant reps, property managers

Actionable insights feed

Daily or weekly digest of distress signals, bargain alerts, unusual listings, agent quoting anomalies, rezoning hits and council-pipeline movements that match a saved buyer brief. Delivered as email, Slack or pushed to CRM.

Buyer: buyers' agents, developers, investors, search firms, finance brokers

Address-level EV adoption propensity layer

For every Australian address, the probability of EV adoption over the next 24 months. Inputs include dwelling type, off-street parking, household income proxies, electricity demand profile, neighbour adoption and charging access.

Buyer: Net Zero Authority, state energy departments, distributors, charger operators

Franchise territory and demand surface pack

For a national chain or franchise system, mesh-block-level demand scoring, territory recommendations, cannibalisation modelling and a development pipeline overlay scraped from council minutes. Delivered as interactive map, territory parquet and investor pack.

Buyer: franchise systems, retailers, healthcare networks, fitness chains, food and beverage groups

Polling booth propensity and swing model

Per-booth predictions of two-party preferred and Yes/No vote, with SHAP-style driver attribution at SA1 level, in the language of demographics, livability and economic stress. Used to explain past results and target future campaigns.

Buyer: party strategists, candidates, lobby groups, journalists, academics

Microburb mortgage-stress dashboard

Real-time and 12-month-forward stress signal at mesh block level. Combines repayment-to-income proxy, listings churn, tenant turnover and distressed-sale precursors.

Buyer: RBA, APRA, ASIC, ATO, financial counsellors, banks

Aged-care and childcare demand forecast

Provider-facing tool combining birth rates, ageing-in-place propensity, supply pipeline and competitor coverage to rank candidate sites for new facilities.

Buyer: provider networks, Department of Health, Department of Education, foundations

Civic intelligence subscription feed

Structured weekly digest of council minutes, planning decisions, builder activity, zoning and heritage changes.

Buyer: developers, lobbyists, environmental NGOs, materials suppliers

School-zone gentrification and enrolment forecast

For every public-school catchment, demographic trajectory and 5-year enrolment forecast.

Buyer: education departments, PHNs, Catholic and independent networks

Climate vulnerability index for capital-adequacy submissions

Address-level peril plus socioeconomic vulnerability for banks and insurers responding to APRA's Climate Vulnerability Assessment. Defensible methodology, audit trail, confidence intervals.

Buyer: APRA-regulated entities and the regulator

Street-view amenity and condition audit

Automated identification of public-amenity deficits, building-condition scoring, vegetation cover, by mesh block, using street-view computer vision. We have already shipped a public-housing detector built on this stack.

Buyer: state planning, social housing providers, ABS, environment agencies
Proof points

Numbers from Microburbs research, not marketing

Each is sourced from a published Microburbs research deliverable, with full methodology and data lineage available on request.

14%
Price gap at suburb boundaries, same year, neighbouring streets
11.87M
Validated repeat-sales pairs in the cleaned holds register
+1.8%
Median annual capital-growth advantage on quiet residential streets, vs the local benchmark
−4%
Annual capital-growth penalty for properties on primary roads, vs the local benchmark
−0.7%
Annual capital-growth drag per 1 to 5 percent of local workforce in mining
44%
Capital-growth share of total Australian residential returns since 2002
8
Independent livability dimensions scored at mesh block
+130%
Delivery growth seen at chain stores that cut cancellations by 50 percent or more
Featured research

Walk the same models we would build for you

A selection of public Microburbs research projects. Each is a working demonstration of a capability we can rebuild for your jurisdiction, customer cohort or franchise network.

Political

Polling booth propensity and Voice referendum drivers

Per-booth modelling of how Australia voted, with demographic, economic and livability drivers identified at SA1.

View project →
Civic intelligence

Council minutes NLP across major LGAs

Structured signals from thousands of council meetings: rezoning, builder commencement, heritage and planning changes.

View project →
Risk

Mortgage stress index at mesh block

Combines repayment-to-income proxy, listings churn, tenant turnover and distressed-sale precursors.

View project →
Forecasting

Capital growth forecasts at street and property level

Address-level predictions back-tested against transactions since 2002.

View project →
Valuation

House and unit AVM with confidence intervals

Whole-of-Australia automated valuation model, defensible to bank credit committees.

View project →
Valuation

Rental AVM

Per-property rent estimates feeding yield and rental-stress modelling.

View project →
Risk

Crime, disadvantage and capital growth

Mesh-block crime modelling and its relationship to capital growth across the country.

View project →
Infrastructure

Aircraft noise contour layer

National noise exposure layer over every address, fused with property attributes.

View project →
Planning

Heritage layer

Statewide heritage overlays joined to every parcel, with renovation and zoning context.

View project →
Planning

Zoning history and rezoning probability

Historical zoning fused with planning decisions to predict where rezoning is likely next.

View project →
Demographics

Density and dwelling stock

Per-microburb dwelling stock, density and growth, with development pipeline overlay.

View project →
Market structure

Investor concentration by suburb and street

Where investors dominate, where owner-occupiers dominate, and what that does to growth.

View project →
Risk

Insurance peril and claim risk

Address-level peril, climate exposure and claim-relevant indices.

View project →
Property

Built year and renovation indicators

Estimated build year and renovation activity for every Australian dwelling.

View project →
Infrastructure

DBYD utility infrastructure mapping

Utility and underground asset coverage modelled at parcel level for telcos and distributors.

View project →
Behaviour

Listings, agents and price drift

Time-on-market, price drift, withdrawal patterns and agent performance.

View project →
Planning

Development applications

Pipeline of approved and pending DAs, joined to demographics and growth forecasts.

View project →
Livability

Eight-dimension livability index

Affluence, community, convenience, family, hip, lifestyle, safety and tranquillity, scored at mesh block.

View project →
Luke in the media

Where the work has shown up

Luke Metcalfe, founder of Microburbs and Rapid Intelligence, has been commercialising data since 1998. Selected interviews and appearances below.

YouTube, Physio Inq

Working with Luke Metcalfe, Data Scientist

Jonathon Moody from Physio Inq describes what it was like to work with Luke from Rapid Intelligence on demand mapping and market modelling.

2020
Australian Financial Review

How the Coalition vote is trending poor

Booth-level analysis from Microburbs showing the educated and high-income electorates abandoning the Coalition.

May 2022
Sydney Morning Herald

Education is why federal voting patterns are changing

Microburbs booth analysis used to explain the realignment of Australian politics by educational attainment.

June 2022
The Canberra Times

Well, we changed the government, time to change the country

Microburbs polling-booth modelling cited in post-election analysis.

May 2022
Microburbs Blog, Political

Voice referendum: who voted Yes, who voted No, and why

Booth-level analysis. Working class Labor voters voted No. The educated, rich, godless and childless voted Yes.

October 2023
The Age

Master reverse feng shui to nab a bargain

Microburbs cited on how to find undervalued properties using livability and noise data.

January 2016
Domain

Brisbane's most hipster suburbs

Microburbs Hip Score used to rank Brisbane neighbourhoods.

June 2016
YouTube, AUS Prop

How to profit from the data you are not looking at

Luke walks through how Microburbs combines council minutes, satellite imagery and street view to turn dormant data into investment edge.

August 2024
YouTube, John Manciameli

Why trust Microburbs data, and how it changes real estate

Long-form interview on data lineage, methodology and how Microburbs surfaces edge cases the major portals miss.

2024
YouTube, Data Science Sydney

What you need for a career in data science

Luke shares two decades of recruiting and building data teams at Rapid Intelligence and Microburbs.

March 2024
Podcast, The Elephant in the Room

The truth about what really makes property prices go up or down

Luke on the Elephant in the Room property podcast, covering 25 years of validated repeat-sales evidence.

Episode 16
YouTube, Property Investory

Buying in the right location for capital growth (Episode 744)

Luke on what actually drives capital growth at street and microburb level.

Episode 744
Legacy site, Rapid Intelligence

rapint.com, the original consulting site

The Microburbs consulting heritage. Rapid Intelligence was Luke's earlier vehicle, profiling regions down to 160 houses for demographics, psychographics and propensity.

Since 1998

Additional interviews and articles, including the Paul Murray Live political segment, are listed in the consulting prospectus available on request.

Heritage

From Rapid Intelligence to Microburbs

Microburbs Consulting is the latest iteration of an Australian data consulting practice that goes back to 1998. The original business, Rapid Intelligence, profiled tiny regions down to about 160 houses for demographics, psychographics and propensity. NationMaster synthesised thousands of country statistics into one comparative engine. NetComber crawled 300 million websites and identified ownership using machine learning, and was sold to a US buyer in 2014.

Microburbs is the property and place-data evolution of that body of work. Same founder, same first principle: build the data layer no one else has, then sell the answers it makes possible. The franchise territory work, political booth analytics, and behavioural CRM for chains all predate Microburbs and remain core capabilities.

Twenty-five years of data work

Each business solved a different version of the same question: who, where, and what next.

1998
Rapid Intelligence founded. Demographic and propensity profiling at 160-house resolution for franchise, retail and political clients.
2003
NationMaster launched. Synthesises thousands of country statistics into a single comparative engine.
2010
NetComber crawls 300 million websites and identifies owners by code style. Sold to US buyer in 2014.
2014
Microburbs founded. Mesh-block livability and property reports for every Australian address.
2026
Microburbs Consulting unifies the data, ML and FeatureStore behind one consulting practice.
Honest scope

What we do, and what we will not pretend to do

The fastest way to lose a procurement officer's trust is to over-claim. Our edge is predicting human decisions at address level. It is not measuring physical infrastructure or running clinical trials. The line below stays clean on every brief.

What we lead

  • Address-level prediction of any binary or continuous human decision
  • Microburb-level place-based mapping and vulnerability indices
  • Site selection and demand forecasting at mesh block resolution
  • AVM, capital-growth and rental forecasting defensible to regulators
  • Civic intelligence, council minutes NLP, rezoning probability
  • Computer vision on street-view and satellite
  • Whitepapers, methodology disclosures and tender writing

What we partner on or decline

  • We do not build hardware, charging stations, solar farms or sensor networks
  • We do not run clinical research with primary patient data or randomised trials
  • We do not lead place-based service delivery, we feed the providers who do
  • We do not publicly market politically targeted analytics work, regardless of capability
  • We do not claim health-domain expertise on cohorts where we have not built and validated a model
Luke Metcalfe
Luke Metcalfe
FOUNDER · DATA SCIENTIST · MICROBURBS

Commercialising data since 1998. Founder of Rapid Intelligence, NationMaster and NetComber (sold 2014). Builds the data layer first, then sells the answers it makes possible. Available for direct consulting on briefs where address-level resolution actually moves the answer.

Tell us the question. We will tell you whether the data already exists.

Most consulting briefs we see can be answered in part within a week, because the underlying data is already in our FeatureStore. The first call is free. No pitch, just a working conversation.