
What Is This Home Really Worth?
See your home lined up against genuinely similar recent sales, matched on dozens of features, not just bed and bath, so you can see exactly what makes one home worth more than another. Built for every home in Australia.
See the comparable-sales estimate for any home in Australia

The question every buyer asks
You find a home you like. The agent quotes a price. A property portal shows a wide range. How do you know if that price is fair, or if you are about to overpay by a hundred thousand dollars?
The usual answer is to look at recent sales of similar homes nearby. The catch is that most tools match homes on little more than the number of bedrooms and bathrooms. That puts a freshly renovated home next to a tired one on the same street and calls them the same. They are not.
See why bedroom-and-bathroom comparisons fall short →
What a real comparison looks like
This is a comparison, not just a single number. We line a home up against genuinely similar recent sales, check that they really do look alike, and show which features match and which explain the price difference. Our comparison reads dozens of things about a home, the pool, the views, the renovation, the garage, the aspect, the street, not just how many bedrooms it has.
Here is how that works, shown for two real Penrith homes a buyer would weigh against each other. The features pulled into the middle are shared, so the homes are genuinely comparable. The ones on the right are what lifts the dearer home's price.
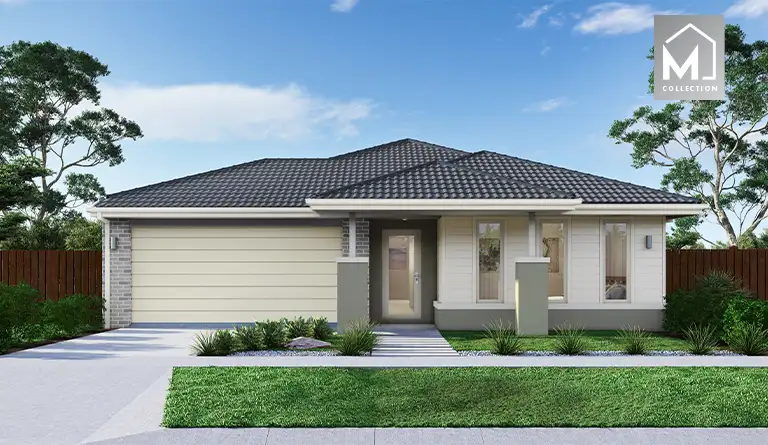
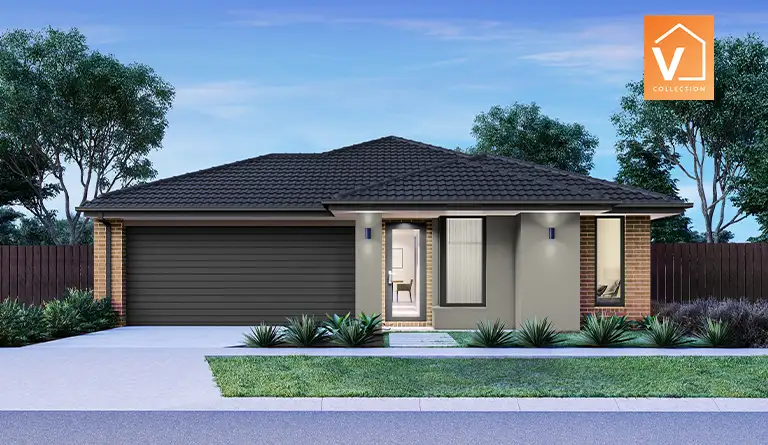
Near-identical homes in Tarneit, VIC (Melbourne)
The easy case first. Same look, same suburb, same four-bedroom single-storey design. We line up the actual photos to confirm they really are alike, then let the features explain the price.
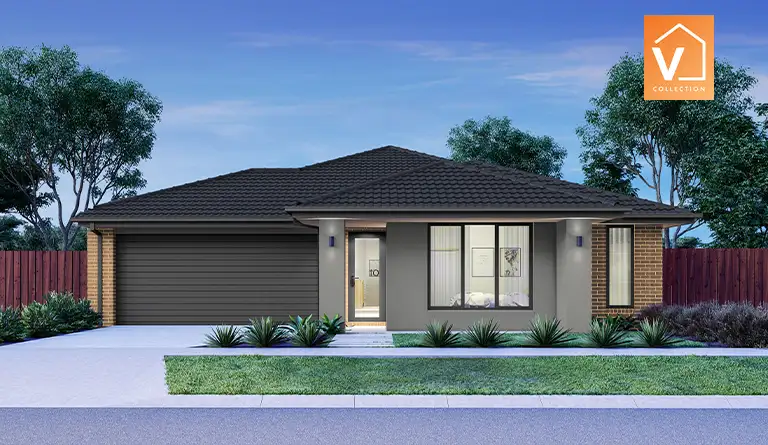
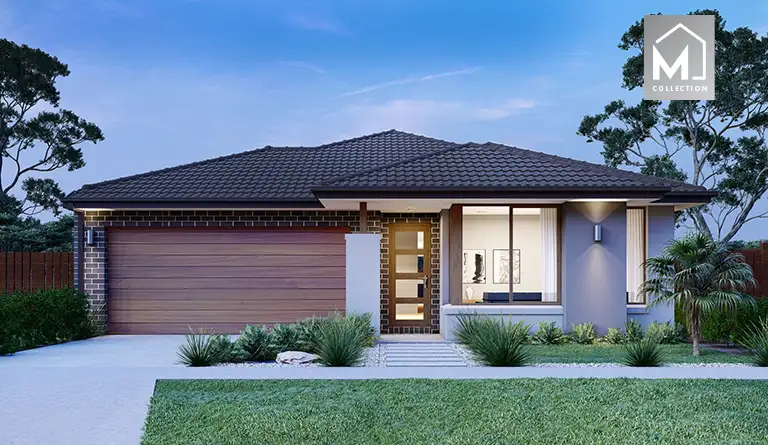
What they share:
What moves the price: the floor area. The $101,000 between the cheapest and the dearest tracks the home growing from 185 to 256 square metres, not the street it is on.
Similar, but not the same, in Penrith, NSW (Sydney)
The realistic case, and the one that actually helps. Same kind of home, photographed the same way: single-storey brick, lawn to the street. Not one design repeated, three genuinely different houses a buyer would weigh against each other.
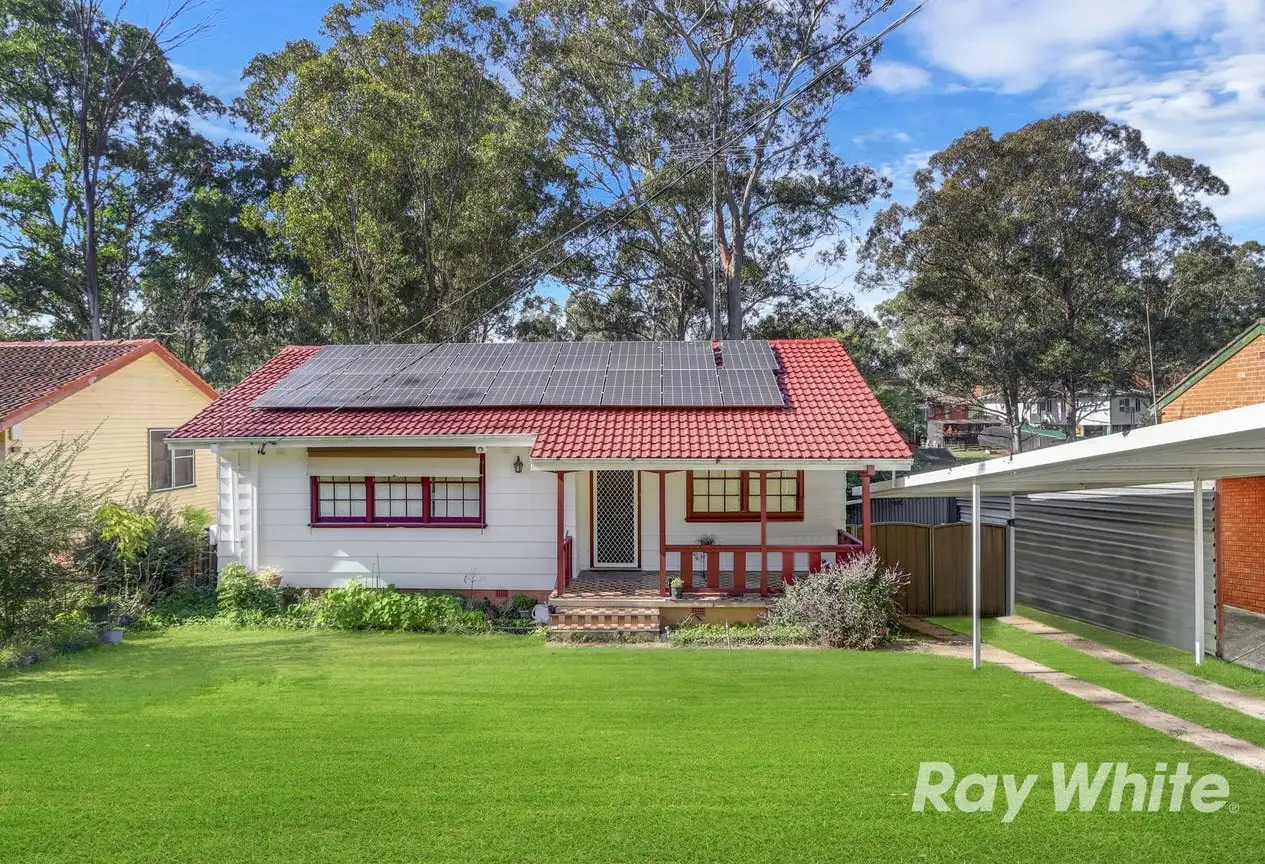
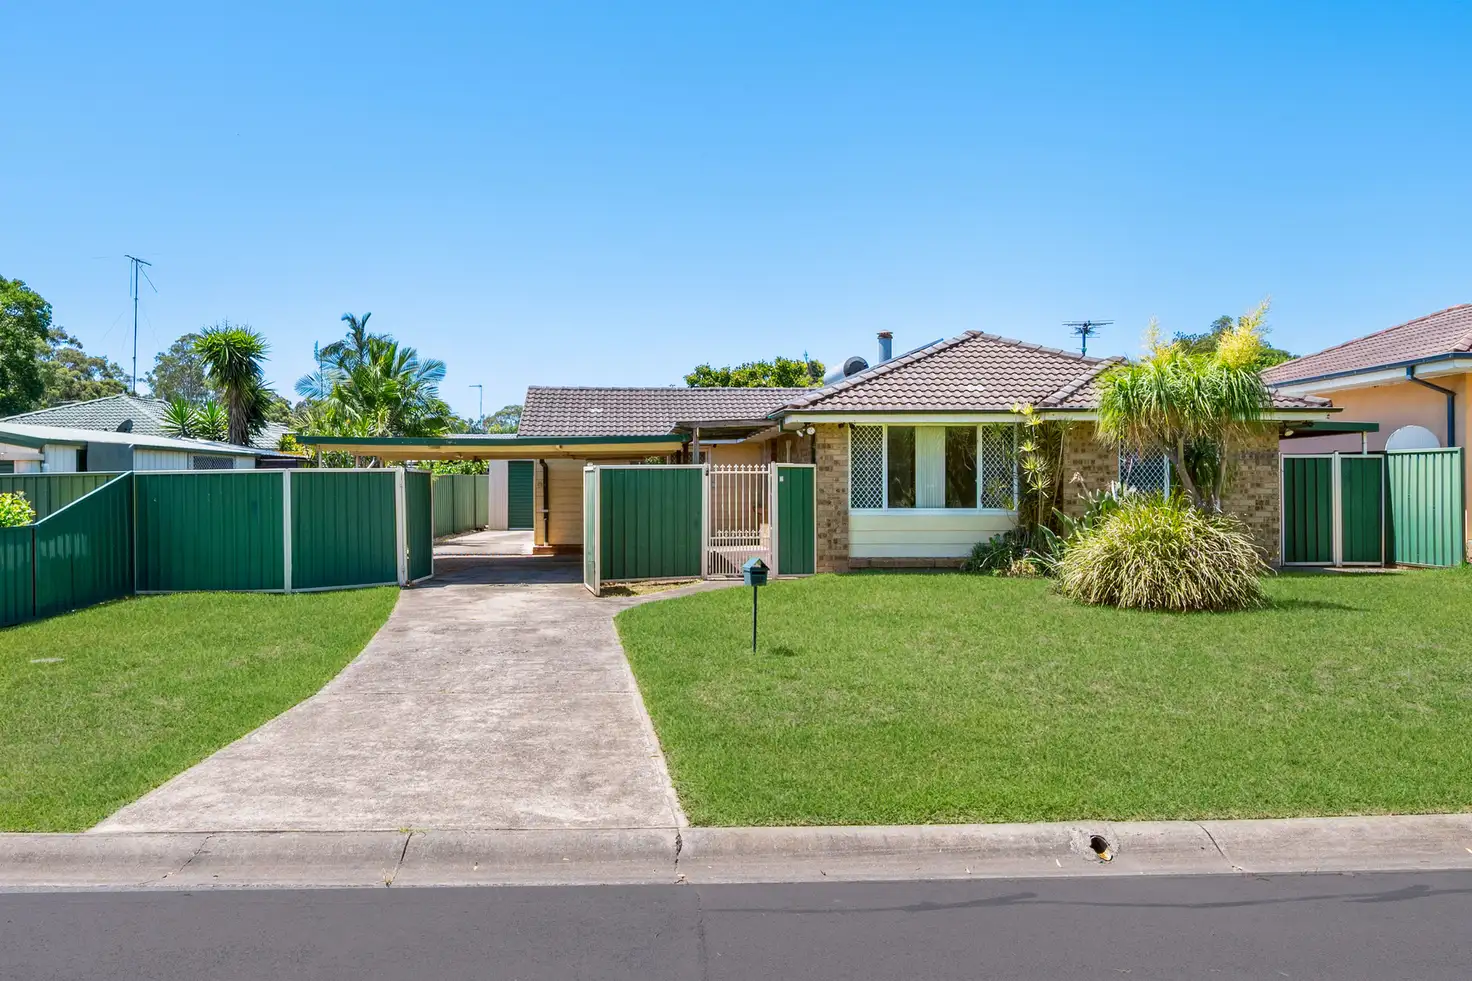
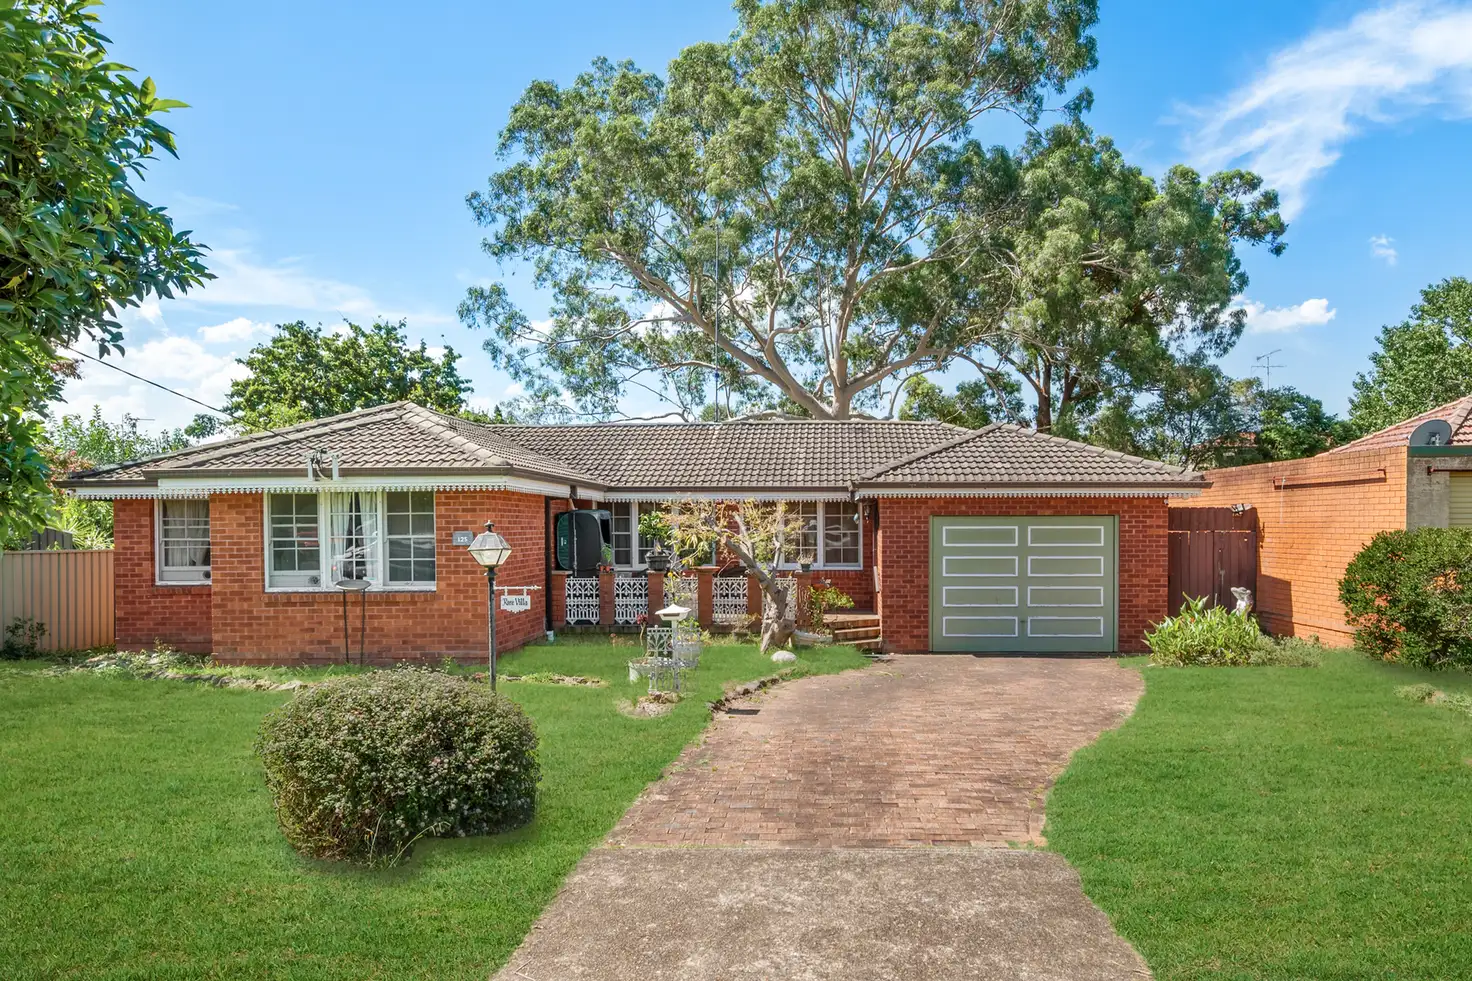
What they share:
What moves the price: the second bathroom and the extra space. The single-bathroom homes sit near $990,000; the four-bedroom, two-bathroom home on the bigger block reaches $1,279,000. The street-front look is the same, the layout inside is not.
The comparison goes deeper than the photo. On a higher-end home it lines up every individual feature, so you can see exactly what the premium pays for:
Two genuinely comparable homes in St Ives, Sydney, Upper North Shore
21 features they share, far more than bed and bath. That overlap is what makes them genuinely comparable:
What explains the $940,000 gap: 9 Monterey adds an extra bathroom, brand-new build quality and premium finishes, on top of CCTV, a balcony and a teen retreat. The comparison shows exactly what the higher price buys.
See the full set of features the comparison weighs →
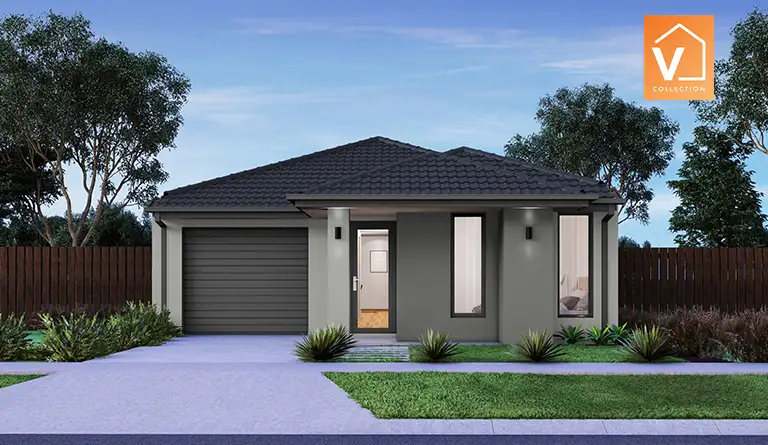
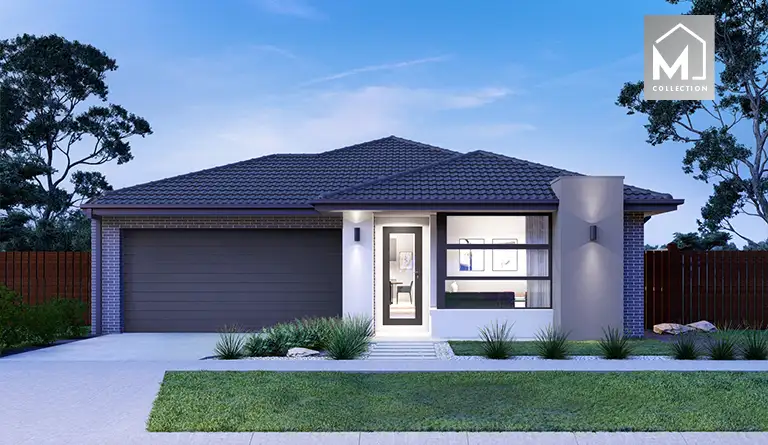
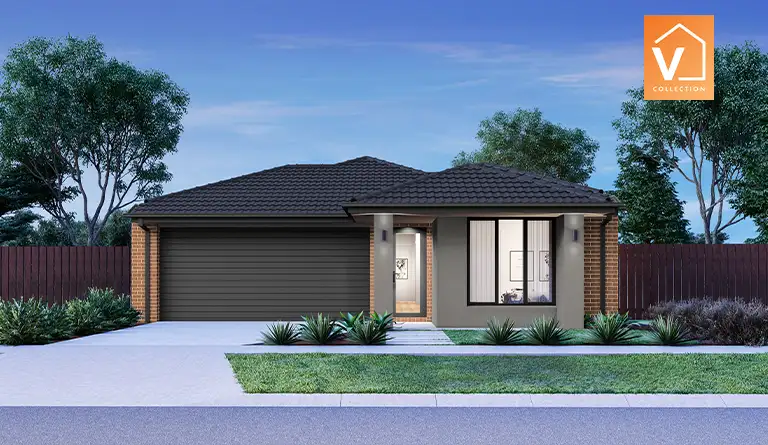
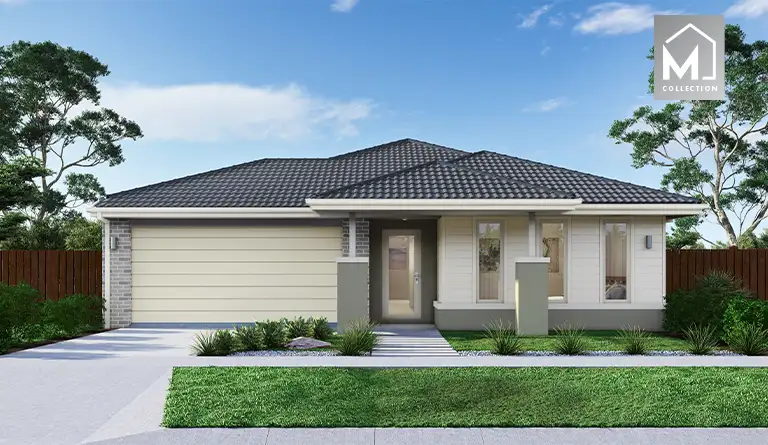
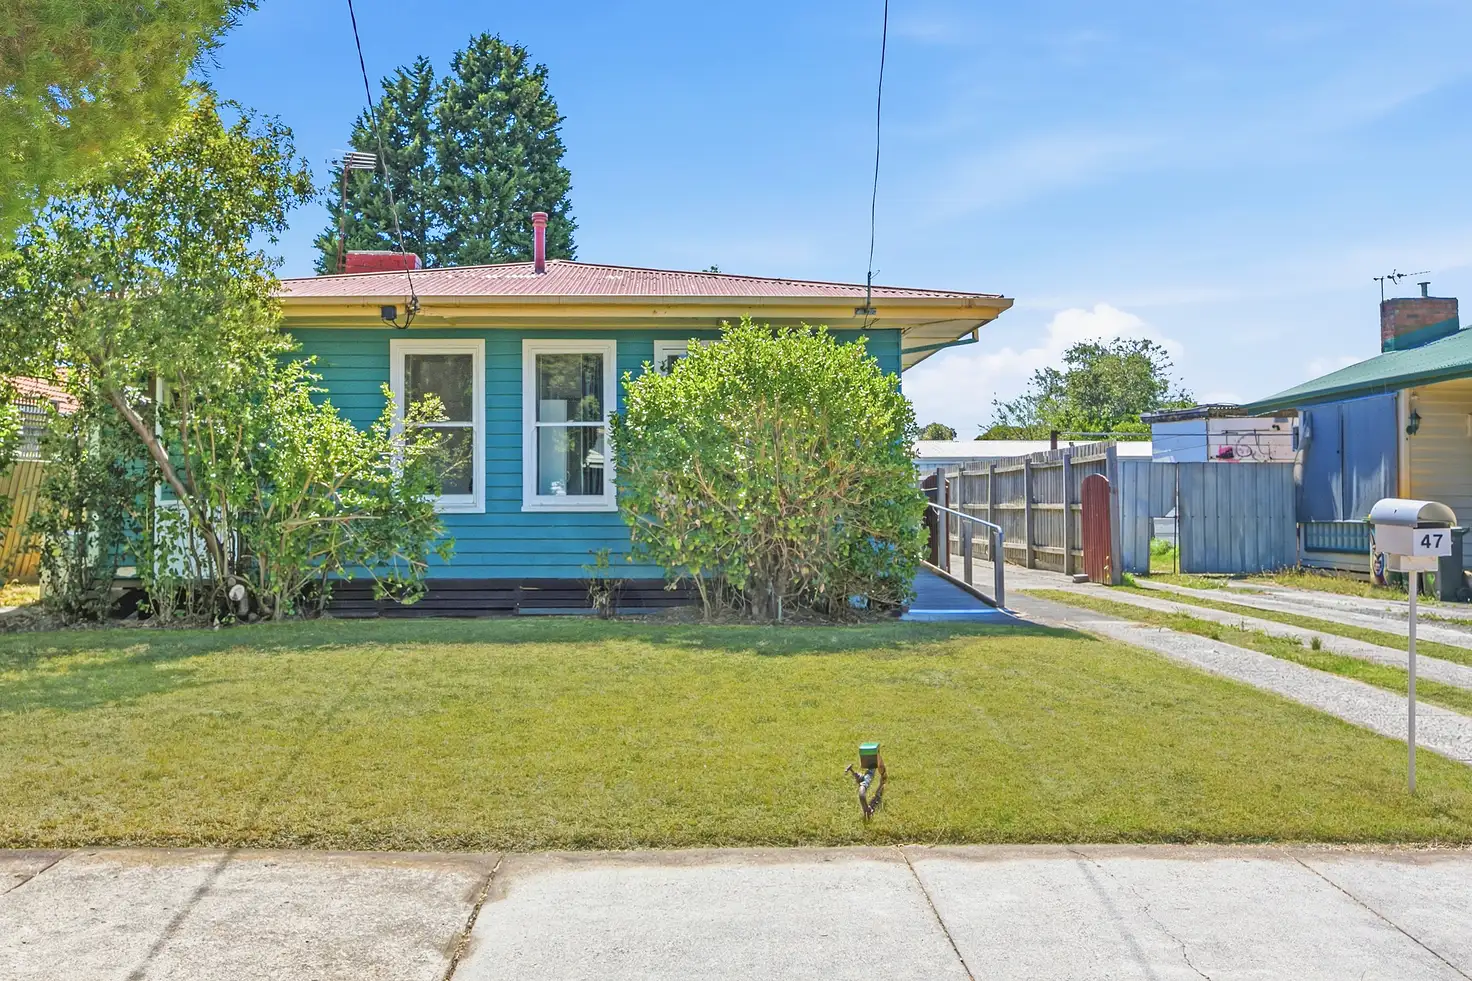
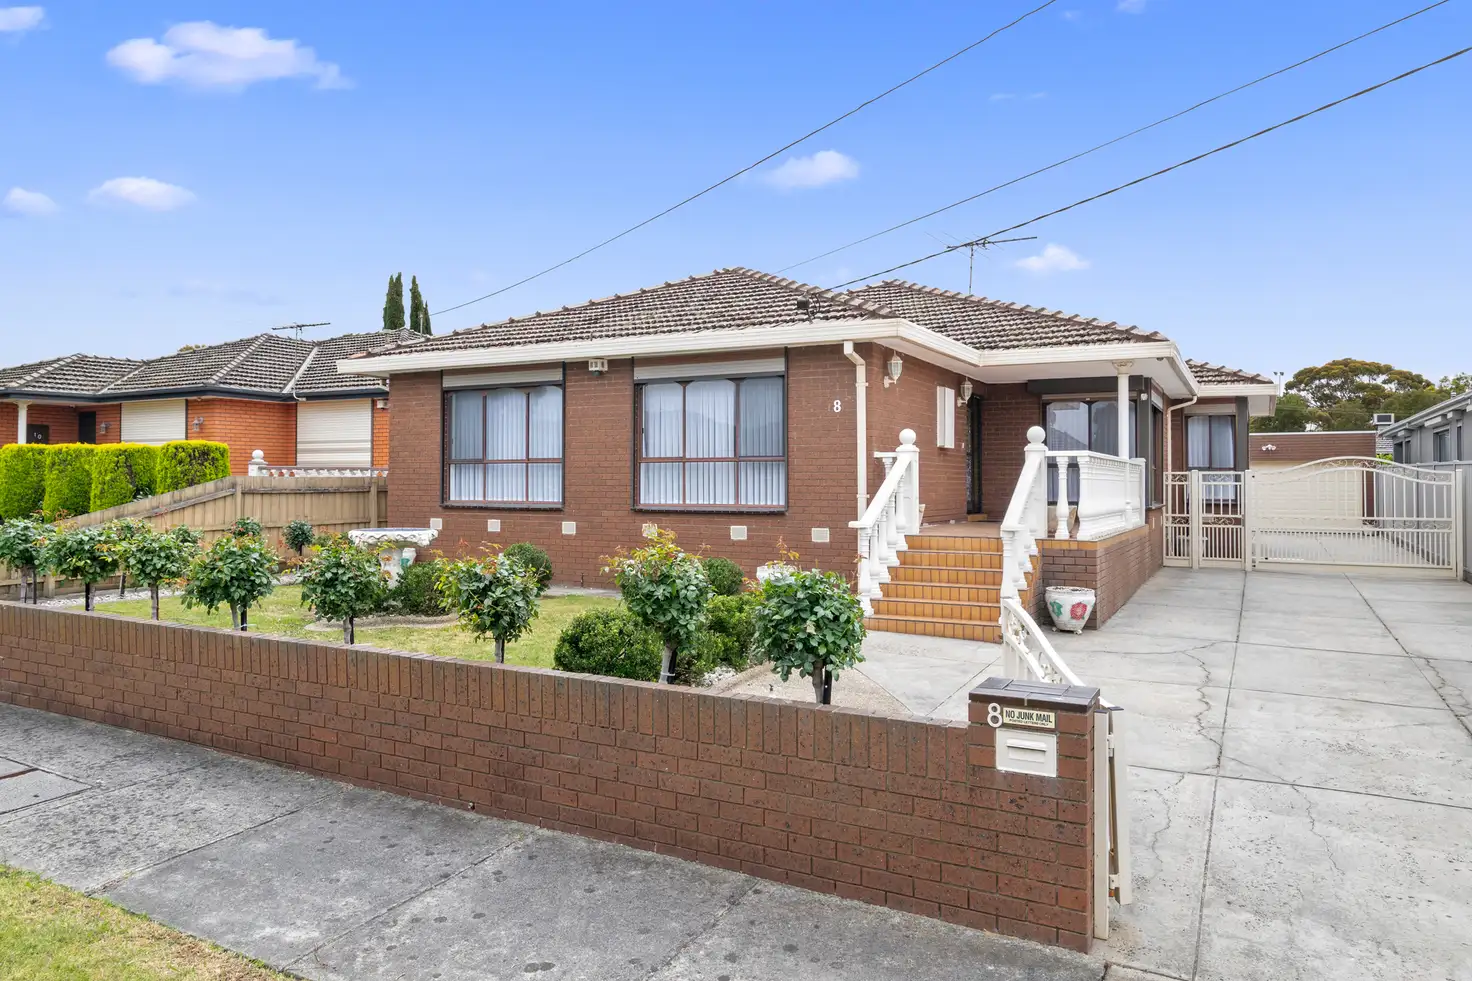
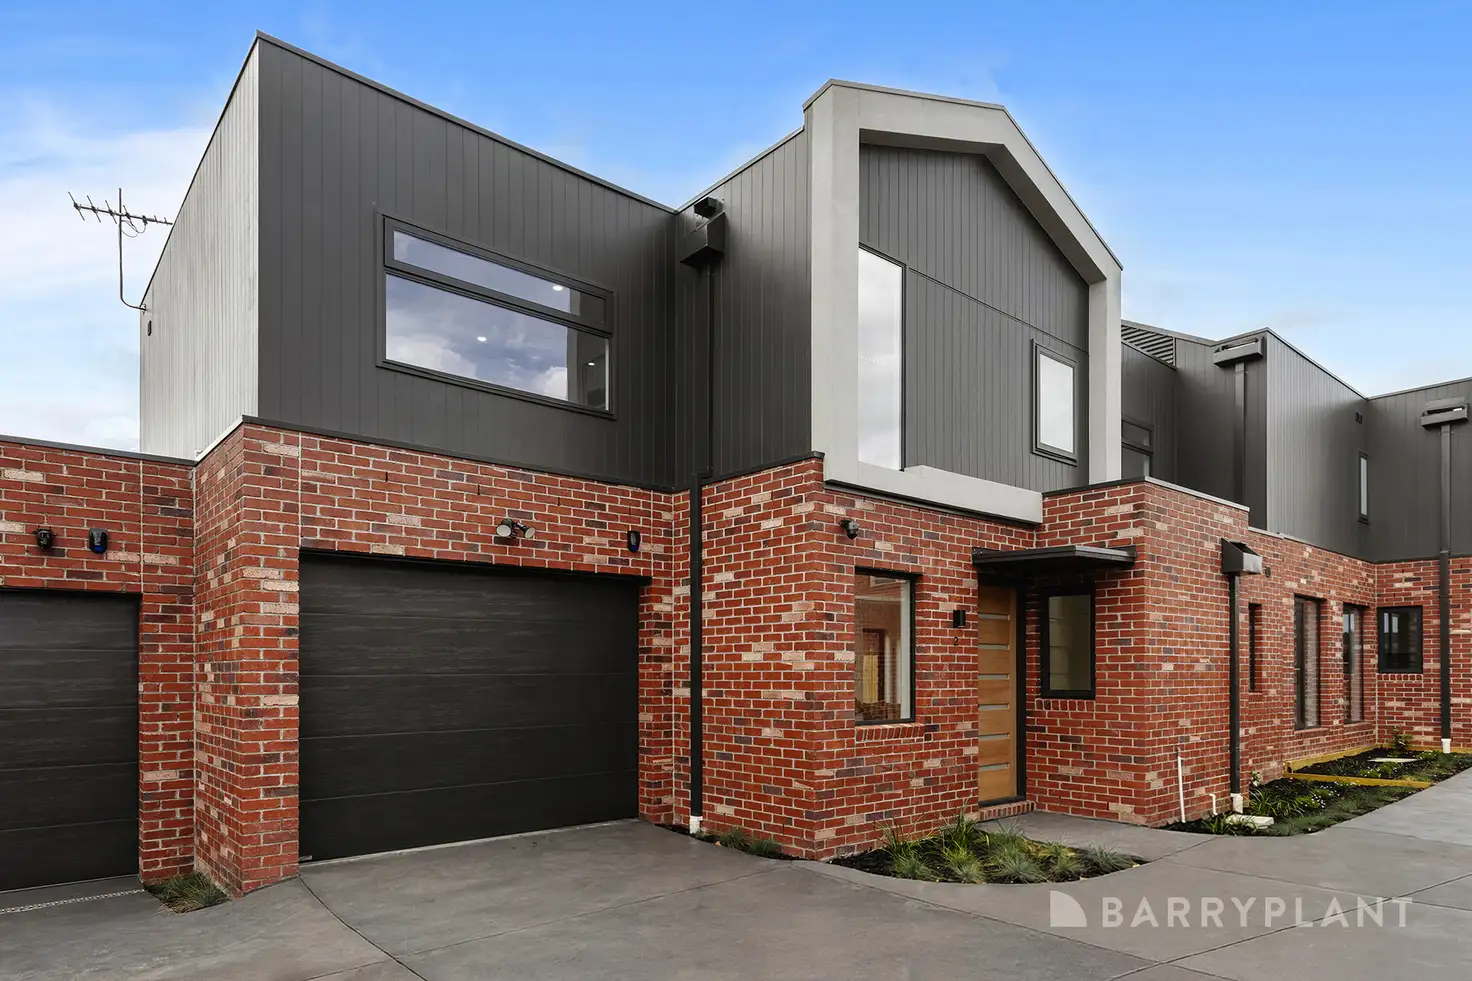
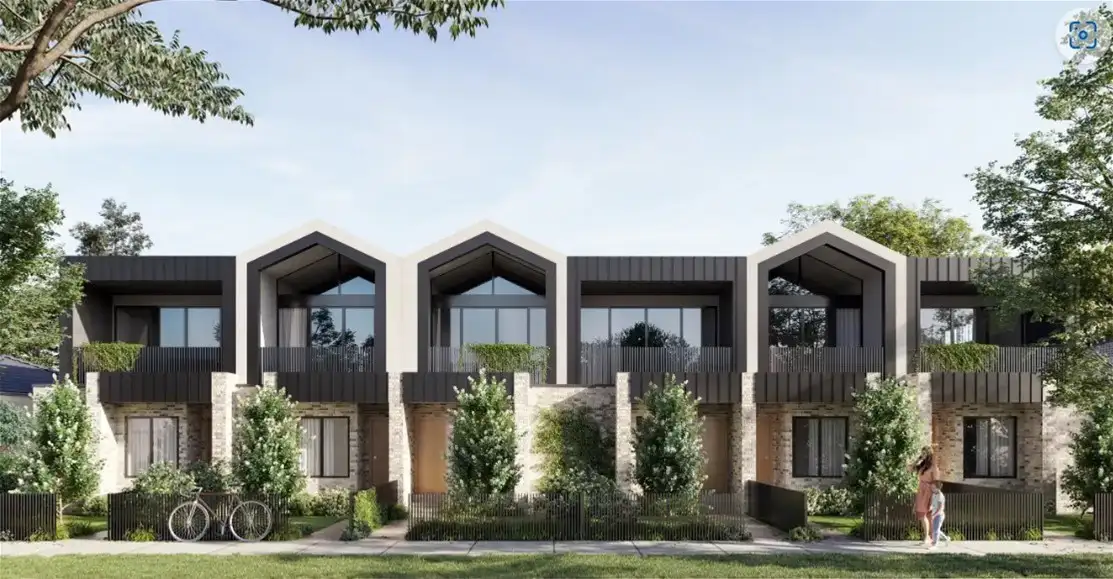
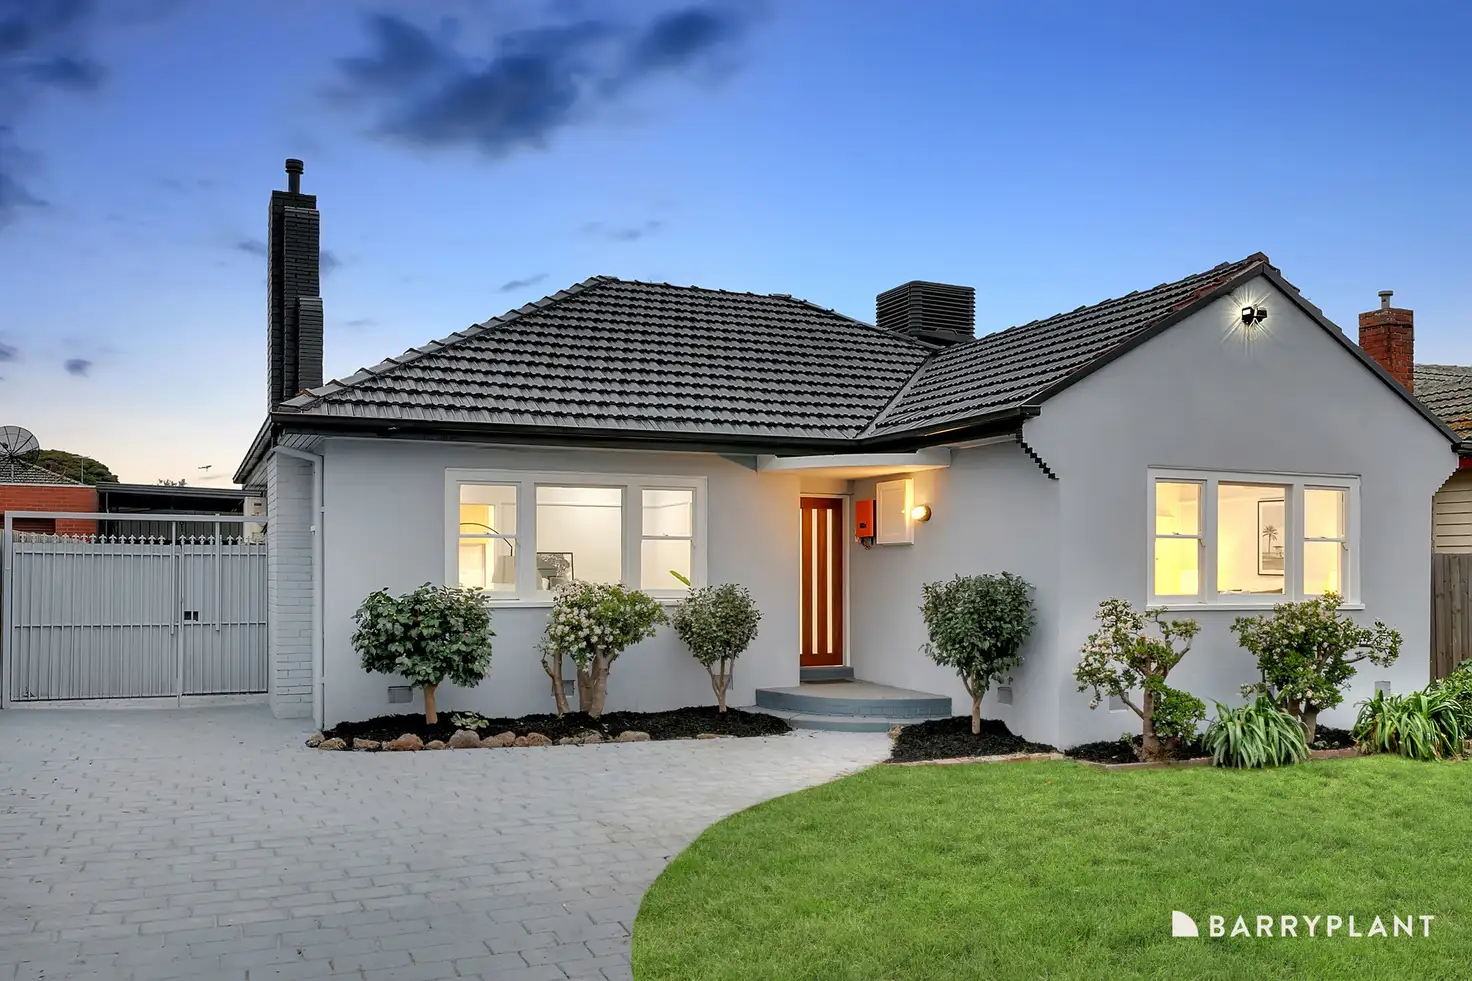
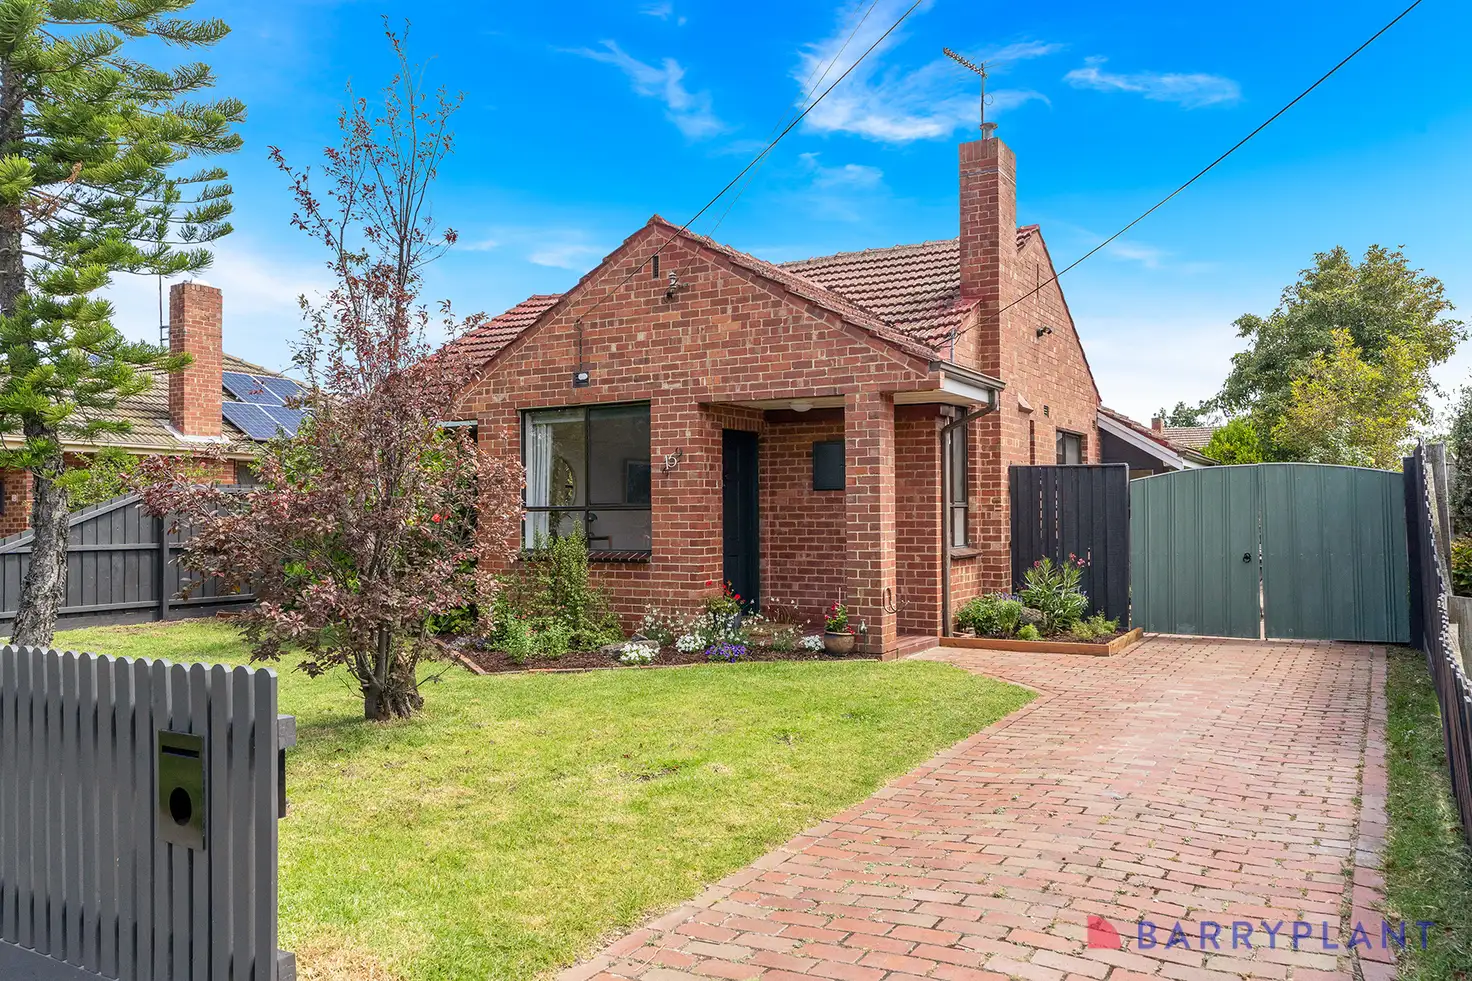
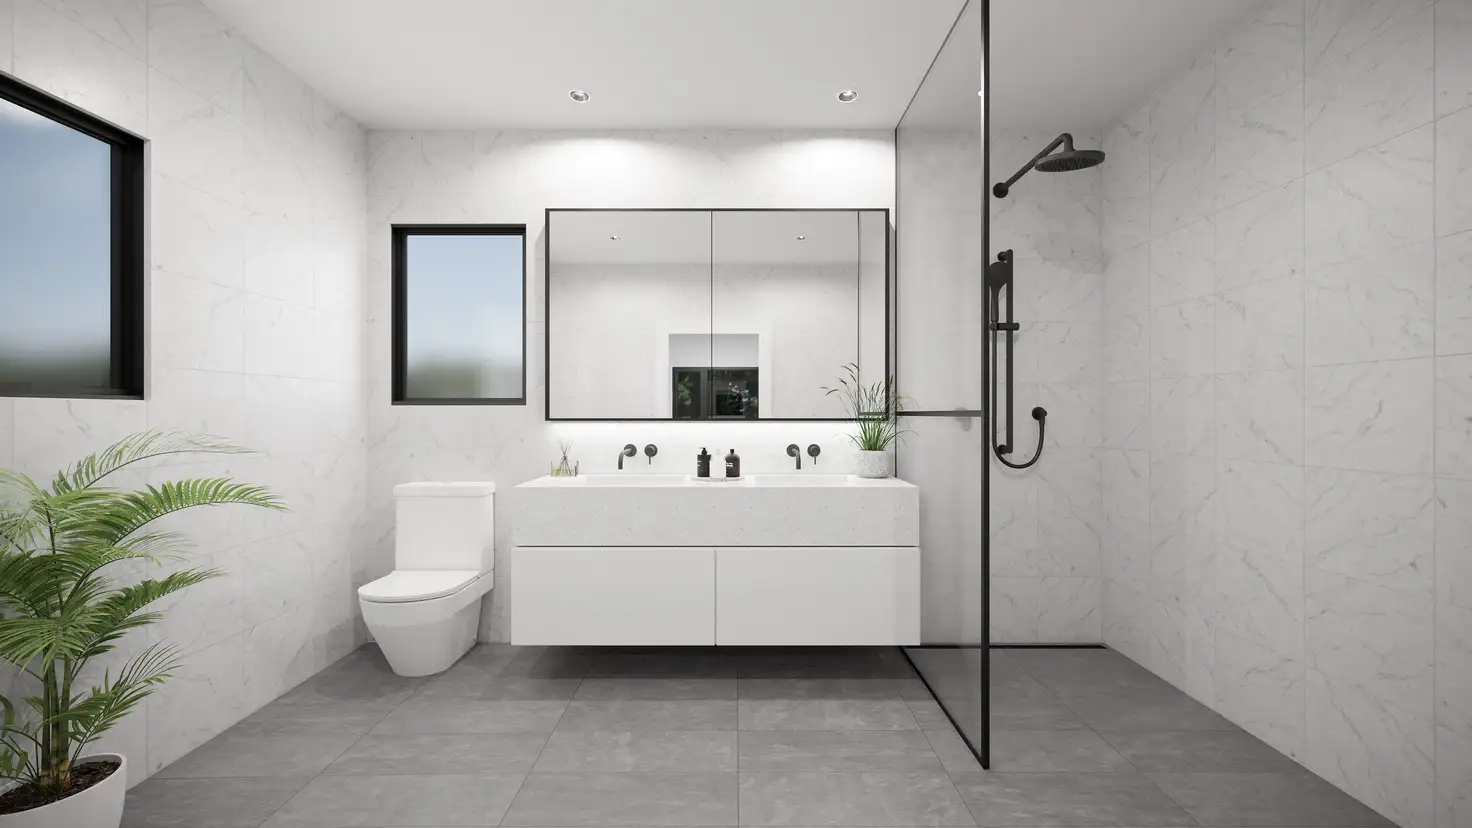
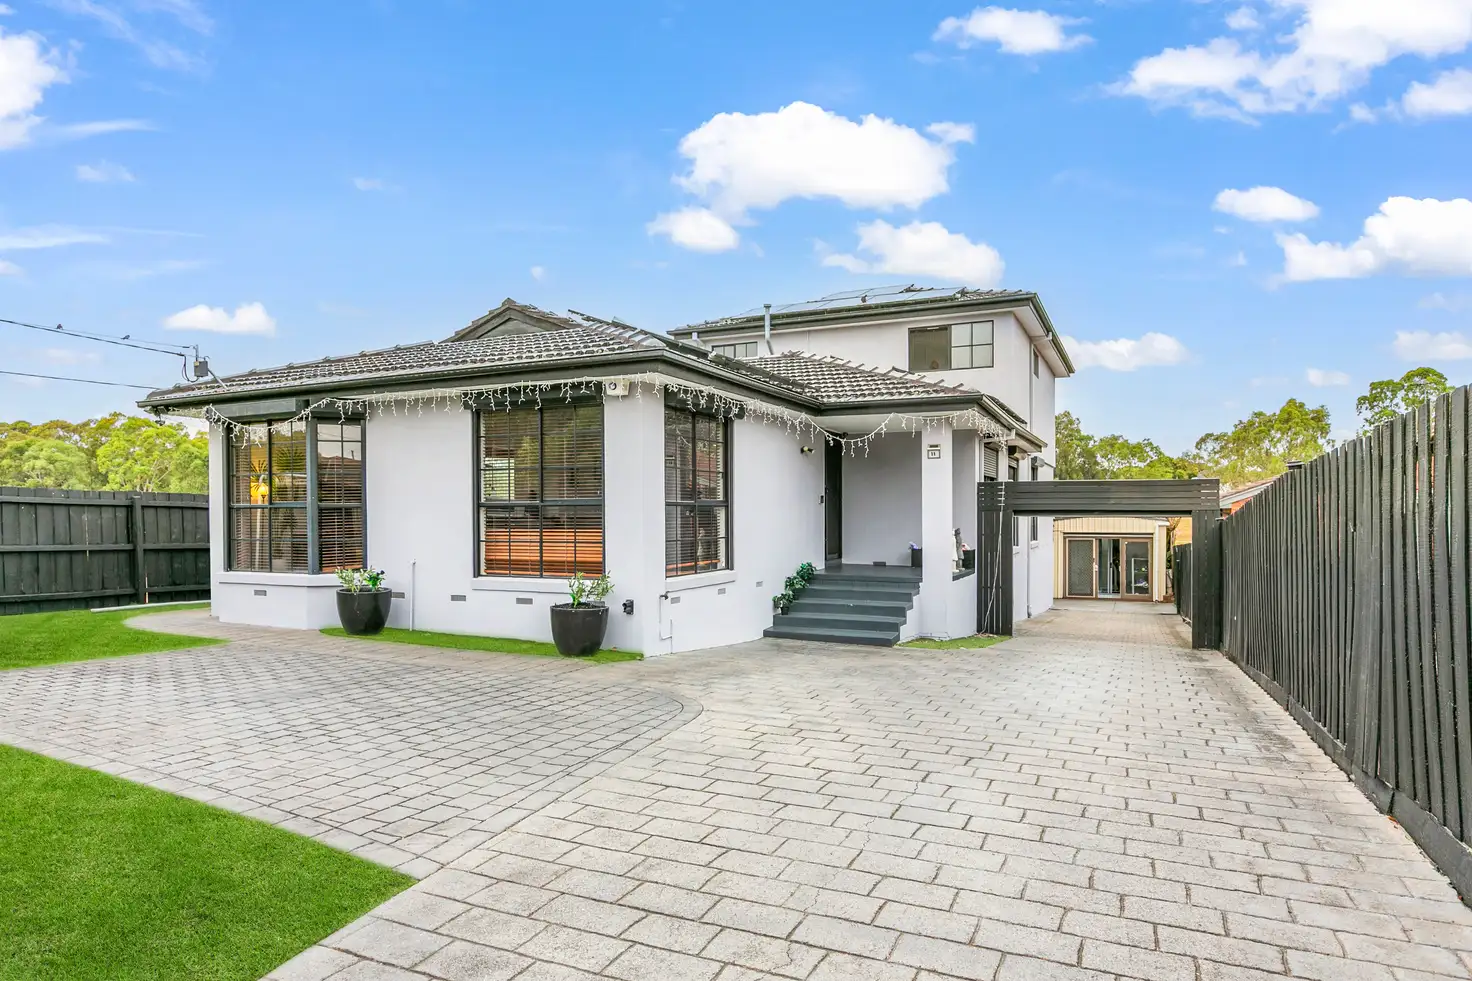
A few of the homes behind the comparisons
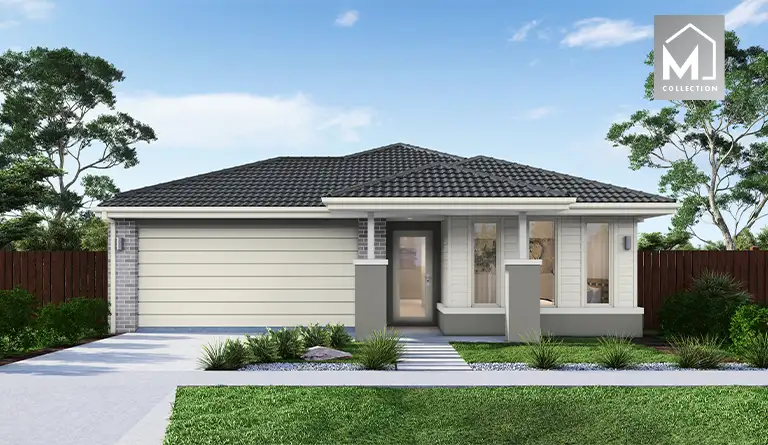
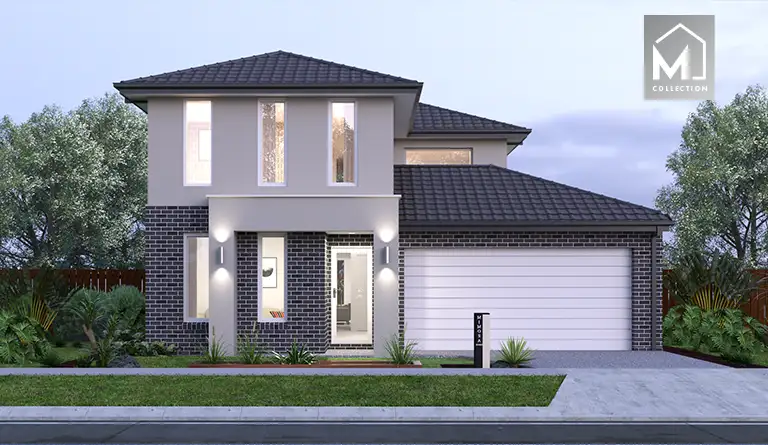
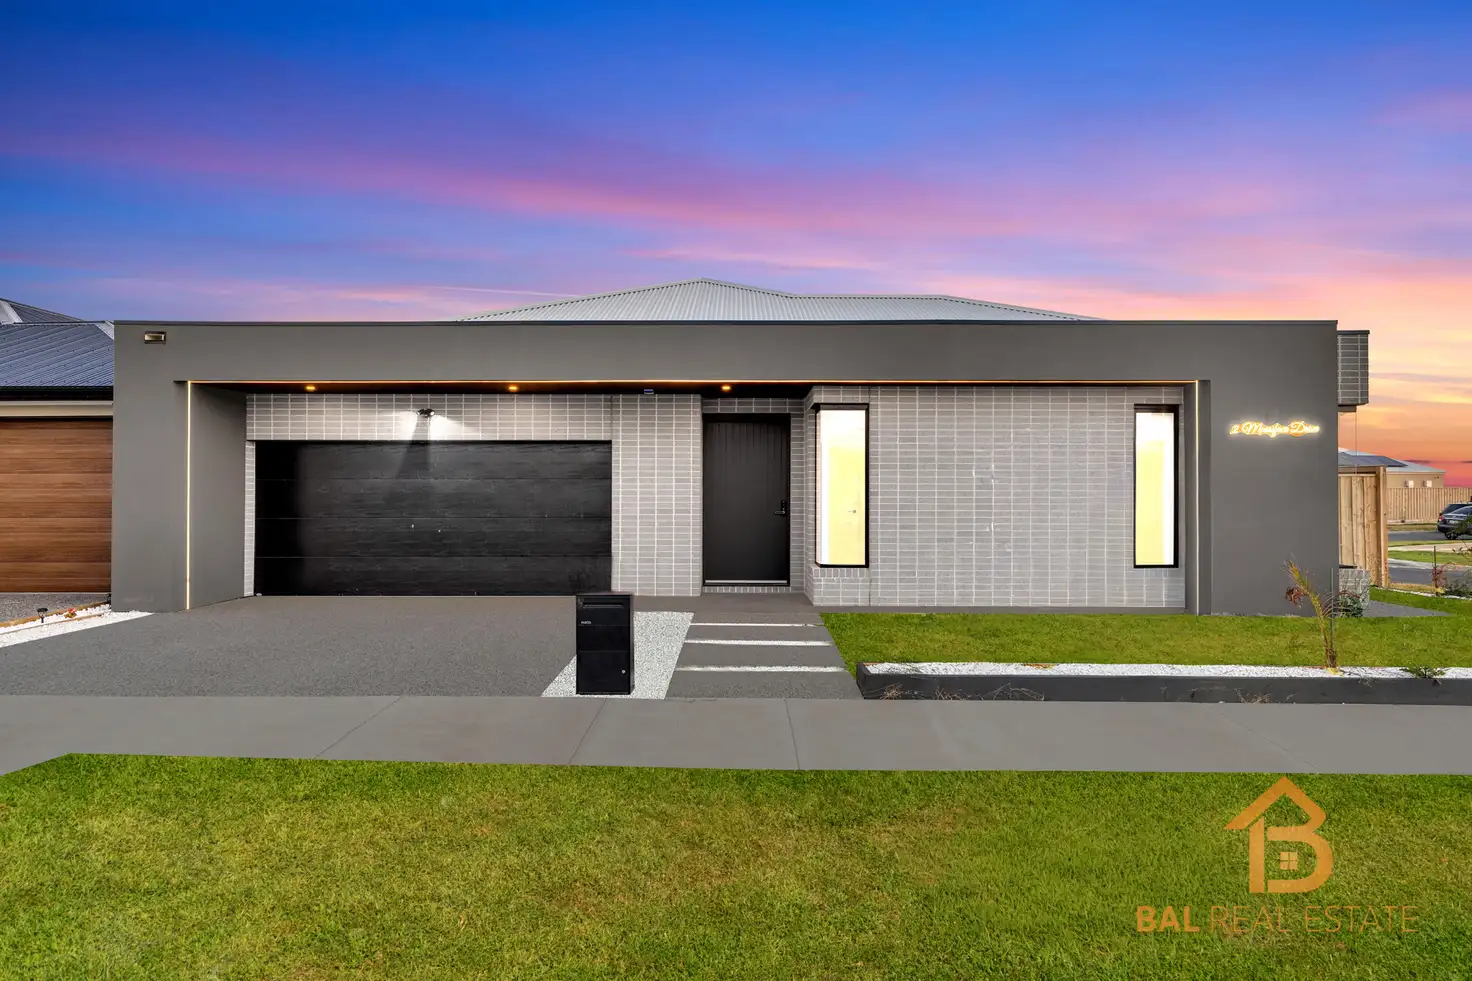
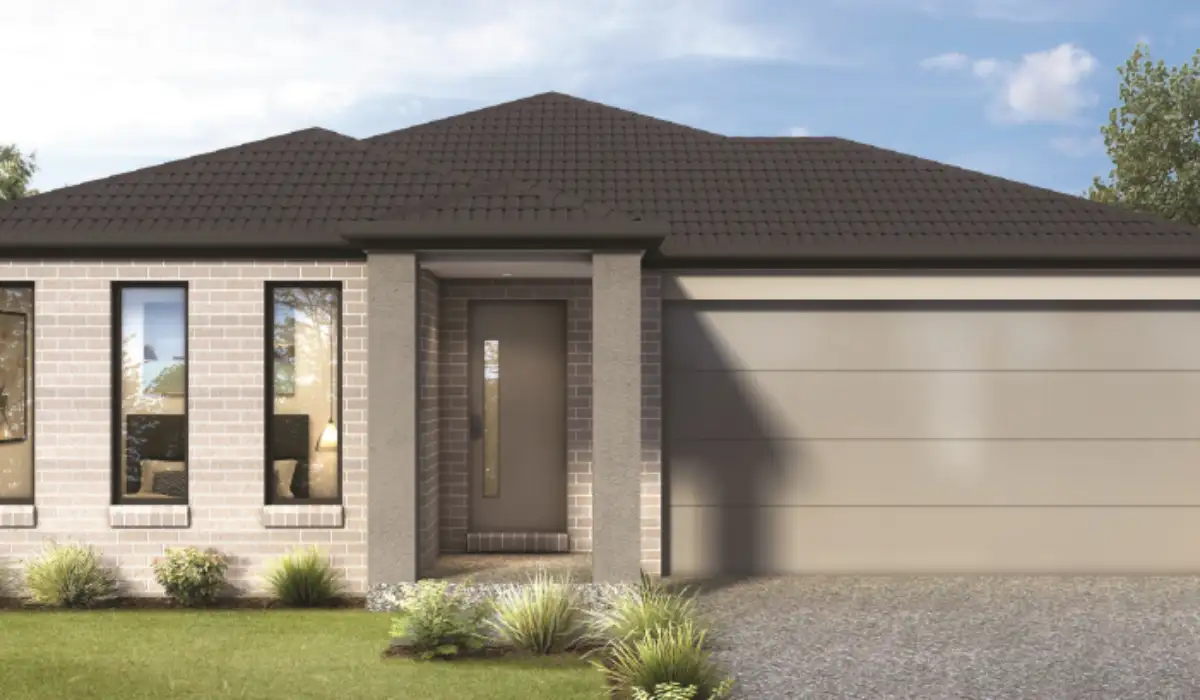
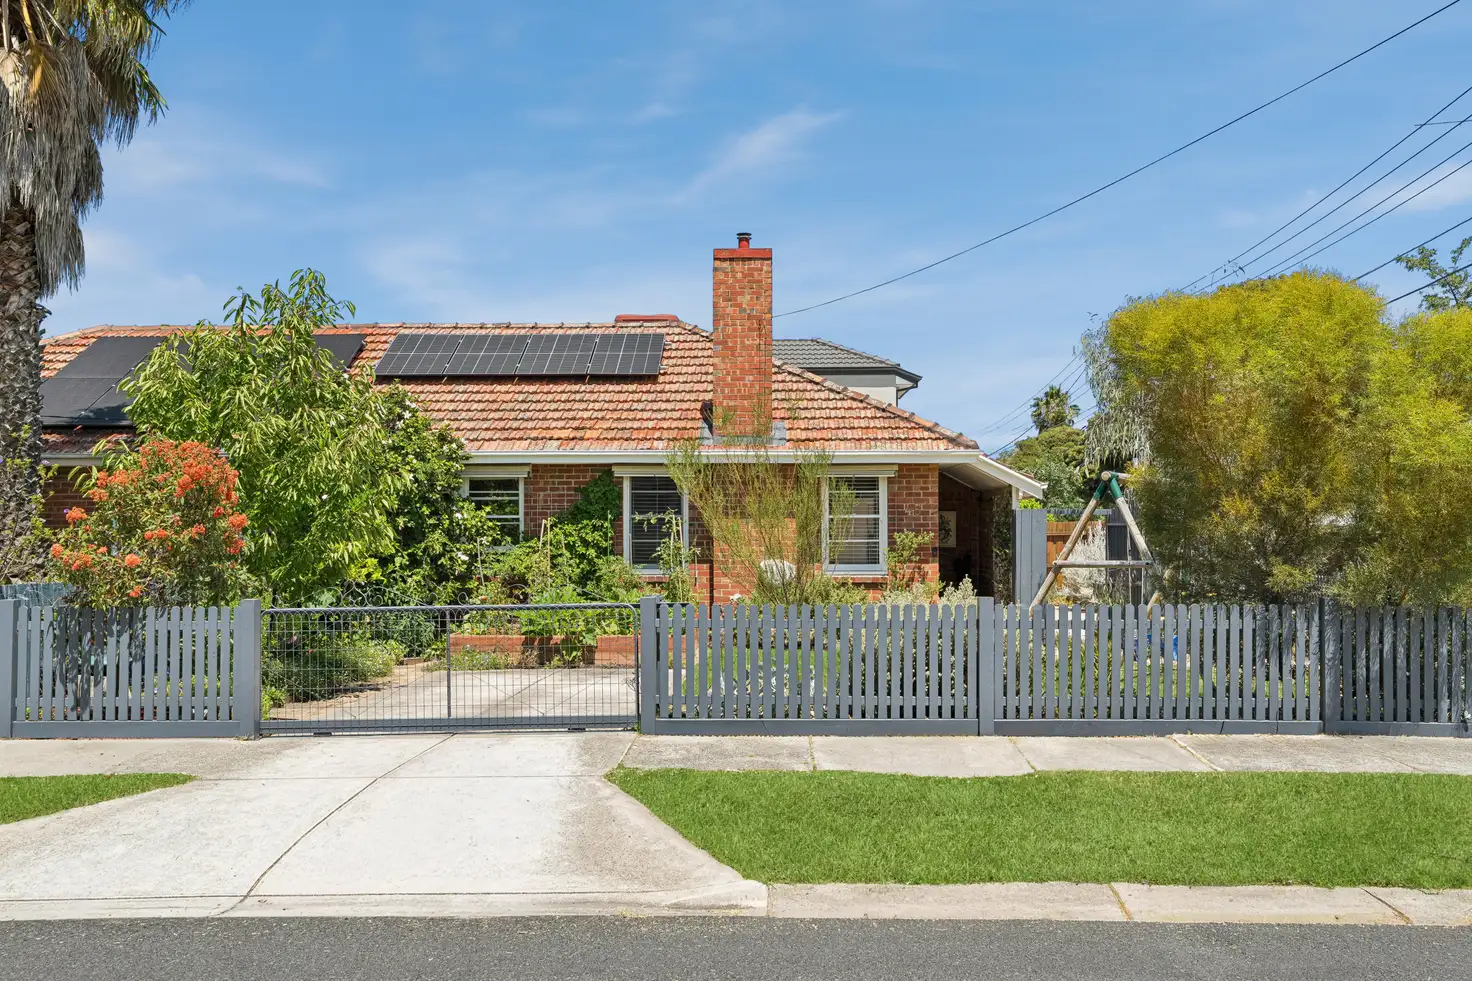
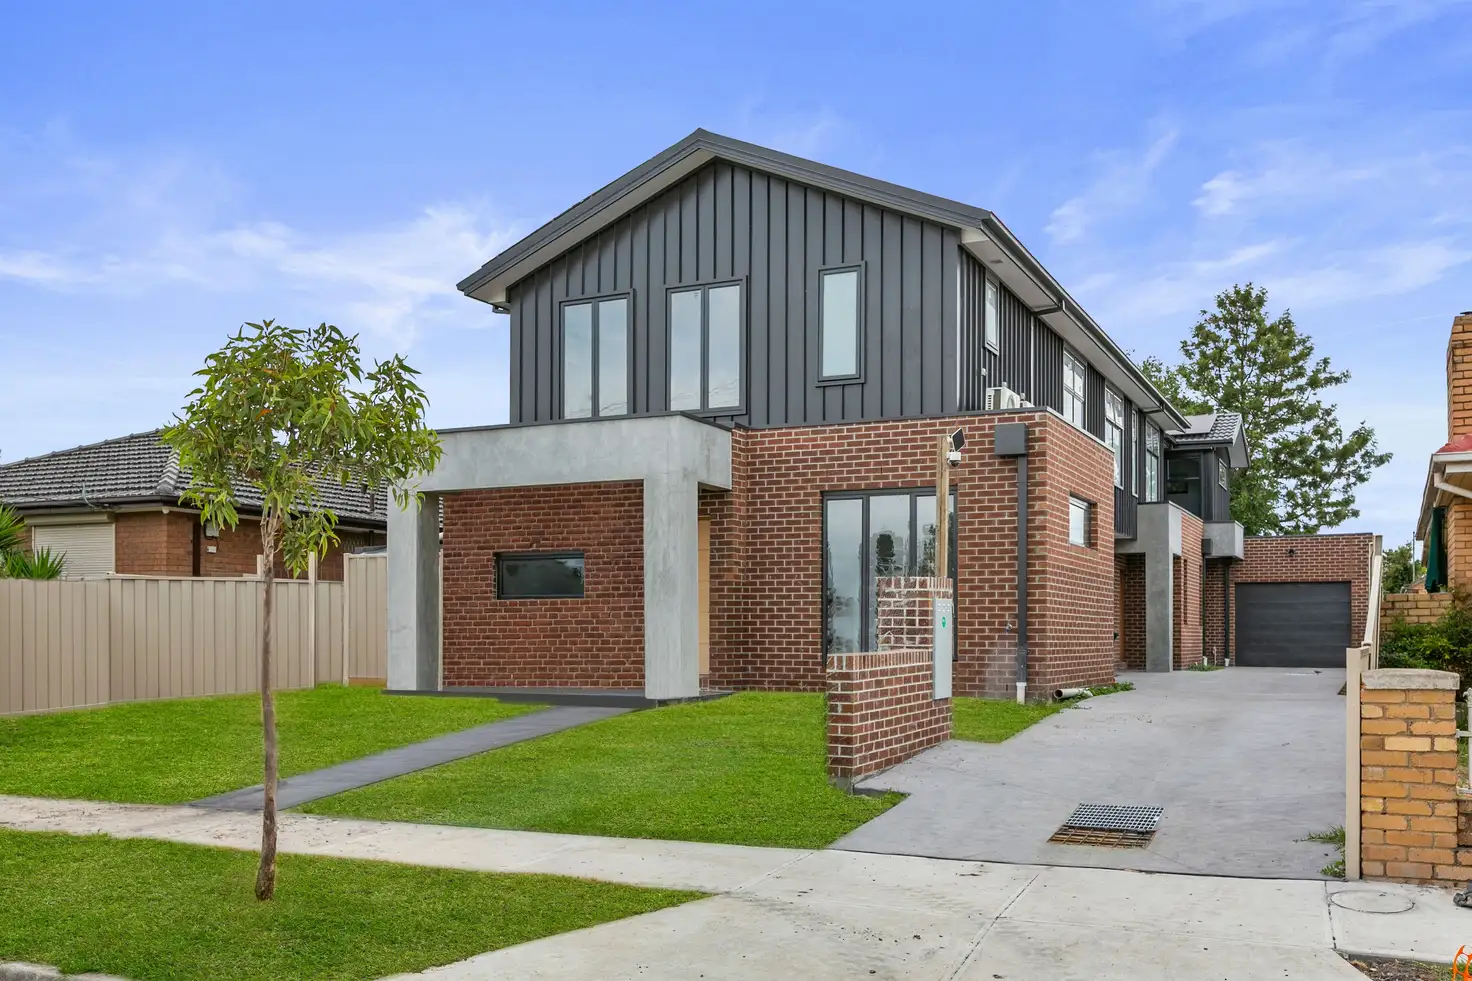
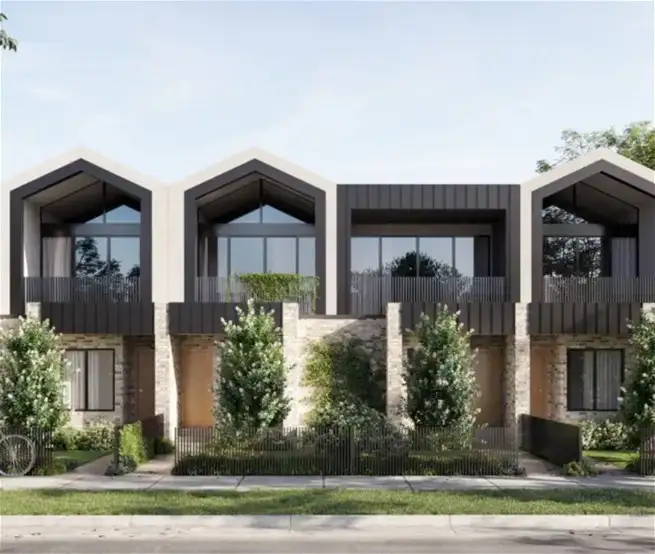
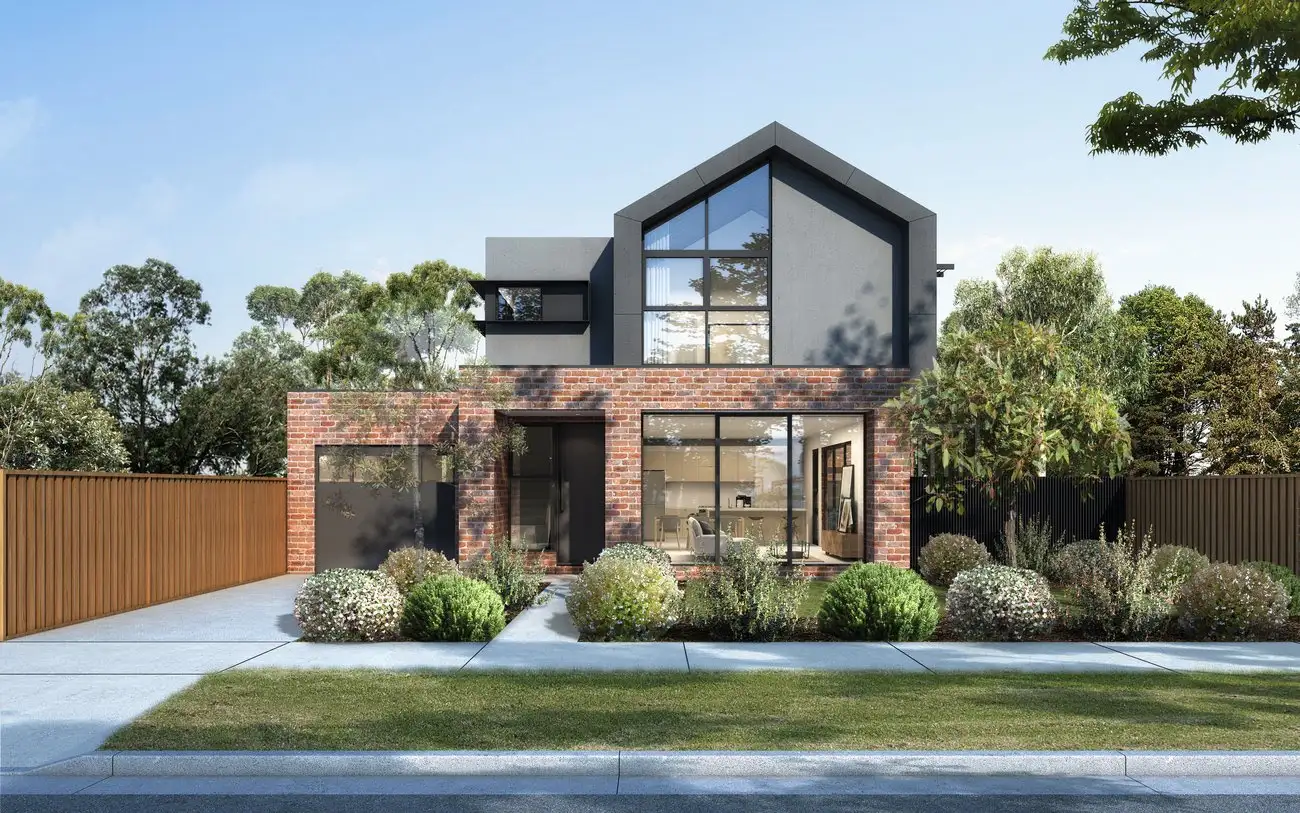
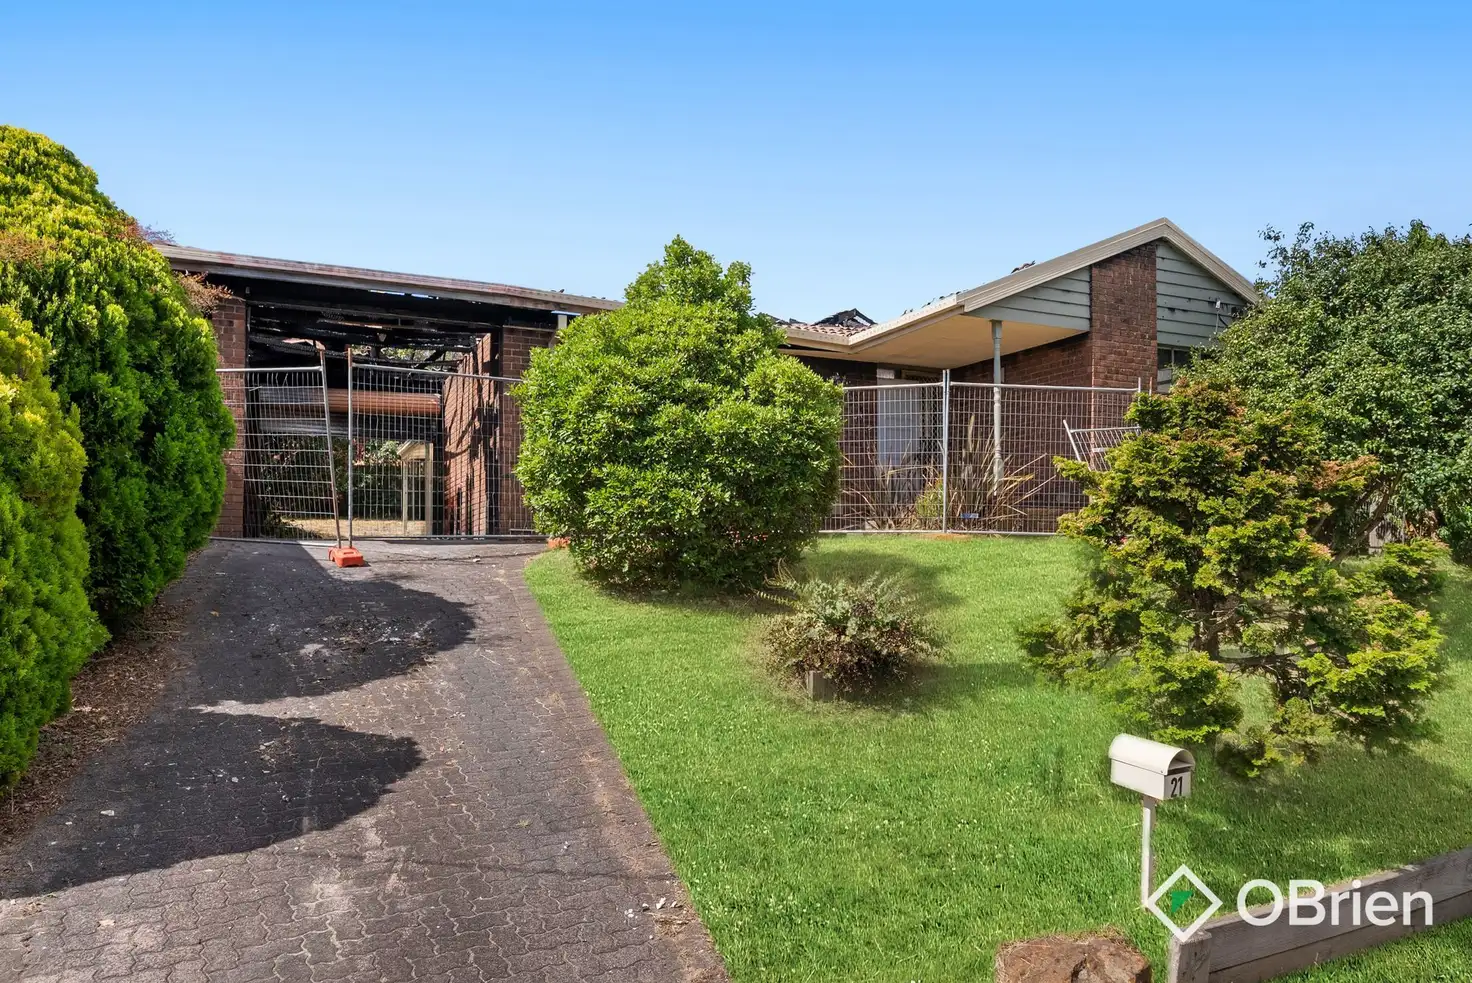
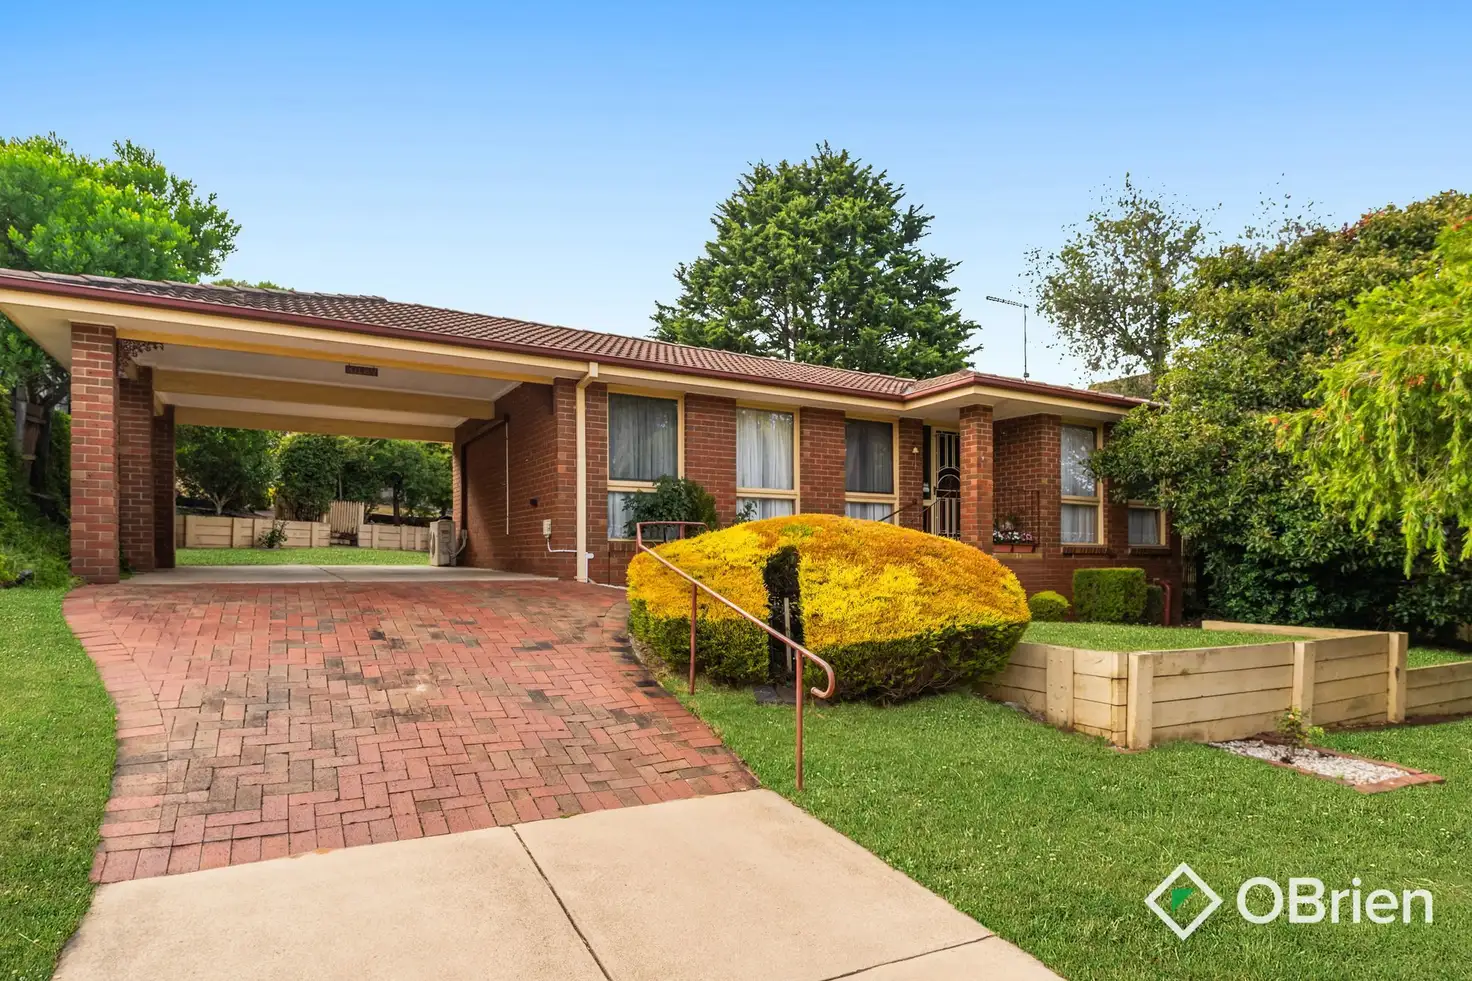
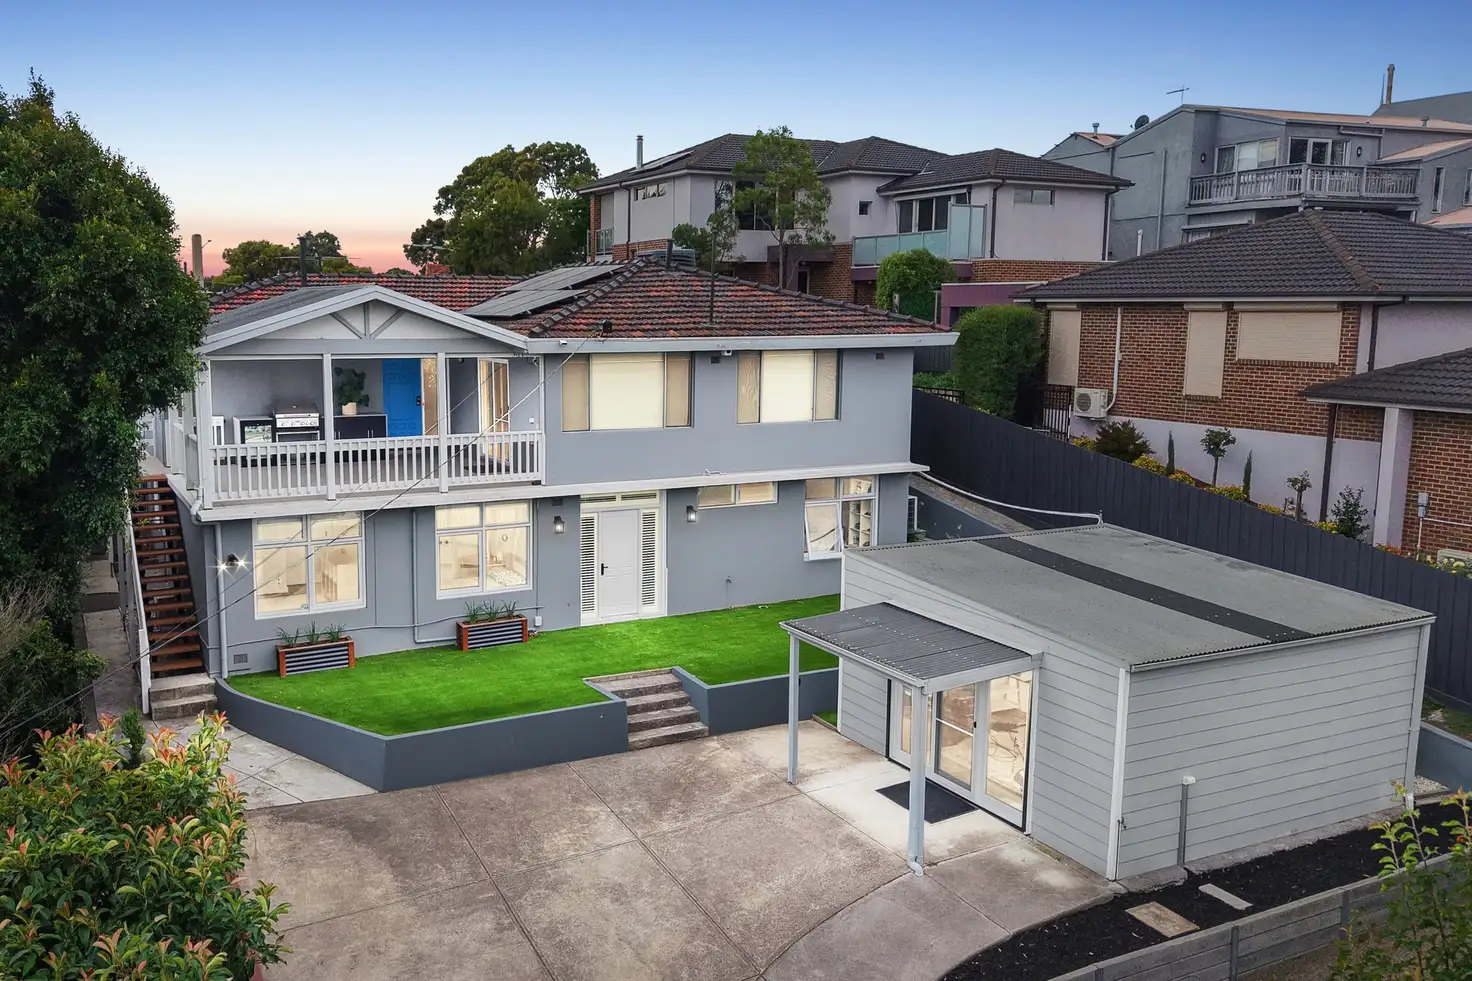
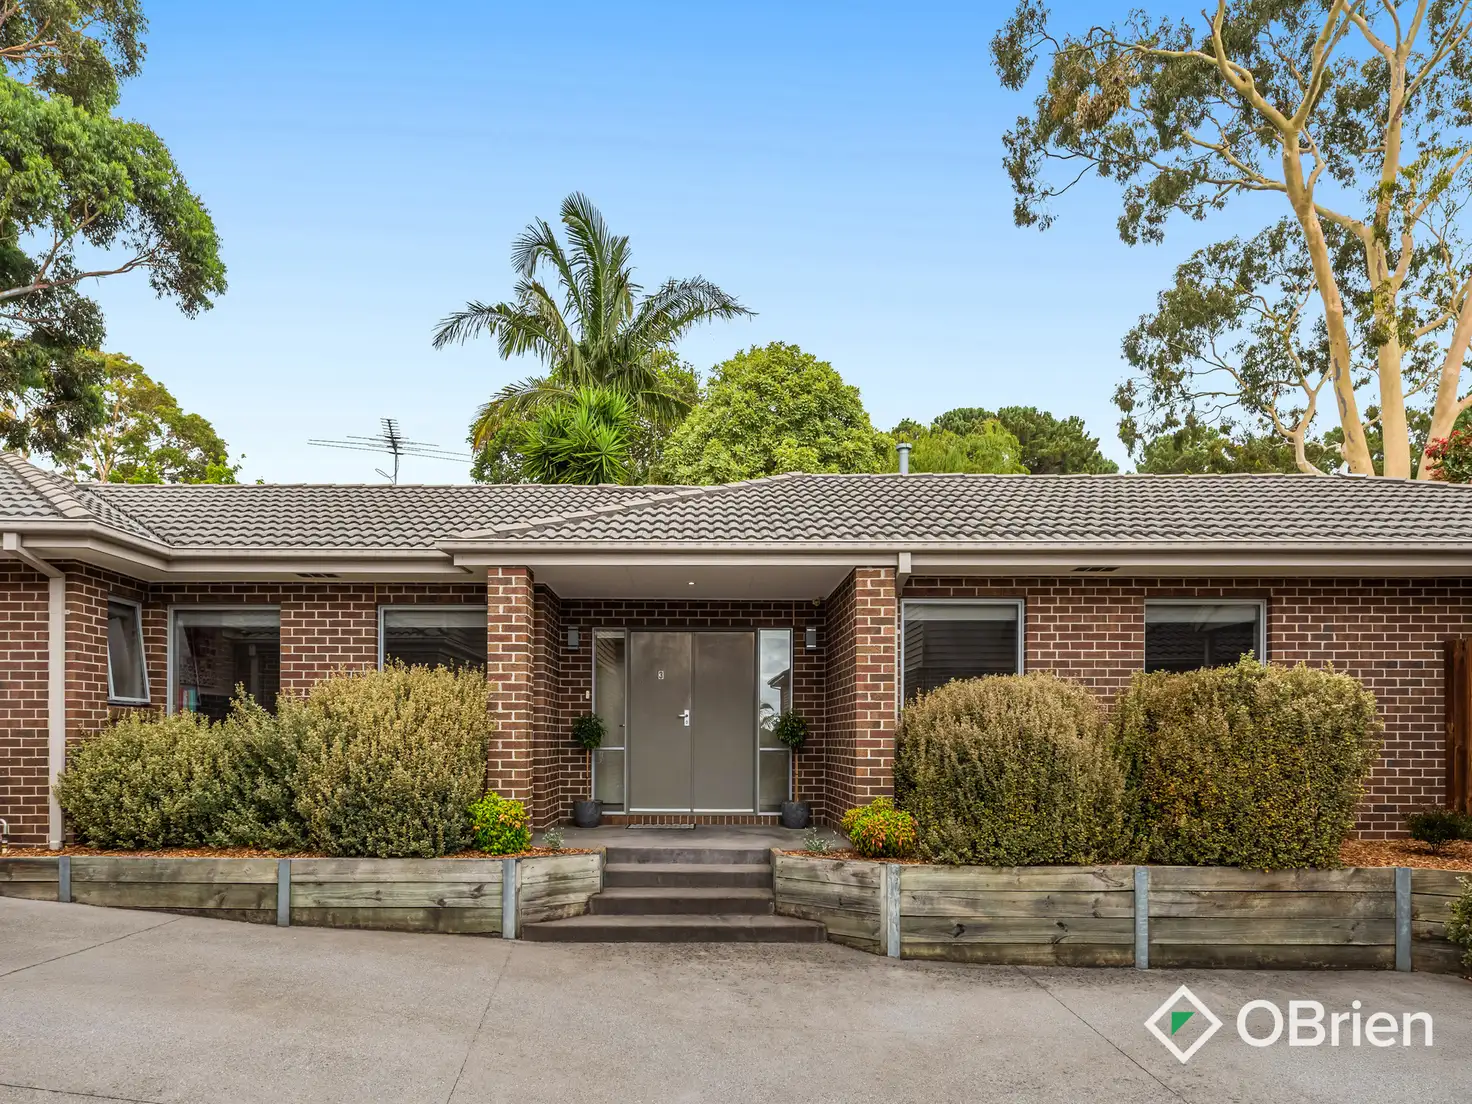
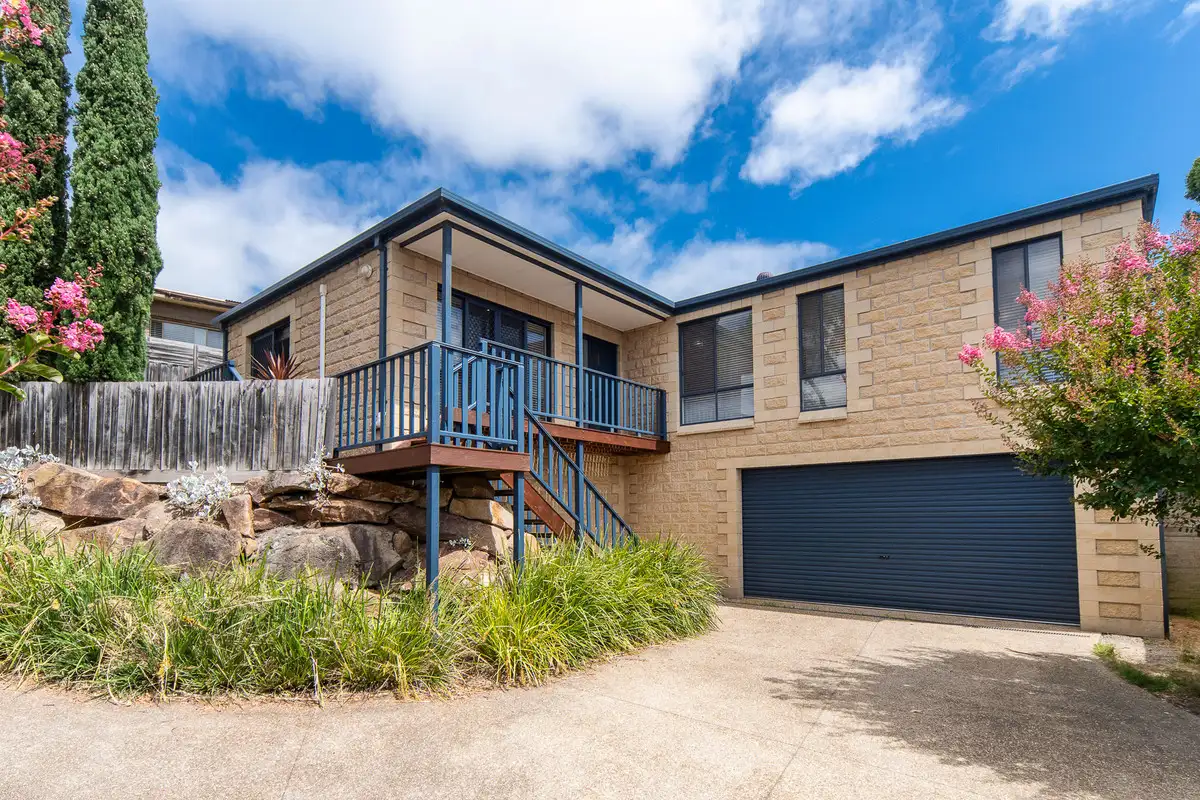
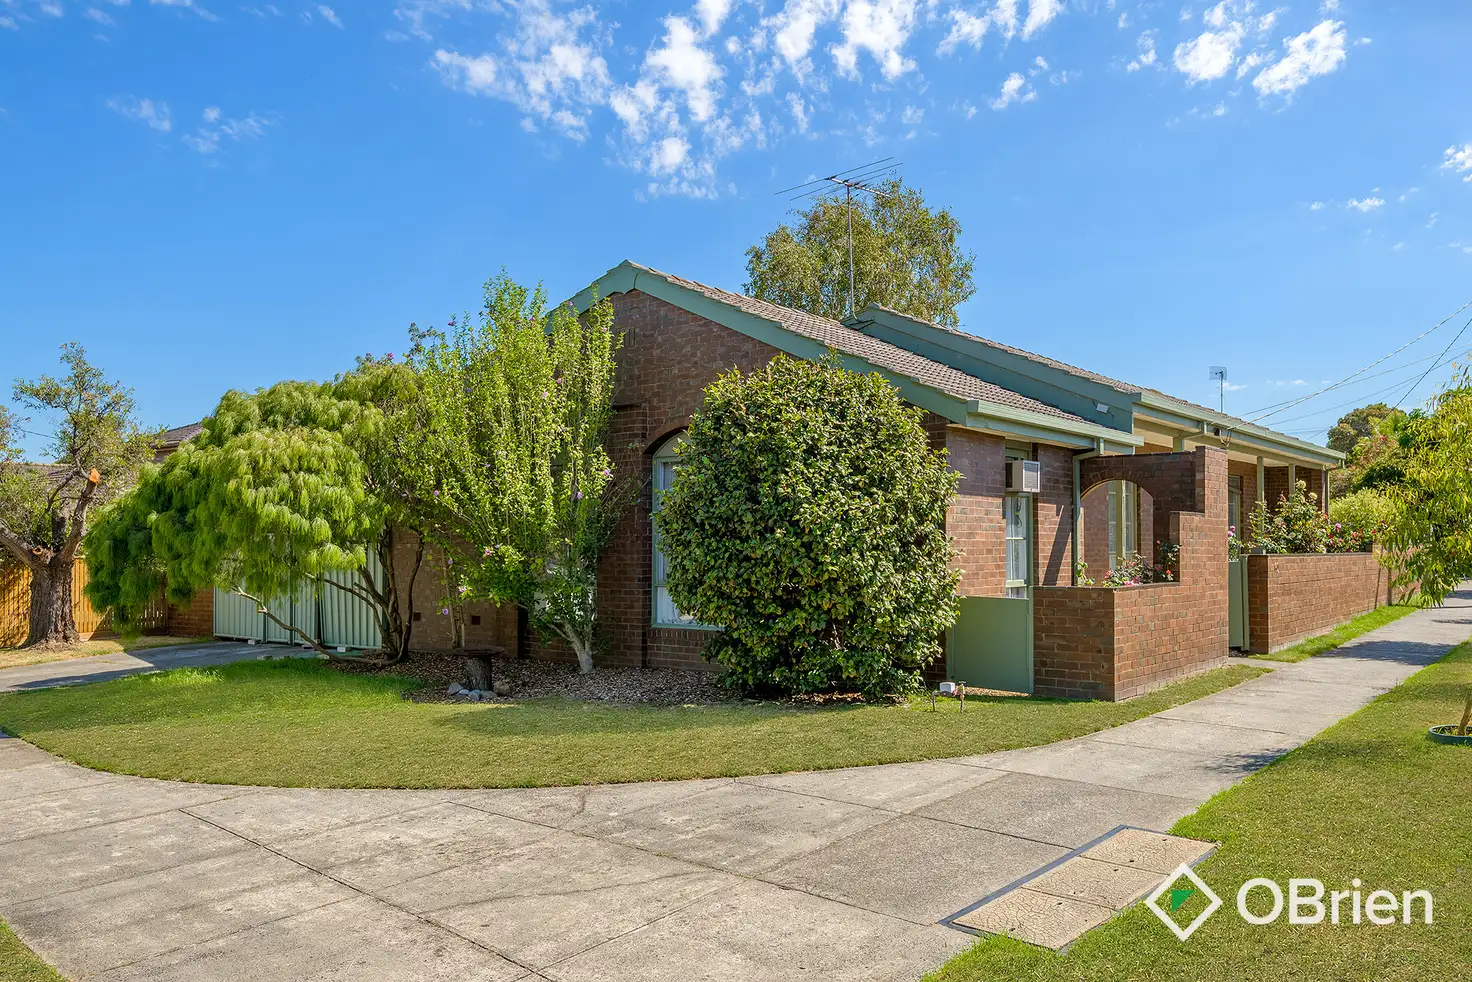
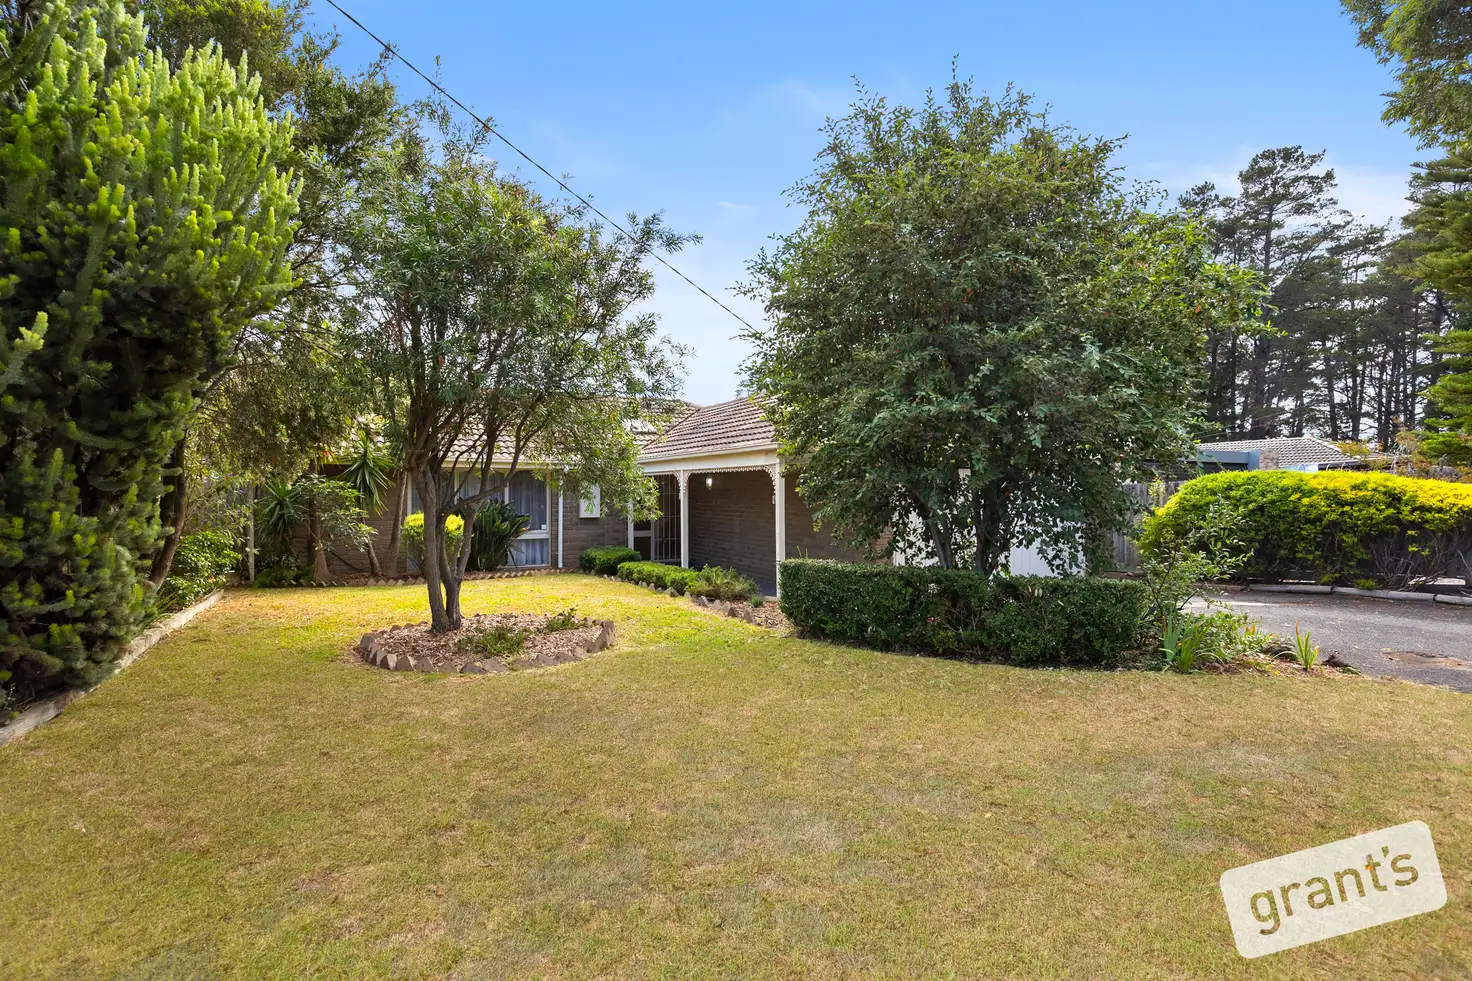
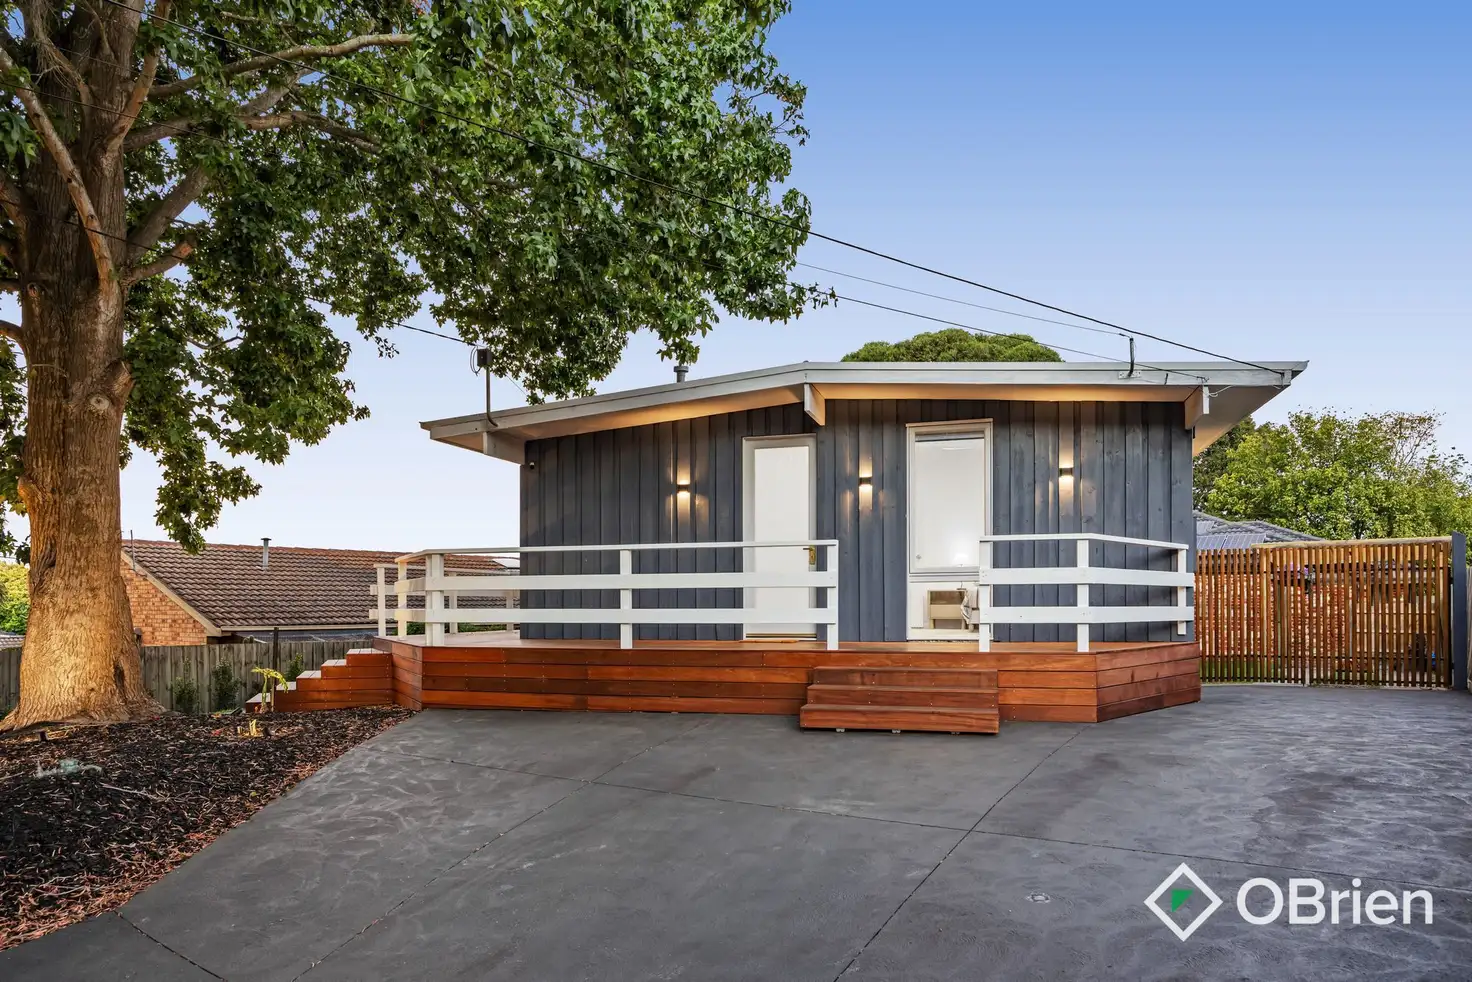
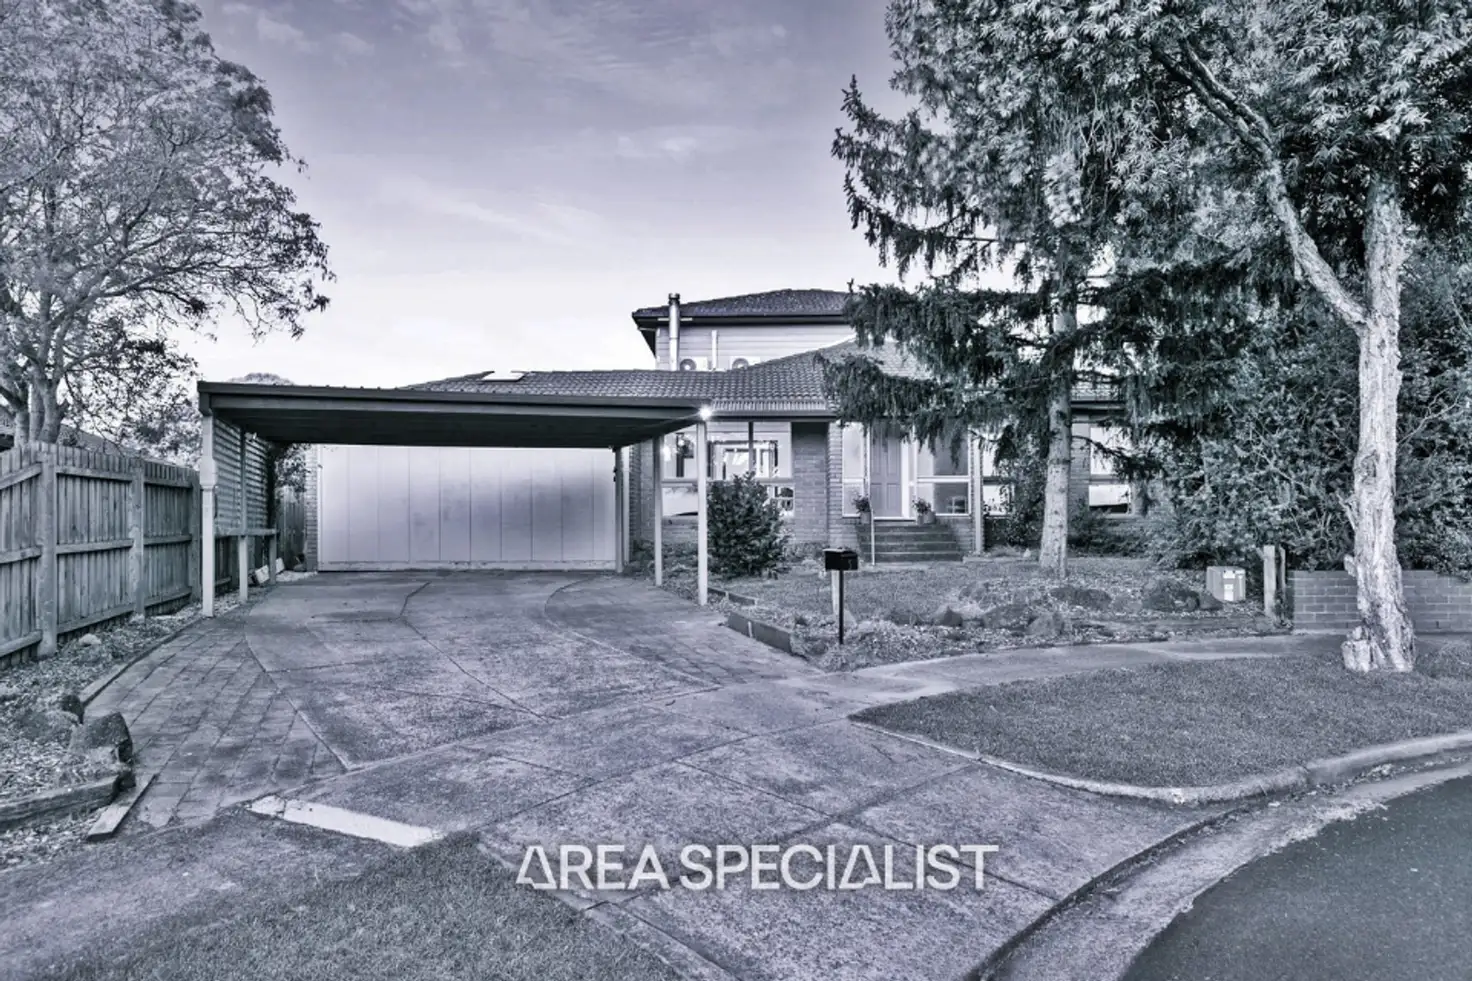
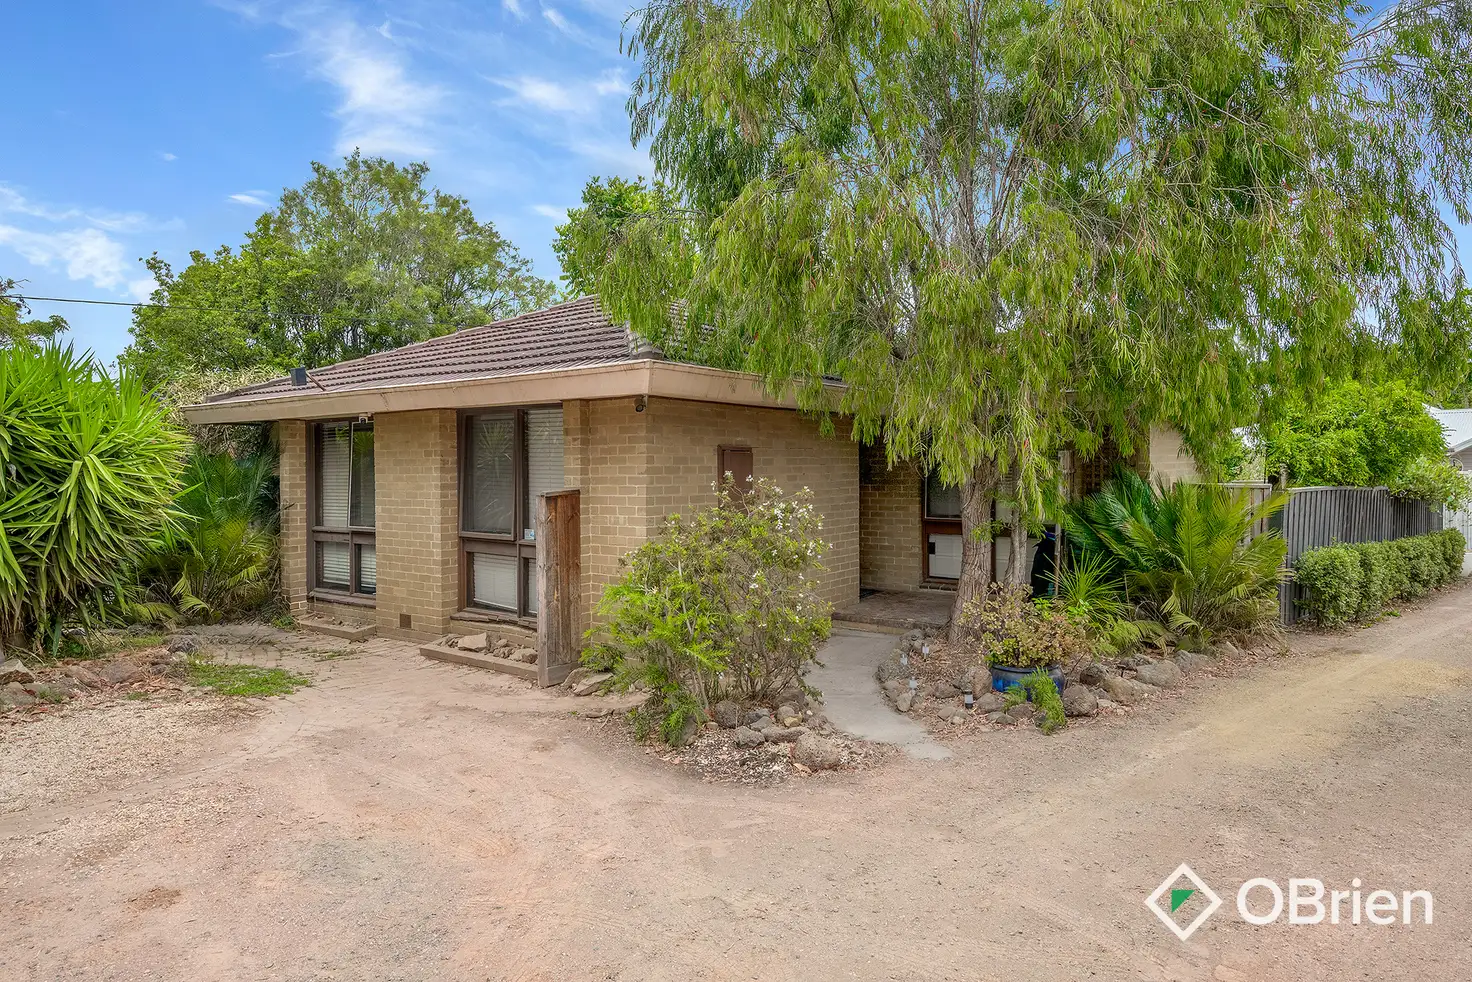
Every estimate stands on real homes like these. Each one is checked against its own photos and records before it counts as a comparable. This is a handful of the 15 million.
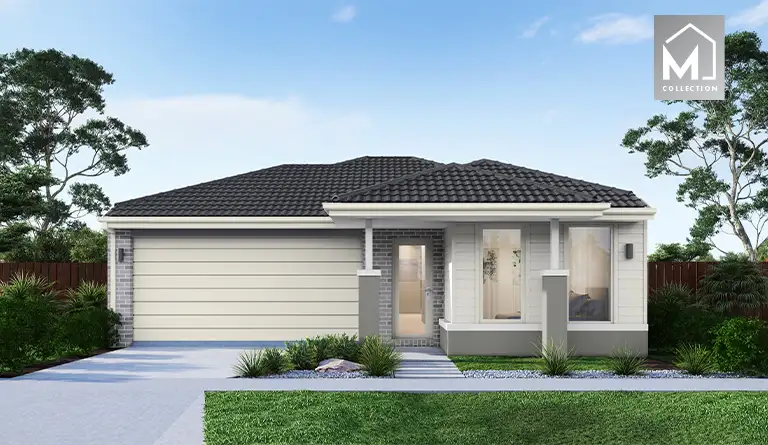
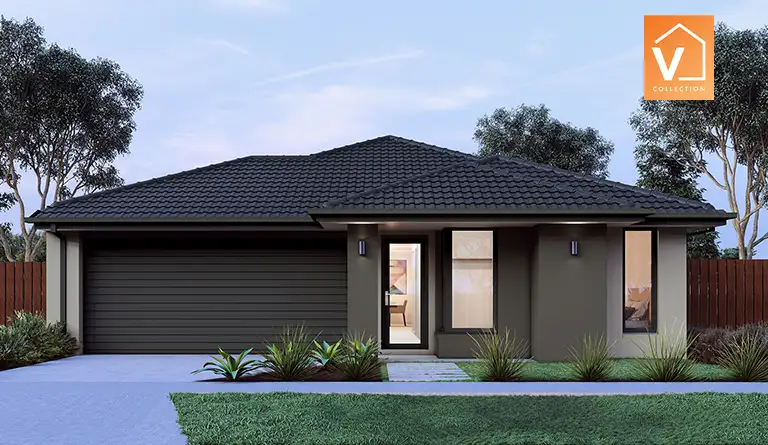
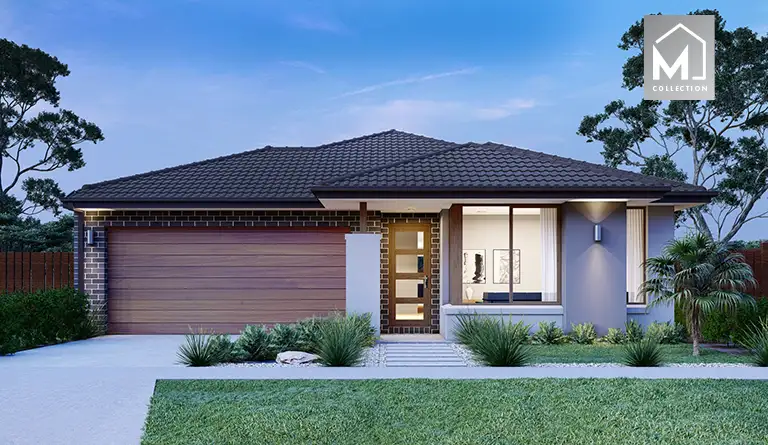
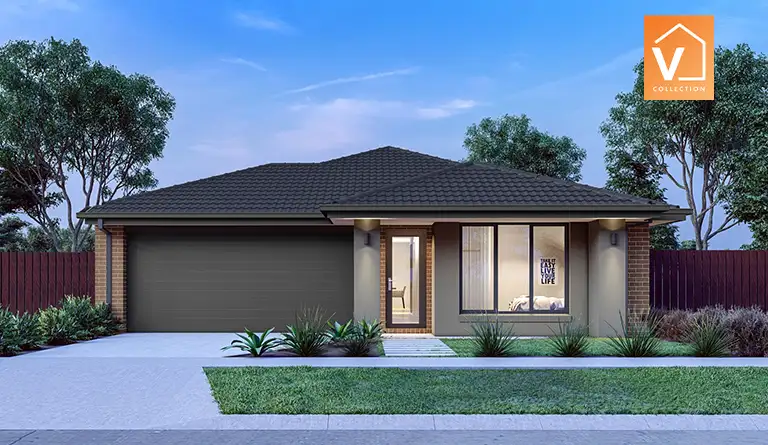
What we built
We matched homes right across the country to recent nearby sales of genuinely similar homes, using far more than bedrooms and bathrooms. Then we adjusted each past sale for how the market has moved since, so the figure reflects today, not two years ago.
It covers all eight states and territories. For about 9 in 10 of the homes we cover (roughly 85% of all homes), there are enough genuine nearby sales to form an estimate. We focus on normal homes, and deliberately leave out the largest blocks, about 1 in 13 homes (farms, acreage and big rural land), because a 50 hectare farm is not a fair comparison for a suburban house. Those are marked out of scope rather than given a number.
See how the national estimate is built and where it is strongest →
And the number it produces lands close too
The comparison above is the heart of it. The single dollar figure it rolls up to is just the summary, and here is how close that summary lands. For a typical home it is within about 10 to 20% of the real sale price. On an $800,000 home, that means a typical estimate sits somewhere around $680,000 to $880,000. Close enough to tell whether an asking price is fair, not a formal valuation.
It is strongest in the mid-market, where most homes trade. Below, the estimate for a typical house is plotted across the price range, from an Adelaide starter suburb to blue-chip Sydney, against what houses there have actually sold for. Dots near the line are estimates that matched the market.
Here are five, in dollars. These are illustrations, not the whole picture, but they show the estimate tracking the real market across very different price points.
Elizabeth, SA (Adelaide)
Comparable-sales estimate for a typical house: $498k
Houses here have recently been selling for about $503k (2026), so the estimate sits about 1% below that.
Cranbourne, VIC (Melbourne)
Comparable-sales estimate for a typical house: $759k
Houses here have recently been selling for about $722k (2026), so the estimate sits about 5% above that.
Bendigo, VIC (regional)
Comparable-sales estimate for a typical house: $774k
Houses here have recently been selling for about $772k (2026), so the estimate sits right on it.
Mosman, NSW (Sydney)
Comparable-sales estimate for a typical house: $5.83m
Houses here have recently been selling for about $5.39m (2026), so the estimate sits about 8% above that.
Bondi Beach, NSW (Sydney)
Comparable-sales estimate for a typical house: $4.62m
Houses here have recently been selling for about $4.77m (2026), so the estimate sits about 3% below that.
The same holds across the country: for a typical home the estimate lands within about 10 to 20% of the eventual sale price. It is most reliable in the mid-market where most homes trade, and a little rougher right at the top end and in quiet markets where few similar homes change hands. Treat it as a strong starting point and a sanity check, not a formal valuation.
Every estimate tells you how much to trust it. It is strongest where plenty of similar homes have sold close by, weaker where few have, and where there is not enough to go on we hold the number back rather than guess. Each estimate is dated, so you always know it reflects the market now.
How this helps you
Before you offer, you can check the asking price against what comparable homes nearby actually sold for. If the quote sits well above genuinely similar sales, that is a reason to pause, or to negotiate.
It is not a growth forecast. Its value is making sure you do not overpay. Buying in line with, or below, what comparable homes sold for is instant equity, and it protects the return on your purchase.
These four suburbs are a handful of the 15 million homes covered. Check any address to see its comparable-sales estimate and the actual nearby sales behind it.
Check a home's estimate →See how buyers and buyers agents use this →
About the research
Microburbs is an Australian property data company. This work was led by founder Luke Metcalfe, who has spent more than 15 years in property data. It draws on more than a decade of sales records covering the whole country, refreshed weekly. The full method is set out in our research paper.