
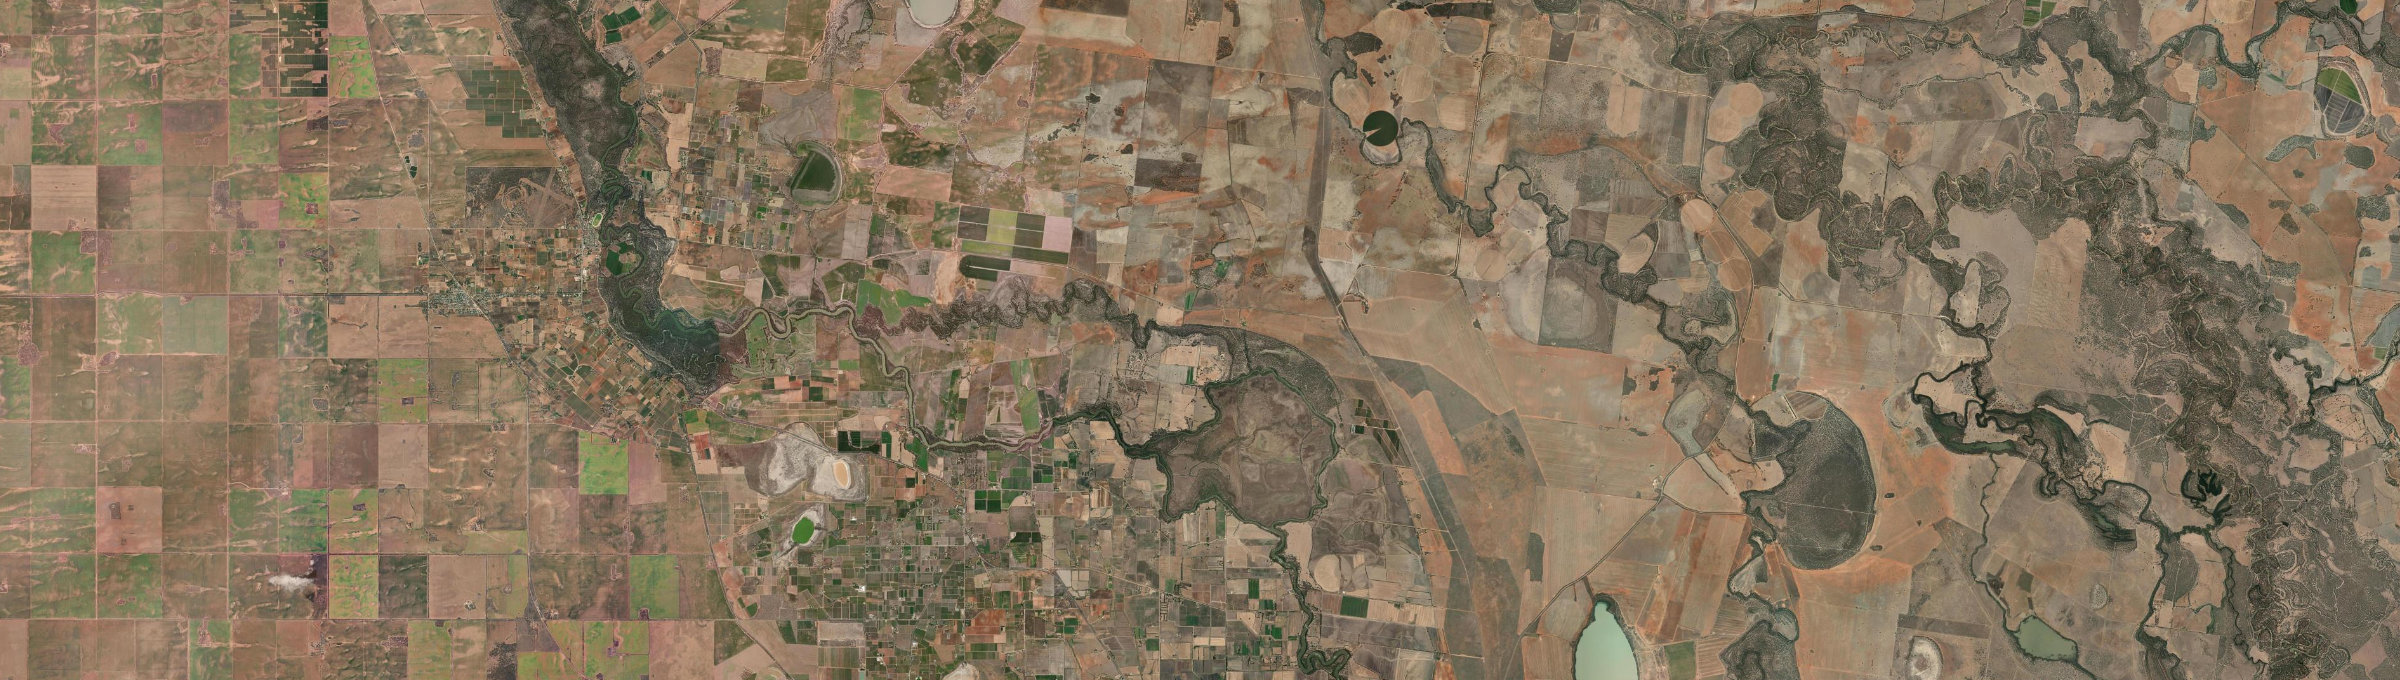
Aerial view
Imagery © Esri
The quick read on
Speewa
NSW 2735 · Murray River
What homes cost, how rents have moved, and a feel for the people who call it home.
- Population
- 115
- Postcode
- 2735
ABS 2021
Speewa, New South Wales
Property market insights for Speewa
Median sale price and rental income of properties in Speewa NSW
Crime and safety
Is Speewa safe?
The overall rate for Speewa is 944 offences per 100,000 residents — 71% below the Rest of NSW benchmark.
That is the clearest suburb-wide answer. Open the detailed profile to see how the pattern changes across offence types and different parts of Speewa.
Overall crime rate
944
offences per 100,000 residents
71% belowRest of NSW
SpeewaRest of NSW: 3,298
Suburb-wide estimate from Microburbs' public crime model; it is not an address-level measure.
The people behind the postcode
Who lives in Speewa?
Speewa NSW 2735 is in New South Wales, within Rest of NSW.
115 people call Speewa home, with an average of 2.9 people per household and a median household income of $1,375 a week.
Public ABS 2021 Census figures. The bars compare the local share with the capital-region benchmark.
- Population
- 115
- Median age
- 45 years
- Median mortgage
- $1,156 / month
- 2021 household rent
- $220 / week
Above the benchmarkBelow the benchmarkIn lineRest of NSW benchmark
Age profile
Share of residents in each age band.
Under 1515.7%Below
15–3423.5%Above
35–5421.7%Below
55–7428.7%Above
75 and over3.5%Below
Homes
Share of occupied private dwellings.
Separate houses113.2%Above
Townhouses0.0%Below
Apartments0.0%Below
Ownership
Share of homes with a stated ownership or rental status.
Owned outright42.9%Above
Paying a mortgage46.4%Above
Renting10.7%Below
Cars at home
Vehicles available to occupied households.
No car0.0%Below
One car7.0%Below
Two cars37.2%Below
Three or more34.9%Above
Getting to work
Selected ways residents worked or travelled on Census day.
Worked from home16.9%Above
Drove to work57.7%Below
Train, tram or bus0.0%Below
Walked or cycled0.0%Below
What stands out in Speewa
16.9% of workers in Speewa worked from home on Census day.
2.6% of Speewa residents were born in England.
47.8% of people in Speewa described themselves as having no religion in the 2021 Census.
A closer look at the Census
Questions people ask about Speewa
Open any question for a plain-English reading of the public 2021 Census for Speewa NSW 2735.
Is Speewa family-friendly?Age, family structure and household size describe the community families would be joining.
15.7% of Speewa's residents were children under 15 in the 2021 Census. That is close to the Rest of NSW average.
33 family households lived in Speewa; 48.5% were couple families and 12.1% were one-parent families.
27.3% of local families included children under 15. That is well below the Rest of NSW average.
These are suburb-wide household figures, not school or childcare ratings.
What is the age profile of Speewa?The balance between younger adults, families and older residents changes how a suburb feels day to day.
Speewa had 115 residents at the 2021 Census.
15.7% of residents were aged 25 to 44.
32.2% were 55 or older. That is somewhat below the Rest of NSW average.
Age shares use the suburb’s total Census population.
What kind of homes are in Speewa?The dwelling mix shows whether the suburb is mostly detached homes, townhouses or apartments.
Separate houses made up 113.2% of occupied private dwellings in Speewa.
Townhouses and other attached homes represented 0.0% of occupied private dwellings.
Flats and apartments accounted for 0.0% of occupied private dwellings.
All three shares use occupied private dwellings as the denominator.
Do people own or rent in Speewa?Tenure shows how many households own outright, have a mortgage or rent.
42.9% of households with a stated tenure owned their home outright. That is somewhat above the Rest of NSW average.
46.4% were buying their home with a mortgage.
10.7% rented their home. That is about half the Rest of NSW rate.
Tenure shares include households that stated one of these three arrangements.
How large are households in Speewa?Household-size data shows the mix behind the suburb-wide average.
The average household in Speewa had 2.9 people.
One-person households made up 18.6% of occupied homes. That is well below the Rest of NSW average.
Two-person households represented 34.9%, while 23.3% had four or more usual residents.
Household size counts usual residents in occupied homes.
How do people get to work in Speewa?Census-day travel shows the balance between home, road, public transport and active travel.
16.9% of workers worked from home on Census day. That is close to the Rest of NSW average.
57.7% drove a car as their only travel method. That is somewhat below the Rest of NSW average.
0.0% used only a train, tram or bus, while 0.0% walked or cycled.
Travel figures are a 2021 Census-day snapshot.
How many cars do households have in Speewa?Vehicle availability helps describe the routines local households can support.
0.0% of occupied households had no motor vehicle available. That is about half the Rest of NSW rate.
One-car households formed 7.0% of the total.
72.1% of households had two or more vehicles.
Vehicle counts refer to occupied households, not individual residents.
Who's moving to Speewa, and who stays?Address history shows how settled or recently mobile residents were at the Census date.
71.6% were at the same address five years earlier, while 28.4% reported a different address.
6.1% of residents were born outside Australia. That is about half the Rest of NSW rate.
Mobility figures cover residents who answered the relevant Census question.
What languages are spoken in Speewa?Language at home gives a direct view of the community’s everyday linguistic mix.
91.3% of residents used only English at home.
3.5% used a language other than English at home.
0.0% spoke Mandarin at home, 0.0% spoke Cantonese and 0.0% spoke Hindi.
Home language is separate from English proficiency.
Where were Speewa residents born?Birthplace adds another layer to the local story, separate from ancestry and language.
6.1% of Speewa's population was born outside Australia, while roughly 93.9% was born in Australia.
0.0% of residents were born in China.
0.0% were born in India, while Australian citizenship across the whole suburb stood at 93.9%.
Birthplace, citizenship and ancestry describe different parts of identity.
What ancestries shape Speewa?Ancestry responses show how residents describe family and cultural background.
English ancestry accounted for 41.7% of ancestry responses in Speewa.
Australian ancestry made up 53.0% of responses.
Chinese ancestry represented 0.0% of responses.
People may nominate more than one ancestry, so these are shares of responses.
What work do people do in Speewa?Occupation describes a person’s role; industry describes the sector employing them.
4.2% of employed residents worked in professional occupations. That is about half the Rest of NSW rate.
Managers accounted for 38.0% of employed residents, while clerical and administrative workers made up 11.3%.
Health care and social assistance employed 15.5% of workers, and education and training employed 7.0%.
Occupation and industry figures describe employed residents of the suburb.
How active is the workforce in Speewa?Participation, employment pattern and unemployment describe the resident labour force.
The labour-force participation rate was 75.0%, compared with 56.4% across Rest of NSW.
42.1% of residents aged 15 and over worked full time, while 27.4% worked part time.
Unemployment was 4.2%, compared with 4.6% across Rest of NSW.
Labour-force figures come from the 2021 Census.
What does the health profile of Speewa show?Selected long-term health conditions help describe community service needs.
60.9% reported no selected long-term health condition.
11.3% reported a long-term mental health condition, including depression or anxiety.
13.9% reported asthma, 12.2% arthritis and 5.2% diabetes excluding gestational diabetes.
These are self-reported suburb-wide Census figures, not address-level health risks.
How educated is Speewa?Qualifications describe the study pathways represented among local residents.
26.8% of people in the qualifications table held a bachelor degree. That is well above the Rest of NSW average.
Postgraduate degrees accounted for 0.0% of qualification responses.
Diploma-level qualifications represented 22.0%, while certificate-level qualifications represented 51.2%.
Qualification categories are reported separately and are not school ratings.
What do incomes and housing costs look like in Speewa?Census income and household payments give historical context for local living costs.
Median household income was $1,375 per week in the 2021 Census.
The median monthly mortgage repayment reported by local households was $1,156.
Occupied renting households reported a median rent of $220 per week.
These household figures are from 2021; current sale and asking-rent medians appear in the market section.
How does Speewa compare with Rest of NSW?A few clear differences place the suburb in its wider metropolitan context.
Working from home was 16.9% in Speewa, compared with 15.7% across Rest of NSW.
Outright ownership was 42.9% locally and 39.6% across Rest of NSW. That is somewhat above the Rest of NSW average.
Renting accounted for 10.7% in Speewa, against 27.9% across Rest of NSW.
Capital-region comparisons use the same Census definitions and year.
Three useful questions
A buyer’s quick guide to Speewa
Is Speewa expensive?
There is not yet enough consistent market data for a dependable house median. The nearby suburb links make it easier to compare the wider market while local observations build.
Is Speewa good for families?
The Census counted 33 local families, and 15.7% of residents were under 15. That describes the community; school quality, travel times and the right fit for a particular family need separate research.
What can I get for $1.5m in Speewa?
The free data does not have a dependable bedroom breakdown for this suburb. Compare the current house and unit medians above, then use live listings to see what a $1.5m budget buys today.
Medians describe recorded market activity across the suburb; they are historical context, not a valuation or forecast for an individual home.
Explore the area
Streets and suburbs around Speewa
9 streets in Speewa
Street-by-street reports are not published yet. The streets below are the ones this suburb covers.
- Davidson Ln
- Greenfield Ln
- Mccalman Ln
- Pickering Ln
- Speewa Ferry Rd
- Speewa Island Ln
- Speewa Rd
- Stony Crossing Road
- Tueloga Rd
12 suburbs surrounding Speewa
Compare nearby suburb prices, rents and five-year market trends.
Keep exploring
Is Speewa right for your search?
Use the finders to compare places and properties, or open the full report when you need the street, risk, schools and growth research.
Read the thinking
Figures update as new market and census data arrives. This suburb overview is general information, not a valuation or financial advice.