
 with

 with
Free · Limited time, limited places · Saturday 7 November 2026 · Sydney + online · with Data Science Sydney
Join the Microburbs Hackathon
New: one day and more than 200 kinds of property and urban data, from live listings to the 2026 Census, free.
Build anything you like with property and urban data: an app, a map or a video. The key covers the City of Sydney council area. Free to enter, in Sydney or online from anywhere in Australia. Founders, agents, investors, designers, marketers, analysts and coders are all welcome.
Open for a limited time only. Places are limited, so apply. We choose who takes part against our selection criteria. Applying does not guarantee a place.
Bring your laptop. Power and lunch are provided. Use any AI you like, and have your subscriptions ready. Teams are three to six people.


What is the Microburbs Hackathon?
A one-day build on Saturday 7 November 2026 where Microburbs hands you the property data we normally sell, for the whole City of Sydney council area, and you make something with it. Free to enter. Come in person at UTS Business School, Level 4, near Sydney CBD, or enter remotely from anywhere in Australia. Run with Dr Eugene Dubossarsky and Data Science Sydney, the Sydney AI + Data meetup. It is a community day as much as a contest: you meet the people who build with this kind of data in Sydney, and you leave with something to show.
What has already been built with this data?
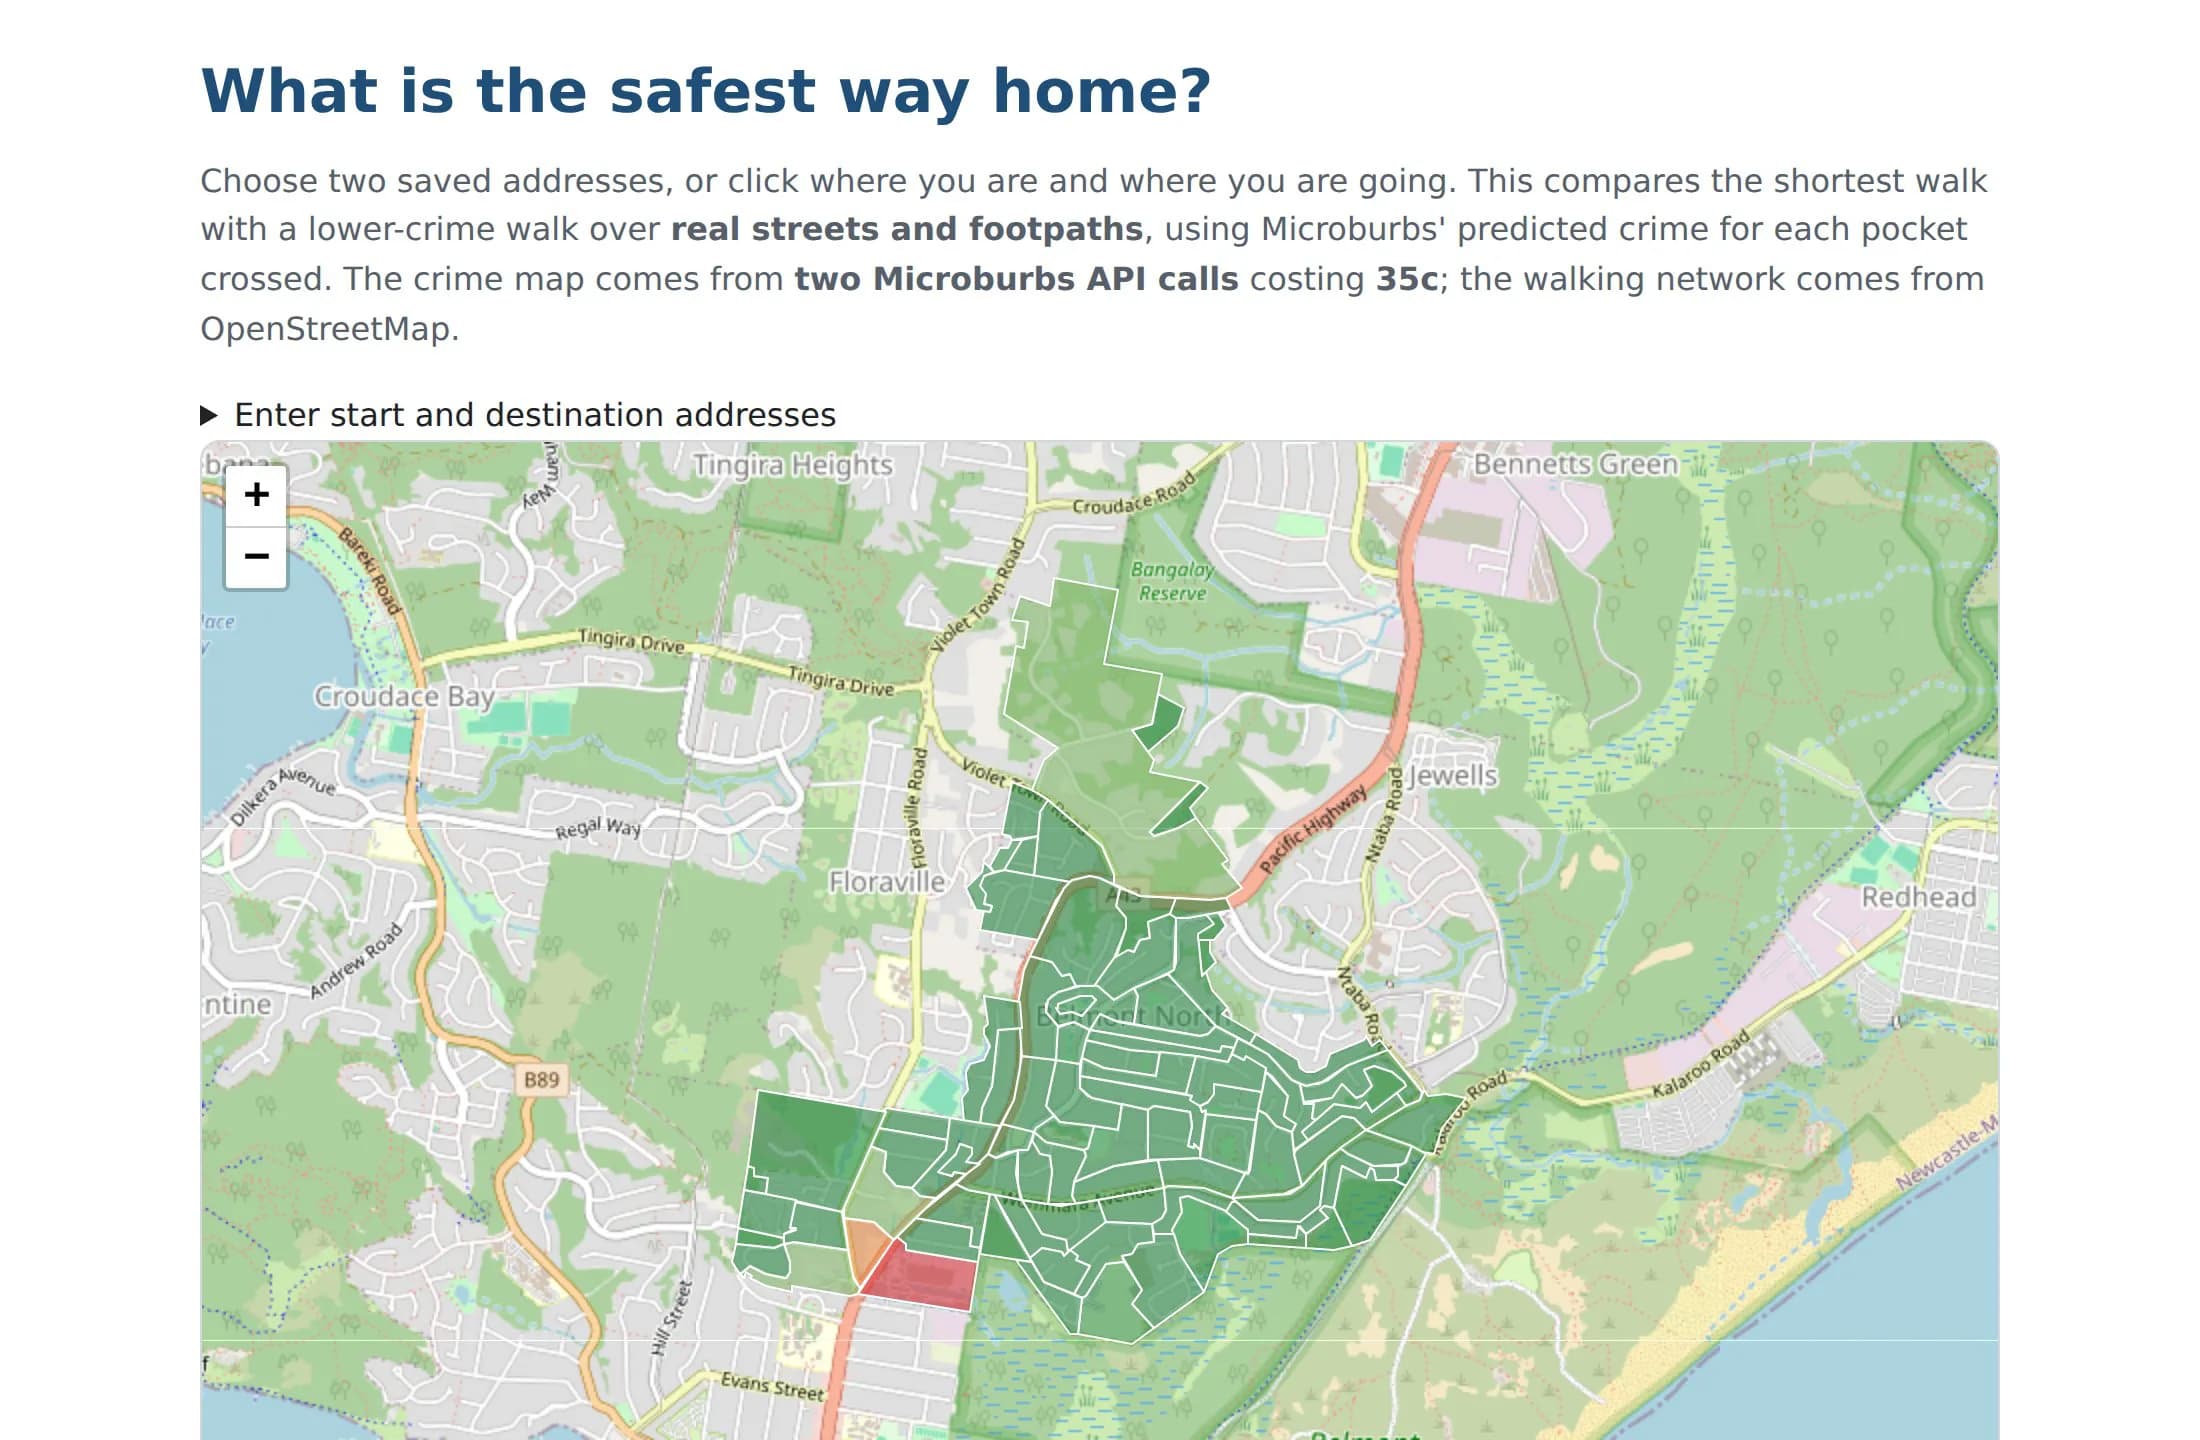
Real tools and videos, built on the same data you get on the day. Here are three of them. Each one started as an idea a team could build in a day. You can enter a video too, like the two below. A video that gets people talking is as worthwhile an entry as an app.
When and where is it?
Saturday 7 November 2026, one day. Join in the room at UTS Business School, Level 4, near Sydney CBD, or online from anywhere in Australia.
Everyone given a place gets the venue and the running order. Power and lunch are provided. Bring your laptop.
Who can enter?
Anyone, and you do not have to code. We judge on whether the thing is useful, whether it is explained well and whether it grabs attention, not on how clever the code is. That takes a mix: someone who knows the problem, someone who can tell the story, and someone who can build. So founders, agents, investors, product managers, marketers, designers, planners and analysts are as welcome as engineers, and the engineers will want you on their team.
You choose your own team, of three to six people. Find people who mix a builder, a storyteller and someone who knows the problem, and apply together.
- Product managers
- Marketers
- Designers
- Analysts
- Engineers
- Data scientists
- Planners
- Founders
- Agents
- Investors
- Anyone curious
There are three kinds of team.
In person, near Sydney CBD
UTS Business School, Level 4, near Sydney CBD. Limited seats, chosen from the applications. Power, lunch and the people who know the data at the next table. Bring your laptop.
Remote, anywhere in Australia
Same data, same clock, same judging, same prizes. Perth, Brisbane, a country town. Places chosen the same way as the room.
The machines
AI models enter as autonomous teams, running with nobody steering them, on the same brief you get. You can watch them work on the screen all day.
The AI teams get the same brief you get, at the same moment, and the prompt is published. The question of the day is whether people using AI beat AI running on its own.
What do you win?
The top three teams each get a free month at UTS Startups. The winning team also gets $10,000 in API credits, $2,000 cash and a job at Microburbs for one of its members.
$10,000 in Microburbs API credits
Ten thousand dollars of API calls for the winning team, on the same plans paying customers use, so what you built on the day keeps running after it.
A job at Microburbs
A job for one person from the winning team. Show us what you can build with our data.
$2,000 cash
Split evenly among the members of the winning team.
A free month at UTS Startups
Each of the top three teams gets a month of UTS Startups, normally $250 a month, for up to six team members, so the project can keep going after the day.
Keep the data
Anyone who puts up something that works keeps access afterwards, so your project does not die when the day ends.
What data do you get?
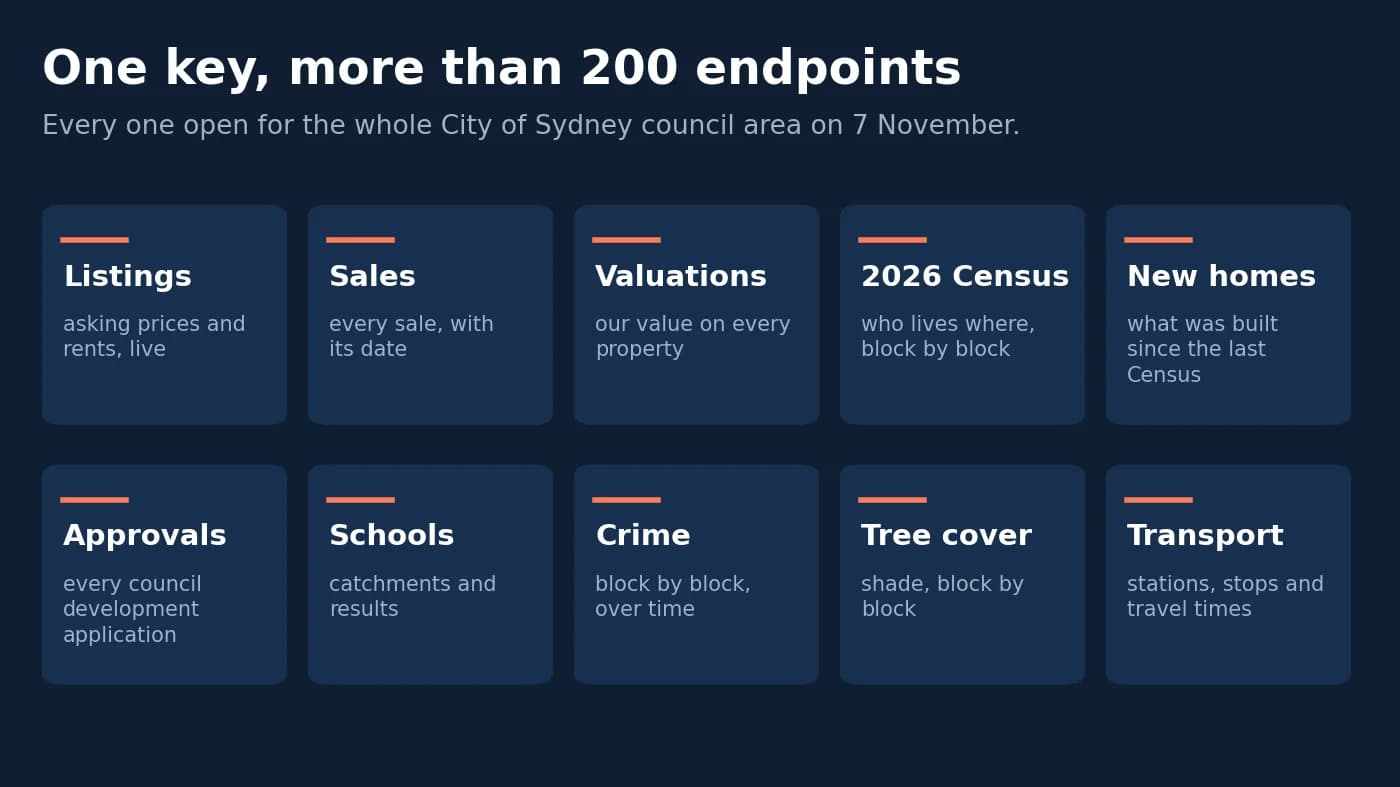
More than 200 endpoints, not one map: live listings with asking prices and rents, past sales, our valuation of every property, council approvals, schools, crime, tree cover, transport, and the 2026 Census on who lives where. An API key that opens the whole City of Sydney council area for the day. The same endpoints we sell, scoped to that one council area, so you query it live rather than being handed a mystery file. Not a sample. That is 2,281 city blocks, about 153,000 homes and 248,000 people, in the 2026 Census. The API reference below shows which information is available for each property, each census block and the council area.
All of it, not a selection. Every endpoint in the Microburbs API reference is open for the City of Sydney council area on the day, more than 200 of them, the same calls paying customers make. What we hold for the council area is what you get.
Explore the data available for your build.
For every property, by address (50)
- Amenities
- Nearby amenities, Nearest transport by mode
- Basics
- All basics, bundle, Bathroom count, Bedroom count, Dwelling type, Land area (sqm), Parking-space count
- Comparables
- All comparables, bundle, comparable sales comparable set, comparable sales, single best comparable, Recent sales within a radius
- Context
- Census blocks, 1 km buffer stats, Nearby for-sale listings, Bedroom-band price series
- Development
- All planning, bundle, Primary zoning code, Development overlays at this point
- History
- All sale + rent history, bundle, Rental listing history, Most-recent rent observation, Sale and for-sale history, Most-recent sale record
- Title
- Neighbours
- Profile
- Census profile
- Risks
- All property risk overlays, bundle, Bushfire-prone overlay, Environmental-risk overlay, Erosion overlay, Flood overlay, Heritage overlay, Historical-flood overlay, High-voltage power-line overlay, Landslide overlay, Mobile black-spot overlay, Public-housing overlay
- Schools
- All schools, bundle, Nearby schools, Local school ranking
- Surroundings
- Surrounding listing-history signals (200 m), Surrounding land parcels (200 m), Surrounding properties (200 m), Surrounding public-housing flags (200 m), Surrounding tenure mix (200 m)
- Valuation
- Agent quoting accuracy, All valuation outputs, bundle, our valuation of the property, Council land values, 5-year series, Negative-gearing stat, our valuation value over time
For every suburb (90)
- Finder
- Count matching suburbs, Finder field catalog, Finder scope regions, Search suburbs
- Profile
- List suburbs, Census profile
- Crime
- Crime, breakdown by type, Crime, rate per census block, Crime, suburb vs national benchmark
- Demographics
- Age-bracket breakdown, All demographics, bundle, Dominant ancestry per census block, Local business mix, Regional and neighbour cohort ranks, Cultural-integration score, Income-bracket breakdown, Income per census block, Population history and projection, Housing tenure breakdown, Projected voting profile
- Development
- All planning, bundle, Development applications, Building controls, height and floor space ratio, Construction activity per census block, Average council rates, Recent development application count, Recent development application list, Development profile, New supply, units vs houses, Zoning map (polygons)
- Ethnicity
- All ethnicity, bundle, Ancestry breakdown, Country-of-birth breakdown
- Forecast
- Sale-price growth forecast
- Hero
- Neighbouring suburbs, 12-month price growth, Suburb at a glance
- Lifestyle
- Nearest capital city + distance, Nearest beach + hospital, Livability scores + regional benchmark, Livability narrative sentences, Amenity price impacts, places in the suburb (pubs, cafes, gyms, schools), Lifestyle summary, places, terrain, landmarks
- Listings
- Current for-sale listings
- Market
- Affordability index, All market metrics, bundle, Bedroom stats, Built-year profile, Comparable suburbs, Median days on market, Days on market, regional benchmark, Investor concentration, Land values, Median weekly rent, Median rent, history, Median sale price, Median sale price, history, Mortgage stress, Past price growth (1 / 3 / 5 / 10-year), 5-year price growth, Repeat sales, Strata levies, Supply pressure, Sale-transaction volume, Rental vacancy, per census block, Gross rental yield (%)
- Risks
- All risks, bundle, Bushfire coverage, Hazard item counts, Extra risk indicators, Flood coverage, Heritage share of properties, Property hazard counts, Terrain slope profile
- Sales
- Recent sales (last 3 years), Sales summary (3-year count + median)
- Schools
- All schools, bundle, Public-school catchment polygons, Nearby schools
- Shapes
- Suburb boundary polygon, Busy-road segments, Easement geometries, Hazard-overlay polygons by layer, Census-block polygons, Neighbouring suburb boundaries, Noise-map regions, Public-housing share by small census area
- Similar
- Similar suburbs
- Street Forecasts
- Street-level price forecasts
For the council area, the census blocks and the wider region (9)
- Area Statistics
- Search area-statistics fields, List regions at a level, Area statistics for a region
- Profile
- List LGAs, Census profile, List census blocks in a suburb, Census profile, List SA4s, Census profile
Finding things (2)
- Look-ups
- Address → address, Suburb autocomplete
Use the linked reference for the full details of each data request.
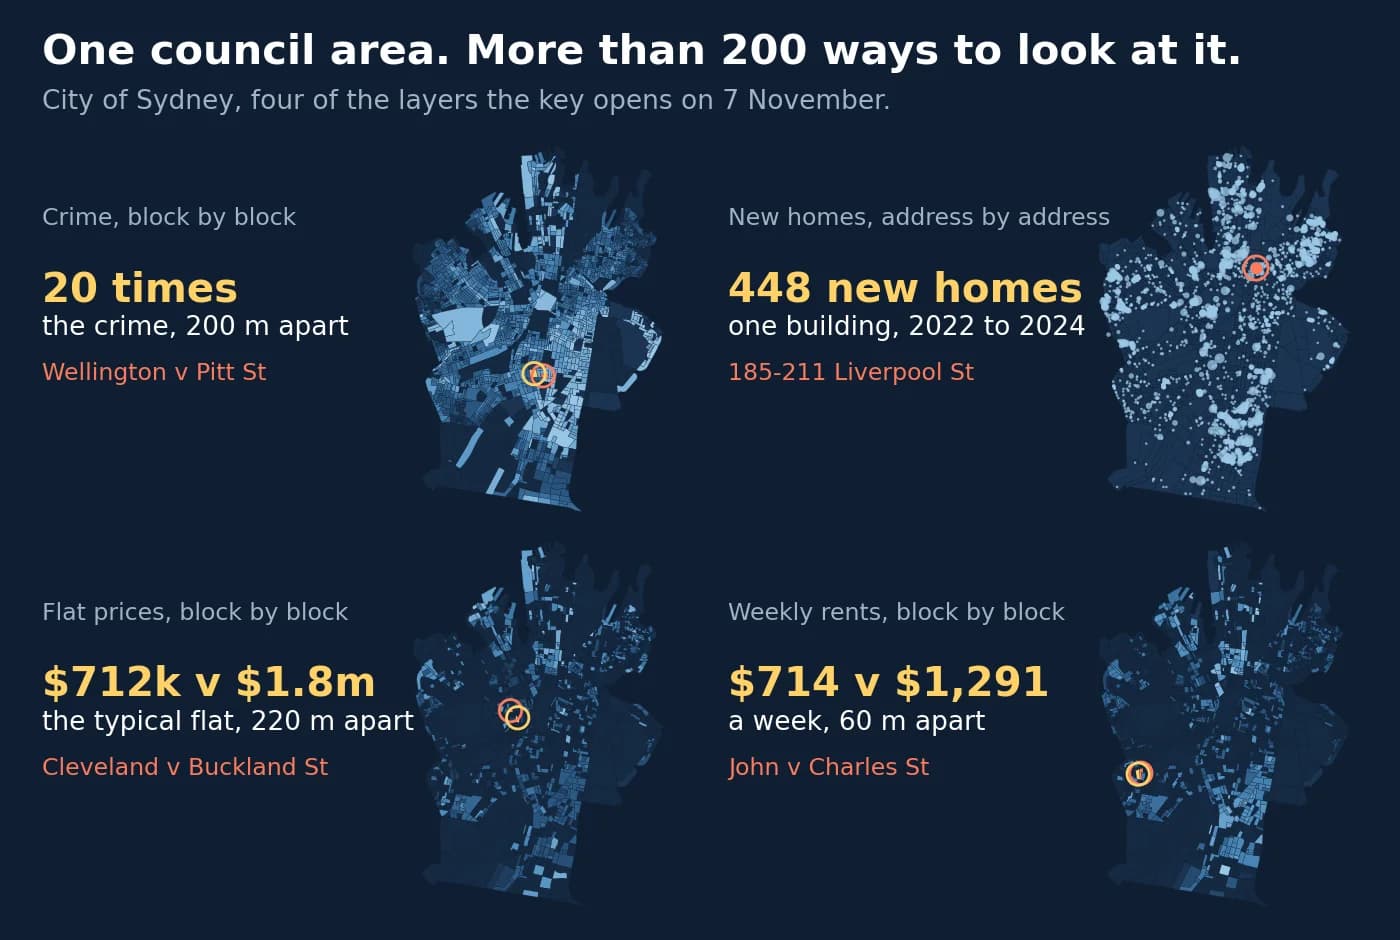
Why that is worth anything. The question in front of anyone deciding to buy, to lend against, to build on or to price risk is “is this block expensive”. The pictures above answer it block by block: the typical flat on Cleveland Street lists at about $711,700, and on Buckland Street, 220 m apart, about $1.8 million. Build a tool that compares housing pockets using their own sales and approvals.
Property sale histories
Compare repeat sales of a home to investigate what changed its price.
Every council approval, dated and placed
Explore proposed development before construction, with the date and location of each recorded approval.
Tree canopy read off satellites
Find neighbourhoods that need more shade, using canopy across the council area.
Crime, schools, transport, demographics
Explore local context, with the available geographic detail shown in the data reference below.
Blocks that line up with the official ones
Our blocks are the smallest areas the census is published on, so anything you already have at that level joins straight onto ours with no fuzzy matching.
What can you build in a day?
Six ideas for your team, each linked to related work we have already built. Pick a problem you understand, then use the City of Sydney data to make something useful.
Find the cheap block on a dear street
Typical flats list at about $712,000 on Cleveland Street and $1.8 million on Buckland Street, 220 m apart. Separate a cheaper location from a smaller or older home using sizes, sales and approvals. Build a search that compares housing pockets block by block.
We showed why one median misleads: The Median Mirage
Catch the numbers that are wrong
Compare advertised prices and rents for similar flats across the City of Sydney. Investigate unusual matches by checking the individual listings. Homes offered for sale can differ from homes offered for rent, so an unusual ratio alone does not prove a record is wrong. Build a tool that shows which records need a closer look and why.
We did it for the prices portals hide: The Price Exists. The Portal Hides It.
Show where the next flats are coming
Every council approval, dated and placed on the block it belongs to. Approvals land years before the building does, so you can point at the streets about to change and show your working.
We did it across 408 councils: Development Applications as Property Market Signals
Put a dollar on a street tree
Tree canopy read off satellites for every block, next to decades of sales of the same homes. What is shade worth. What is a train stop worth. What is quiet worth.
We did it for hills: Does Slope Affect Property Prices?
Redraw the neighbourhood
Let the blocks group themselves on what they are actually like, then see where the real neighbourhood boundary cuts across the line on the official map.
We did it for streets: Market Cohesion
Ask the whole council area a question
Point a language model at all 2,281 blocks and ask it anything, with every answer able to show the block it came from.
We tested the machines on price growth: our language model forecasting test
What the City of Sydney has said it wants
The council has put targets in writing. These are real problems your team could work on, with a source and a possible build beside each one.
More tree canopy
“By 2050 there will be a minimum overall green cover of 40%, including 27% tree canopy cover.” Community strategic plan, adopted June 2025.
Rank all 2,281 blocks by canopy read off satellites, find the ones furthest below 27%, and put a dollar on what shade does to the homes there. The council's street and park trees are on its data hub to join on.
Affordable housing it is not getting
“The proportion of affordable housing in the City of Sydney has decreased over this time and currently makes up less than 2% of total housing.” The council's affordable-housing target is 7.5%, moved from 2030 to 2036, and needs about 12,000 homes. Council minutes, 24 October 2024.
Where 12,000 affordable homes could go: every block’s approvals, land values, rents and zoning together, ranked by where a not-for-profit could actually build.
156,000 homes by 2036
“By 2036 there will be at least 156,000 private dwellings and 17,500 non-private dwellings in the local area.” Community strategic plan, adopted June 2025.
A running count of approved homes by block against the 156,000, and the streets carrying most of it. Every approval in the data is dated and placed.
Everything within a ten-minute walk
The plan says that by 2030 every resident will be around a ten-minute walk from daily necessities. Community strategic plan, adopted June 2025.
For every home, the walk to the nearest supermarket, doctor, school and park, and the blocks that miss the ten minutes. The places and the address look-ups are in the data.
Fewer car trips
The plan says that by 2050 nine in ten people working in the city centre, and two in three elsewhere, will get there by public transport, walking or cycling. Community strategic plan, adopted June 2025.
The blocks furthest from a stop, and what a stop is worth to a sale. The council's hourly pedestrian counts, February 2020 to June 2025, are on its data hub to join on.
Is it free to enter?
Yes. There is no ticket price and no entry fee, in the room or online. Power and lunch are provided for the people in the room, so bring your laptop. You keep whatever you build and it stays yours.
Can I enter online from outside Sydney?
Yes, from anywhere in Australia. Remote teams get the same data, the same clock, the same judges and the same prizes as the room. Remote places are chosen the same way as seats in the room. The only thing the room has that you will not is lunch and the person who built the data sitting at the next table.
Do I need an AI subscription to compete?
No. Use any AI you like, and have your subscriptions ready. If you turn up with no key, no cloud budget and no graphics card, you are handed a free key to a language model at the door and it costs you nothing. There is also a version that runs on your own laptop with the wifi down. Bring your best tools if you have them, because the people who do will have an edge, but nobody is locked out for not paying for one.
How do I register?
Fill in the form below. Applications are open for a limited time, and space is limited, so do apply. We choose who takes part against our selection criteria. Applying does not guarantee a place.
Teams are three to six people, and you choose your own. We email the running order to everyone who gets a place.
Why enter the Microburbs Hackathon?
Because for one day you get a whole Sydney council area, block by block, and it is free to enter. In the room near Sydney CBD on Saturday 7 November 2026, or online from anywhere in Australia, and you do not have to code.
Open for a limited time only. Places are limited and chosen against our selection criteria, so do apply.
Apply now