5 Real Estate Euphemisms That Need To Die, Now.

As property investors we all tolerate and enjoy some tired euphemisms. ‘Renovator’s Dream’, ‘Cosy’ and ‘Full of character’ have become old jokes as we wised up to them. At the same time though, we can unwittingly swallow a lot of nonsense fed to us by marketers, commentators and other investors. Some of these clichés have got under my skin recently and it’s time to give them a blast.

“Great for first-time investors”

This phrase implies that the property is not so great for seasoned investors. Would the real estate agent or developer advise against experienced buyers getting involved?

Not meaning to be rude sir, but you already have five properties, so this wouldn’t suit you. It would suit someone with less experience, a novice, …someone gullible perhaps.

Any property which is a good deal for a first time investor is an equally good prospect for an experienced investor. This phrase just gives the inexperienced an undue confidence boost.

“Are you negative gearing it?”

Gees I better check. Did I mismanage this property such that it is positively geared by mistake?

Dear tenant, it has come to my attention that your rent is so high that I have failed to ‘negatively gear’ this property, and I will need to reduce your rent.

First of all, nobody in their right mind sets out to negatively gear a property and is then surprised to find it’s not making them a loss after all. If this happens to you, congratulations! Add this positively geared property to your portfolio and go try again to buy something that loses money.

Second, the term applies to the outcome, not the strategy. You add up the income and subtract from that all the expenses and if the final number is negative, then the property is negatively geared. You don’t really make a management decision to “negatively gear it” – it comes out “negatively geared”.

“To be honest with you…”

Look, to be honest with you, I have several other interested parties who are ready to make an offer…

Should I be cautious of someone who qualifies a statement with, “To be honest with you…”? Does that mean every other statement they make without that qualification is dishonest?

At least it’s nice of them to let me know when they are telling the truth?

“Long term gainer”

Property has great long term prospects! (Don’t expect to make any money in the short term.)

How long is “long”? How long will I have to wait for that to come true and what happens in the meantime? What does this clairvoyant real estate agent know about the property market that I don’t?

This comment is a reflection of the agent’s opinion about short-term growth prospects – that they’re not great. After all, how can anyone truly know what will happen in the distant future to prices in any market? We may all be living in The Matrix and not even need properties in the future.

“This location will always be in demand”

Don’t be lured in by this phrase. It is technically correct but not helpful for investors.

There are locations that for a very long time have been highly prized by owner occupiers. These are the most expensive places to live in capital cities around the country. But merely wanting to own in such locations, doesn’t affect their prices.

A 14 year old boy will want a Ferrari for example, but that kind of demand doesn’t affect the price of Ferraris. The kind of demand we investors needto see is the kind of demand that actually affects prices, people bidding at auction, turning up to open homes and making offers.

This kind of demand is the very reason why I created the DSR score.

To cut through the euphemisms, get the facts on any property for free with a Microburbs report.


For press enquiries about this article, please call Microburbs Founder Luke Metcalfe on 0414 183 210.

Are Tired Misconceptions Blinding You from Sydney’s Next Boom Suburbs?

For most who live within 10 or 20km of the centre of Sydney, the West seems to be considered a sprawling void of fibro shacks and bogans. This ignorance might be funny to those of us enjoying the west (life is peaceful here!), but if you’re a property investor who’s written off the western suburbs without checking your facts, you could be passing up big opportunities.

I live in Kings Langley, located 45km from the Sydney CBD, and whenever I mention that I live ‘near Blacktown’, more often than not I get asked ‘Is it safe?’ Well, it is certainly is safe. The Microburbs Safety Score, based in NSW on Bureau of Crime Statistics and Research data, rates Kings Langley at 9/10, which is miles ahead of the trendy inner suburbs. With the North West Metro coming in less than 3 years, the area is set to be cracked wide open, and by the time Sydney wakes up to what’s on offer, investors will have missed the boat.

Bella Vista

Bella Vista is among some of the most well known suburbs in Sydney to those who have never stepped foot in the west. A key selling point for this suburb is not just the abundance of palatial two storey homes but also the well designed landscaping and large public parks. The share of land between commercial precincts and residential areas has also been well balanced.

The Norwest business park is a 5 minute drive away and already hosts offices from big companies like Woolworths, PwC, Schneider and Resmed. Expected completion for the North West Metro will be in 2019 and will include stations for both Bella Vista and Norwest.

For working parents, there is better supply of child care services making it far more affordable than the city. Some big landmarks include the Norwest private hospital & Hillsong church.

Also located in Bella Vista is Matthew Peace primary school which is ranked among the top 10 in the state

Microburbs Report for Bella Vista

Microburbs Safety Score: 9/10

Median House Price: $1,378,000

Median Rent: $780/wk

Annual Growth: 10.1%

Kings Langley

My home burb’  is located just west of the prestigious Bella Vista and 5km north of Blacktown. The homes there were mostly built between the 60’s and 80’s so you’ll expect to see a lot of brick. The strict council covenants on development in this suburb have ensured that the streetscape has a lot of unity and appeal.

Kings Langley is also a go-to destination for cyclists who want to take advantage of the purpose built cycleway along the M7.

Lower mortgage rates and better family friendly facilities adds to the quality of life in suburbs like Kings Langley. The high numbers of owner-occupied homes is also indicative of this quality.  

Microburbs Report for Kings Langley

Microburbs Safety Score: 9/10

Median House Price: $857,000

Median Rent: $520/wk

Annual Growth: 9.7%

The Ponds

The Ponds has become one of the most sought after suburbs in the west. Compared to the same period five years ago, the median house sales price for houses increased 165.5% (realestate.com.au).

image04

The Ponds is much newer than the established suburbs of Baulkham Hills and Bella Vista but with the Rouse Hill Town Centre just 10 minutes away and the higher abundance of public parks & recreation areas makes it very liveable.

This suburb has won several town planning design awards for its innovative use of space and using the local stormwater to make an artifical pond known as ‘The Ponds Lake’. These areas make the suburb a great place of community where families often gather in evenings and host barbeques. The clever use of public space is also designed to compensate for the small backyard sizes that are increasingly common in new suburbs.

Another selling point is the proximity to the council owned leisure and aquatic centre known for its popular wave pool.

Microburbs Report for The Ponds

Microburbs Safety Score: 8/10

Median House Price: $942,000

Median Rent: $650/wk

Annual Growth: 21.6%

Baulkham Hills

(With the exception of areas directly near the shopping centre) the high affluence level, distance from train stations and large land sizes make Baulkham Hills one of the safest suburbs in Sydney.

Located just above Castle Hill, the hills shire is is known for its abundance of local parks, with a total of 329 parks in total to walk the dog or play with the kids.

Whilst there is no train station, busses to the city provide an express trip to CBD via M2 and Lane Cove Tunnel with a travel time of around 30-40 minutes. Baulkham Hills high school, an academically selective school is consistently ranked among the top 10 in the state.

Low traffic levels and easy parking is a key benefit of western suburbs like Baulkham Hills. This makes regular travel to places like supermarkets, convenient and less stressful.

Microburbs Report for Baulkham Hills

Microburbs Safety Score: 9/10

Median House Price: $1,060,000

Median Rent: $580/wk

Annual Growth: 11%

Glenmore Park

A lesser known suburb sitting on the edge of Sydney is Glenmore Park, located 8km south of Penrith and right next to the blue mountains. A key advantage of the west is that lower density living means overall lower noise levels and better peace at night. Despite being located close to Penrith, Glenmore Park is often described as a very friendly suburb with neighbours you can ‘trust a spare key to your house with’.

With a median house price of just $700,000 this makes it makes it the most affordable on this list. In terms of public transport, Penrith train station is just a 15 minute drive away. Combined with an express train to the city, the total journey is just over an hour to get to work; not too bad for suburb located 59 kilometers from the city.
Microburbs Report for Glenmore Park

Safety Score: 9/10

Median House Price: $700,000

Median Rent: $490/wk

Annual Growth: 9.7%

If you’re an informed investor, and I’m guessing you are if you’re on the Microburbs blog, I would encourage you to take a drive through these parts of outer western Sydney. You may be surprised by the communities and opportunities you find out here.

Explore beyond the stereotypes and myths and get the facts now with a Microburbs report on any address or area in Australia:

For press enquiries about this article, please call Microburbs Founder Luke Metcalfe on 0414 183 210.

Can’t Get A Great Halal Snack Pack? Sell Your House.

The Halal Snack Pack, for those who have somehow missed it, is a kebab store dish on the rise. From the massive online Halal Snack Pack Appreciation Society, to TV stunts between politicians, it’s not just a trending snack food but a symbol of Australian multiculturalism. It is best described as a dish containing halal-certified doner kebab meat, hot chips and the ‘holy trinity’ of sauces – chilli, garlic & barbeque.

(Senator Sam Dastyari – Photo by SBS)

The snack sensation is even set to cross over into real estate. The most Muslim dominated suburbs have also seen property prices increase by 37% nationally, smashing the national average, and ‘buy near a great Halal Snack Pack shop’ might be the best, weirdest investment advice of 2016. 

We’ll focus on three Sydney suburbs that have had the best rated HSP in Australia and give a very brief overview of unique investment strategies for each one. These strategies are to give examples of the potential in these areas and are general information only. It’s important to consider your individual needs and get qualified advice before making any big decisions. 

Campbelltown – Granny Flats

Suburb: Campbelltown

Growth: 14.1%

Best HSP: King Kebabs

Strategy: Granny Flats

Free Microburbs Report: Here

King Kebabs Campbelltown is currently Sydney’s no.1 spot for HSP. Coincidentally, Campbelltown is also a sleeping giant in terms of property investment.

Located on the southern edge of metropolitan Sydney, C-town has had 14.1% growth in the past year. The key selling point for investment is that some of the older houses with large land sizes have the potential for granny flats to be built on them. The key benefit of building granny flats is that you can secure rent from both the tenants of the original house and the new granny flat at the same time. In today’s low interest rate environment, this investment can pay itself off and in many cases be positively geared.

What makes Campbelltown attractive is that the median house price is $580,000, nearly half the Sydney median.

It is possible to buy relocatable/portable granny flats from $80,000 (plus council contribution) including installation costs. Watch out for super low priced relocatables which may leave out major installation costs plus other essentials.

If you want to build on site, average costs range from $100,000 – $120,000 which doesn’t include council contributions that vary council to council.

The maximum size for a 2 bedroom granny flat is 60sqm. Additionally, the granny flat will need to be located at least 3m from the house, 3m from the back fence and 1m from the side fences.

If you’re concerned about being able to find tenants this far from the city, our data shows Campbelltown has a family score of 8/10. This is characteristic of suburbs in outer western Sydney where many families prefer the larger availability of day-care and schools (compared to the inner-west).

Blacktown – Duplexes

Suburb: Blacktown

Growth: 11.5%

Best HSP: Kebab Express Blacktown

Strategy: Duplexes

Free Microburbs Report: Here

Kebab Express Blacktown is another top rated HSP location, and my personal favorite. Whilst they sadly no longer offer Shisha, it is open until midnight for all your late night banter.

For investment, the southern parts of Blacktown contain many properties with large land size and small houses. These properties are often over 1000sqm. Apart from the potential for granny flats, this also opens the opportunity for building a duplex or subdiving into two lots.

Once built, a duplex can then be strata titled and sold off individually for a great return. Whilst there are plenty of risks that could come into this, this strategy has been quite popular with investors across Australia in recent years.

Another strategy is to subdivide the property into two lots, build a duplex at the back lot, sell the old house at the front lot and rent out the new houses.

Despite the myth that Western Sydney has no culture, Blacktown has a Microburbs lifestyle score of 8/10, and our comprehensive report shows why. The Westpoint shopping centre has plenty to see and do, and there’s a great diversity of restaurants, including Ethiopian, Italian, Indian, Mexican and more. The motorway junction also makes Blacktown quick to reach by road from any side of Sydney. 

Kingswood- Rooming Houses

Suburb: Kingswood

Growth: 13.7%

Best HSP: Pizza Stop Kingswood

Strategy: Rooming Houses

Free Microburbs Report: Here 

Located near Penrith is the well known ‘Pizza Stop Kingswood’ which consistently gets 10/10’s on the HSPAS page.

With a three bedroom median house price of 590k and growth rate of 13.7%, it is a great opportunity for first time investors in one particular strategy known as rooming houses.

Located between the large Nepean hospital in Penrith and the Western Sydney University campus, there will be large demand from tenants seeking affordable options.

Simply put, rooming houses are a type of rental set-up where in a single house, each room is rented out to separate tenants. This strategy can be applied to any house, but during your research remember to check with the following agencies to be clear on the different rules for each council:

  • Local council
  • Department of Fair Trading
  • Residential Tenancy Act
  • Department of housing NSW

A tip for investors is to find a trustworthy handyman and build a good a good relationship with them. With all your properties, you’ll need someone who can fix things reliably and give their own advice on property management from a technical perspective.

If you would like to find out more about the investor data, hip score, safety score and much more about any suburb in Australia, you can search here: 

Also check out our other article about ethnic groups with the best real estate gains in Australia (spoiler: the Chinese aren’t no. 1.) 

For press enquiries about this article, please call Microburbs Founder Luke Metcalfe on 0414 183 210.

How Far Will You Have To Go? The Price of Proximity

Recently I had an exciting opportunity to sit down with acclaimed property investment coach Jane Slack-Smith. You may know Jane from the Your Property Success courses or her frequent media appearances. We got to talking about how Microburbs data can assist property investors, and she raised the very early step of finding areas that are in your target price range.

Melb_zoom

“It may seem fine to look at monthly reported information regarding median house prices in your local capital city”, said Jane, “but cities are made up of hundreds of suburbs. In some instances you may find that the older more established suburbs with bigger blocks have less properties and less residents compared to the many new development suburbs opening up on the outskirts of town. Just because the median for Brisbane seems cheap, does that mean you can get a blue chip property less than $600,000? The answer is no.” There is a ‘rule of thumb’ which can get you started, but it’s no substitute for hard data.

“Within 10km of the CBD I would add a margin of +20%, and within 20km, 10% of the median. This is because often by the sheer number of suburbs outside the 10km range compared to the number inside can greatly affect the median for those area. That is that there are many cheaper suburbs below the median in the outskirts that will bring the city median down, hence why I add that buffer. Being able to find out though what the real medians are within an area allows you to assess quickly if you can afford within 10km or even 20km of the CBD or if in fact you are looking at the outskirts.”

You can imagine how excited Jane was to learn that we can make that data available. Based on reported sales for 2016, we have profiled all of Australia’s state capitals to help you find an investment property that fits your budget.

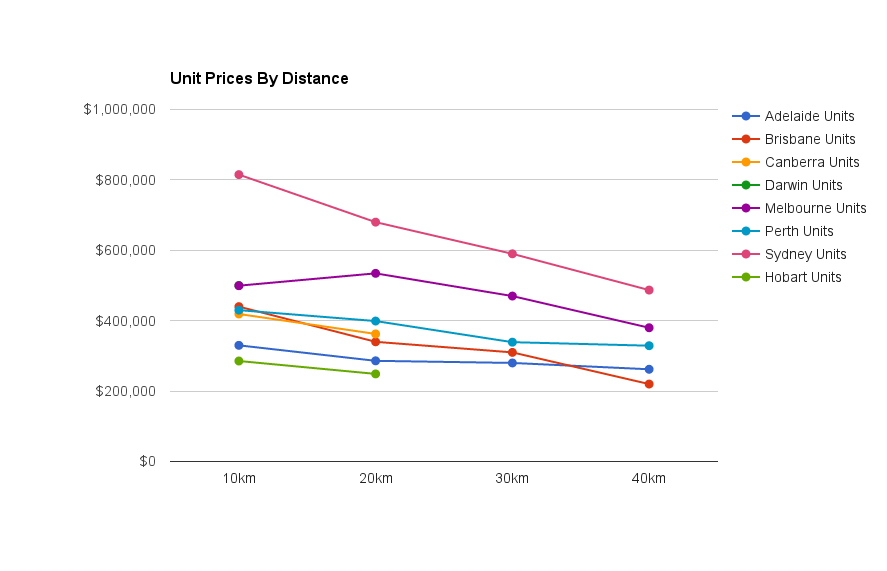
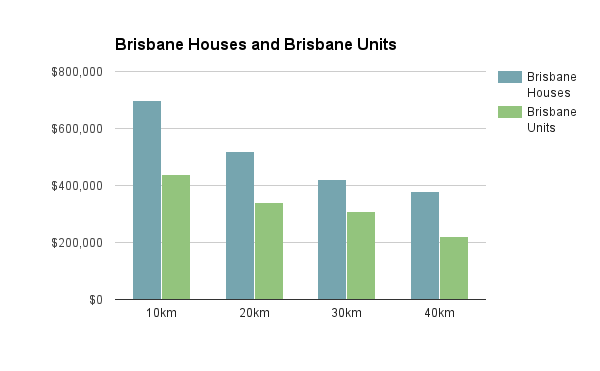
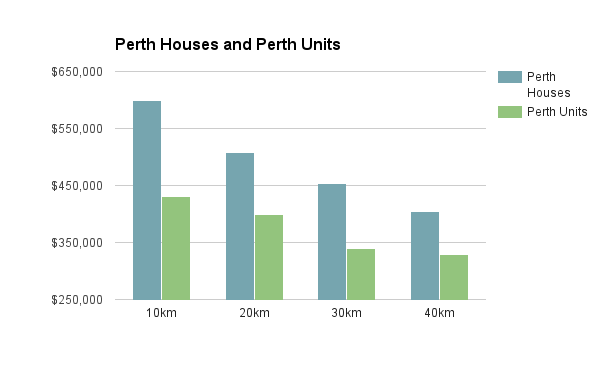
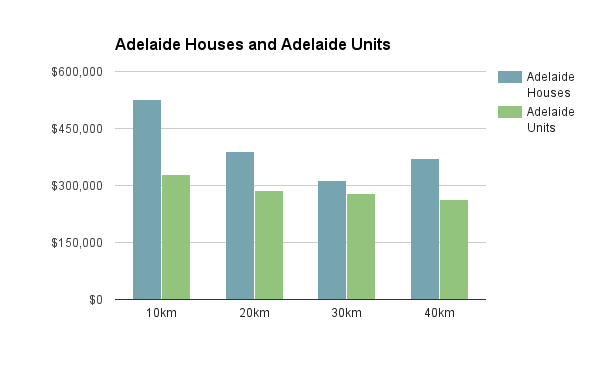
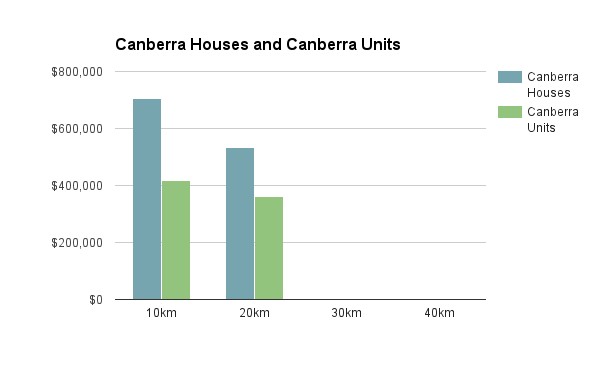
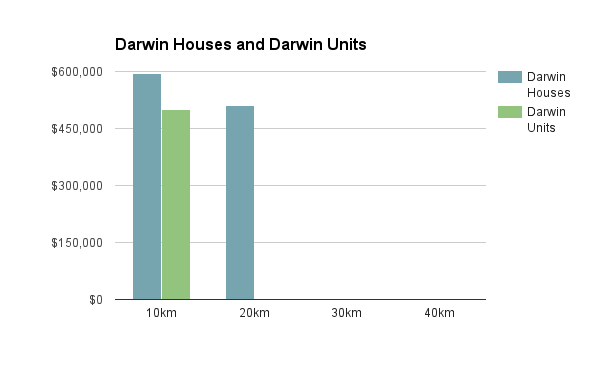
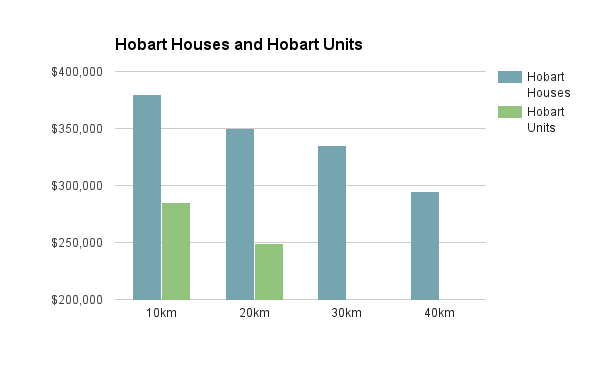
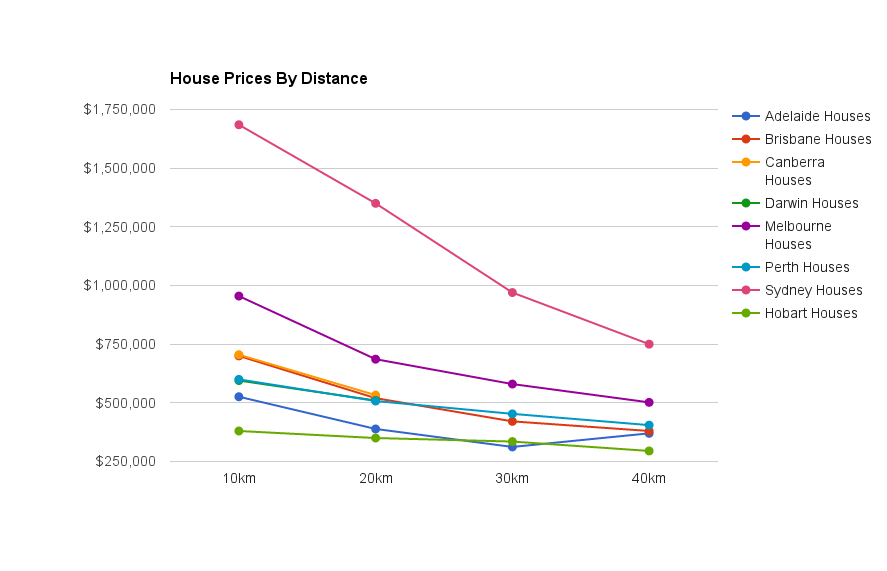
First we’ll look at house prices for all state capitals, grouped by whether they are 0-10km from the centre of the city, 10km-20km and so on. For instance, we can see that if we had a $600,000 budget, we could look at central Perth or Adelaide, 10-20km from the centre of Brisbane or Canberra, 20-30km from the heart of Melbourne and more than 40km from the middle of Sydney.

If we look at units rather than houses, the prices are lower overall and the curves are more closely matched. It’s interesting to see that units in the centre of Melbourne have a lower average price in the 10-20km band. This may be because units a little further out are larger. To normalise for the fact that properties tend to be bigger as we get further from the city, we’ve also done a chart of square metre pricing by distance to the city centre. This is a measure more commonly used with commercial real estate, but is basically just the purchase price divided by the size of the floor space of the property to give a price per square metre. This shows us that properties in the centre of Sydney are actually much more expensive than anywhere else in the country, in terms of the space you get for your money. We also see that distance effects on property prices are fairly uniform elsewhere, once property size is accounted for.

Area Prices

Sydney


Sydney

Sydney
Houses Units per Sq Metre
10 km $1,685,000 $815,000 $6,000
20 km $1,350,000 $680,000 $2,175
30 km $970,000 $590,000 $1,528
40 km $750,000 $487,000 $1,286

Sydney’s peak of $6000 per square metre for residential space within 10km of the city centre is off the charts by national standards. The popularity of downtown Sydney is not just about proximity, but also the harbour and there are plenty of harbour views and even ocean vistas to be had in the 10km inner circle. Sydney’s sprawl extends even beyond the 40 km line, with residential areas 55+km from the city centre.

Melbourne


Melbourne
Houses Units per Sq Metre
10 km $955,000 $499,500 $2,160
20 km $686,000 $534,500 $1,313
30 km $580,000 $470,000 $1,062
40 km $502,000 $380,000 $768

Brisbane


Brisbane
Houses Units per Sq Metre
10 km $700,000 $440,000 $1,192
20 km $520,000 $340,000 $828
30 km $421,000 $310,000 $606
40 km $380,000 $220,000 $490

Perth


Perth

Perth
Houses Units per Sq Metre
10 km $600,000 $430,000 $1,099
20 km $507,750 $399,000 $861
30 km $453,000 $339,000 $697
40 km $405,000 $329,000 $513

Adelaide


Adelaide
Houses Units per Sq Metre
10 km $526,000 $330,000 $998
20 km $388,750 $286,000 $576
30 km $312,000 $280,000 $469
40 km $370,000 $262,000 $437

Canberra


Canberra
Houses Units per Sq Metre
10 km $705,000 $419,000 $939
20 km $532,900 $362,400 $825
30 km
40 km

Darwin


Darwin
Houses Units per Sq Metre
10 km $595,000 $500,000 $698
20 km $510,000 $694
30 km
40 km

Hobart


Hobart
Houses Units per Sq Metre
10 km $380,000 $285,500 $573
20 km $350,000 $248,850 $392
30 km $335,000 $250
40 km $295,000 $210

You can explore any city in Australia with Microburbs. To get started, search in the box below:

For press enquiries about this article, please call Microburbs Founder Luke Metcalfe on 0414 183 210.

RBA Cuts to 1.5% – Big 4 Customers Won’t Benefit, But You Can.

This week has seen the Reserve Bank of Australia cut the cash rate to a historic low of 1.5%. The announcement was not a surprise to many, with low inflation data signalling a likely cut in the lead up to the RBA board meeting.

What has been a surprise is the response from the big four banks. Rather than pass on the full rate cut to their mortgage customers, they reduced their standard variable rates by only half as much as the rate cut, and increased term deposit rates, rather than cutting them. More surprising still, was the swiftness and similarity of announcements by CBA and NAB, with Westpac and ANZ trailing after.


Many have been left feeling frustrated and powerless after being stuck around the 5.3% mark while the cash rate approaches zero. There are alternatives though, which dozens of lenders available outside the big 4 with much fairer rates. Mortgage holders can compare personalised offers from a wide range of lenders in 2 minutes without filling in application forms and navigating red tape. You can even give it a go right now.

It’s easy to brush off the idea of changing lenders for a rate cut as being not worth the hassle, but that couldn’t be further from the truth. A reduction in interest rate brings the power of compound interest over to your side. Every 1% per year on every $100K of your loan is $1000 a year into the household budget. Furthermore though, you save on the compound interest on that. A better rate can mean reaching financial freedom years earlier, building an investment portfolio while paying down your mortgage or having the money to travel again.

Get some offers in 2 minutes and look at how much you could save over the life of your loan.


8 Real Estate Investment Metrics You Need to Understand

With some analysts predicting that real estate price growth may slow down in Sydney and Melbourne, real estate investing in Australia may no longer be all hot markets and high demand. Understanding where markets are hot and cold, fast and slow, is about understanding supply and demand, yield, days on market and OSI. But what does that all even mean?

Microburbs founder, Luke Metcalfe sat down with Jeremy Sheppard from DSR Data to get plain english explanations for the most important real estate investment metrics.  In 2009, after building his career in IT and a portfolio of 16 properties, he launched DSR data to help make property investment more consistent and more effective for more people. Jeremy has been writing articles for Your Investment Property magazine since 2011, educating investors on how to use data to better their returns.

#1  “Vendor Discount”

This is the percentage difference between the original asking price and the eventual sale price. When a seller puts their property on the market, usually via real estate agent, they pick an initial asking price and it’s usually quite optimistic. Eventually the property sells – for a bit lower than that, usually – and that difference is, in percentage terms, your vendor discount. If we take the average vendor discount for all properties in a suburb, we can get a suburb vendor discount. 

Why it matters

In locations where demand exceeds supply you’ll find that the vendor discount becomes quite low. In fact, you can even find that it’s negative where people start offering more than the asking price if they’re fighting over each other to try and get their hands on the limited number of properties that are available. In markets where supply exceeds demand you might find a discount in excess of about 10%, normal markets might be around about 5% and in very tight markets it will be zero or even negative. So the vendor discount is a great indicator of markets where demand exceeds supply.

Days on Market ?

#2  “Days On Market”

This is the average count of the number of days it takes to sell a property once it is listed.

A real estate agent will list a property and people will come and visit it, they’ll look around and eventually someone will make a good offer and the vendor (the seller) will accept that offer and so the listing will be taken off the real estate’s portal etc. That period of time is the days on market.

Why it matters

The days on market generally gets very short in areas where demand exceeds supply. What happens is a whole bunch of people start competing over a small number of properties and they get desperate. They get urgent and so they try and get their due diligence done faster and they make quicker offers. They’re waiting for the next property to come on the market and they jump on it straight away so in high demand, low supply markets the days on market generally gets very small.

A typical sort of days on market might be around about 140 days, or about 3 and a bit months. Where it gets really tight is when you see days on market getting less than about 20 days. In some crazy markets where there is a massive oversupply you might see days on markets exceeding even a full year. So days on markets is a great indicator for demand exceeding supply when it’s a low figure.


Screen Shot 2016-07-17 at 5.44.44 pm

#3 “Auction Clearance Rate”

Is the percentage of auctioned properties that actually sell at the auction or immediately after or just prior, rather than passed in. If bidding is fierce, you’ve got a large number of bidders at an auction, you will always find that the property sells. In markets where demand exceeds supply, that’s sort of typical and you will have very high auction clearance rates.

Why it matters

In markets where supply exceeds demand you’ll find not only a poor auction clearance rate but also less auctions. That’s because real estate agents will typically only choose auctions as a means to selling a property when the market suits it, and when that suits their vendor. So you’ll find high auction clearance rates when demand exceeds supply, low auction clearance rates and low counts of auctions in markets where supply exceeds demand. So the auction clearance rate and the number of properties sold by auction are excellent indicators of demand versus supply.

#4 “Proportion Of Renters To Owner Occupiers”

The proportion of renters to owner occupiers is the percentage of properties with residences that are renting but don’t actually own a property, so this can be a good indicator of supply levels for landlord-owned properties. As a property investor you are also a landlord – you will own property and you’ll rent it out to a tenant.

Why it matters

If you’re competing with other landlords then you may experience extended vacancies. You don’t want to have to compete, so you want to be ideally the only landlord in a local property market. That means you’re looking for markets where there’s a lower percentage of renters and you want most of them to be owner occupiers. Renters typically take less care of their properties than owner occupiers, so you may find the properties devalue a little bit more quickly in markets where there’s a heavy percentage of renters.  Overall you ideally want a market with the lowest possible proportion of renters to owner occupiers.

#5 “Vacancy Rate”

This is the percentage of properties that are available to rent in a suburb that are currently vacant, so if you’ve got about 1000 properties in a suburb, and lets say 300 of them are owned by property investors, rented out to tenants, and then if you have 30 of those that are currently vacant than you have a 10% vacancy rate, which is a whoppingly high vacancy rate.

Why it matters

Vacancy rates are typically around about 2% – 3%. Anything less than about 2% is a helpful margin because as an investor obviously you don’t want to have a property that is vacant for a long period of time. So you’re looking for markets where there’s a vacancy rate as close to zero as possible. If it needs to be checked, a rough figure for vacancy rates, not in percentage terms, can be found by checking the rental pages of suburbs around Australia. See how many rental properties are currently listed, you may see some of them with a statement – available with some future date – so those aren’t currently vacant but they will become vacant and available at that future date. Vacancy rate, then, is a great indicator that property investors can use to make sure that they are going to have good rental income. A very low vacancy rate over an extended period of time will usually start to push yields up. Property managers will keep their eye on the market and they will inform their clients, the landlord, that this market could probably cope with an increase in rent, so low vacancy rates are usually a precursor to increasing rents and yields.

#6 “Yield”

The gross rental yield is the rent achievable in a year, divided by the value of the property as a percentage. Usually, if you’re getting a property for $400 a week in rent and it costs $400,000 in value than that’s typically about a 5% rental yield, in order for a property to be cashflow positive, with long term interest rates of around about 7%, you will need a yield close to about 9% for that to be a positively geared property. The Net Yield is the profit achievable in a year divided by the value of the property. That is, the rent, minus all expenses like rates, strata, financing etc. 

Why it matters

Yield is of course is of great importance to investors because it’s all about cash flow, if you have strong cash flow, you can stay in the game and there’s less risk of you having to sell your property. For those who want to retire on a portfolio of positively geared properties, yield is very important, of course capital growth is the ants pants of investing but yield is what keeps you in the game, so looking for markets with a higher than average yield is usually a good choice for investors. You don’t want to go crazy with it, buying in mining towns or other regional towns that hinge on one industry because they could evaporate overnight. The yield, in general, you want to healthy. You don’t want to be buying in markets with a ridiculously low yield like 2.5% – 3%. The average nowadays is about 4% – 4.5% so anything about 5% or up is a healthy sign.

#7 “Stock On Market Percentage”

Is the number of properties that are currently listed for sale, as a percentage of the total number of properties in a market.This is a great indicator of supply in a market. You want low supply, high demand and the percentage stock is your supply indicator. You want this figure to be as low as possible, ideally 0%. That would mean that there are no properties currently available for sale, which of course makes it hard to enter the market.

Why it matters

The stock on market percentage typically is around about 1%. Ideally you want that, of course, to be lower. Some markets that are quite dangerous will have stock on market percentage of even 5% which is like 1 in 20 properties currently for sale. Stock on market percentage can be a little bit volatile from or time to time, so you need to look at a historical chart and just make sure that the long term average, at least over the last few months, is relatively stable. Stock on market is used in the Jeremy’s Demand Supply Ratio to measure supply. For a growth area, you want a high demand matched with the supply, just having low supply isn’t the only side of the equation, you also need high demand as well.

#8 “Online Search Interest”

This is a figure where the number of people searching for property online is compared with the number of properties available online. You want the most number of people searching for property (that represents demand) and the least number of property available for sale, which represents the supply.

Why it matters

The online search interest or OSI for short is a mini demand versus supply ratio, it’s only one statistic and it can suffer from some anomalies but overall it’s not a bad indicator and when combined with other statistics it can be quite useful for investors targeting locations with high demand versus supply.

Have you found some of these useful when you invested?


If you’re ready to find your investment property go to microburbs.com.au to find the next neighourhood ready to boom!


For press enquiries about this article, please call Microburbs Founder Luke Metcalfe on 0414 183 210.