
Recent sales and current listings for Battery Point. Hover a row to locate the property on the map.
97
Recent sales (3 yrs)
28
Currently for sale
$725
Avg weekly rent (houses)
$1.13M
Median sale (3 yrs)
| Address | Type | Bd | Ba | Sale price | Yield |
|---|---|---|---|---|---|
| 55 Salamanca Square | Unit | 3 | 2 | $3,100,000 | 👎0.5% |
| 6 Napoleon Street | House | 2 | 1 | $1,010,000 | 👍3.4% |
| 36-38 Hampden Road | House | 2 | 2 | $1,600,000 | 👎1% |
| 36 Hampden Road | House | 2 | 2 | $1,600,000 | 👎1% |
| 10 Kelly Street | House | 2 | 2 | $2,000,000 | 👎1.8% |
| 11 Clarke Avenue | House | 3 | 2 | $2,065,000 | 👎0.8% |
| 99 Hampden Road | House | 5 | 3 | $2,075,000 | 👎0.8% |
Each row is a price driver in Battery Point. Tap to expand. Map on the left shows Microburb-level detail — toggle a row to switch the layer.
Environmental, infrastructure and social risks for Battery Point, with the matched capital-growth association where we have a measured study. 4 flagged · 17 tracked.
Amenities, environment, and liveability in Battery Point. 1 km from CBD · 150 amenities.
Population, housing tenure, and census indicators
Battery Point business directory
No single industry dominates. Mix tracks the broader market.
Distinctive local venuesgrouped by category
6 businesses in this suburb classified as bar. Examples: The Den, Cargo Bar Pizza Lounge, Society Salamanca. That is roughly 38x more common than in a typical Australian suburb.
4 businesses in this suburb classified as apartments. Examples: The Waterfront, The Silos Apartments. That is roughly 8.1x more common than in a typical Australian suburb.
10 businesses in this suburb classified as hotel. That is roughly 7.3x more common than in a typical Australian suburb.
3 businesses in this suburb classified as office. That is roughly 5.7x more common than in a typical Australian suburb.
On the busiest residential street, Hampden Rd, the median house price sits at $1.84m. Every 4.9 years (average turnover).
Built from the local business directory of every Australian suburb. Read the study ›
TAS 7004 · Data as of 8 Oct 2026
Toggle map layers (multi-select). Click any row for detail.
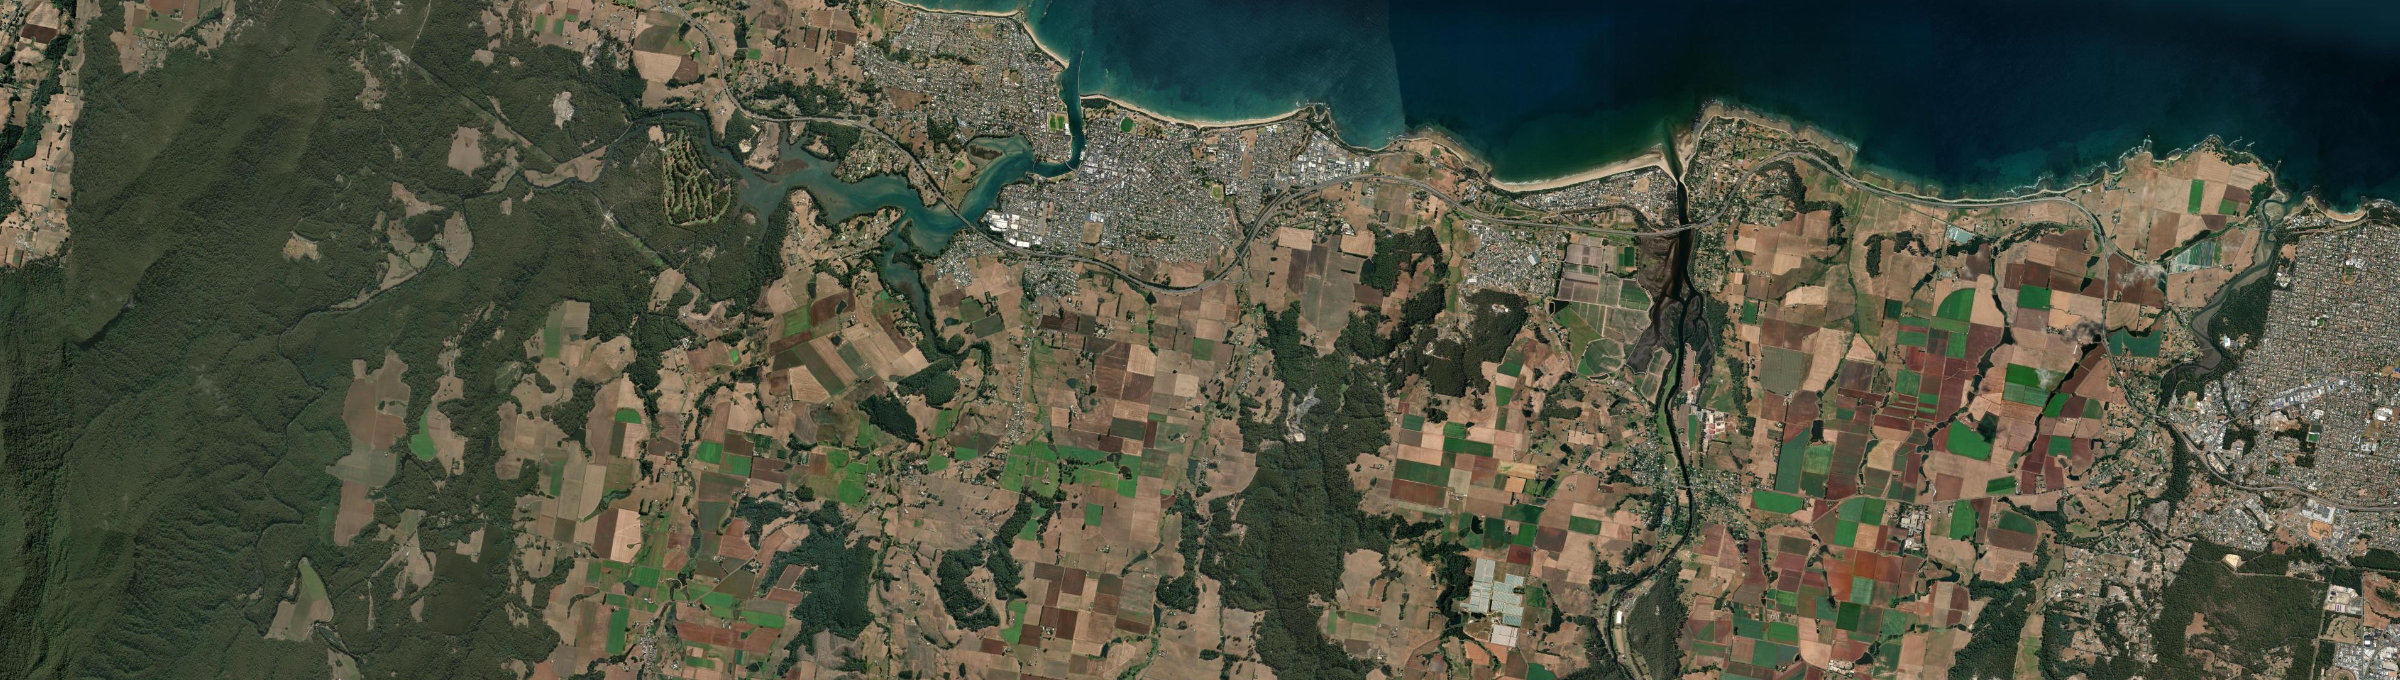
Aerial view
Data as of 24 Oct 2026
Our forecasts identify suburbs that will outperform the 7% national average with 85% accuracy
Past growth comparison over 1, 3, 5, and 10 years
118 streets listed (118 with 2-8yr forecast, model cutoff 24 Oct 2026) in Ulverstone, TAS · West and North West Tas · Growth 2013 to 2026
| Street | Current Price | Past Growth/yr | 4yr Forecast/yr | 8yr Forecast/yr | Confidence | Houses | Units | Rent/wk | Sales Turnover | Rental Turnover | Renters |
|---|---|---|---|---|---|---|---|---|---|---|---|
| Main Street | $609k | +3.5%/yr👎 | High | 108 | 59 | $499/wk | 11.1yr👍 | 7.4yr | 19%👎 | ||
| Leven Street | $574k | +4.2%/yr👎 | High | 75 | 20 | $559/wk | 10.1yr | 7.1yr | 25%👎 | ||
| Risby Street | $688k | +3.8%/yr👎 | High | 51 | 7 | $570/wk | 10.6yr | 7yr | 17%👎 | ||
| Eastland Drive | $599k | +4.5%/yr👎 | High | 60 | 11 | $553/wk | 14.8yr👍 | 5.3yr👎 | 32%👎 | ||
| William Street | $503k | +3.3%/yr👎 | High | 42 | 13 | $478/wk | 10.4yr | 5.2yr👎 | 12% |
Price, size, and type mix by bedroom count in Ulverstone
| Beds | House Price | Unit Price | Recent Sales | Median Baths | Median Land |
|---|---|---|---|---|---|
| 2 bed | $515k | $480k | 1,913 | 1 | 230 sqm |
| 3 bed | $580k | $672k | 5,305 | 1 | 728 sqm |
| 4 bed | $750k | — | 1,788 | 2 | 857 sqm |
| 5 bed | — | — | 224 | 2 | 1,012 sqm |
Last 4 weeks of smart median data
| Week | House Price | Chg | Unit Price | Chg | Median Rent/wk | Chg |
|---|---|---|---|---|---|---|
| 04 Oct 2026 | $600k | +0.00% | $505k | +0.00% | $475 | +0.00% |
| 11 Oct 2026 | $592k | ▼ -1.33% | $505k | +0.00% | $475 | +0.00% |
| 18 Oct 2026 | $600k | ▲ +1.35% | $512k | ▲ +1.39% | $475 | +0.00% |
| 25 Oct 2026 | $615k |
| ▲ +2.50% |
| $509k |
| ▼ -0.59% |
| $475 |
| +0.00% |