
Recent sales and current listings for St Kilda (Vic.). Hover a row to locate the property on the map.
1,444
Recent sales (3 yrs)
257
Currently for sale
$900
Avg weekly rent (houses)
$560k
Median sale (3 yrs)
| Address | Type | Bd | Ba | Sale price | Yield |
|---|---|---|---|---|---|
| Unit 17, 13 Crimea Street | Unit | 1 | 1 | $350,000 | 👍6.5% |
| Unit 2, 20 Crimea Street | Unit | 2 | 1 | $522,500 | 👍3% |
| Unit 302, 78 Inkerman Street | Unit | 1 | 1 | $420,000 | 👍4.5% |
| Unit 4, 2a Robe Street | Unit | 1 | 1 | $401,000 | 👍5.3% |
| 71 Chapel Street | House | 4 | 3 | $2,950,000 | 👎0.5% |
| Unit 101, 18 Grey Street | Unit | 1 | 1 | $408,000 | 👍6.3% |
| Unit 29, 149 Fitzroy Street | Unit | 1 | 1 | $520,000 | 👍5.1% |
Each row is a price driver in St Kilda (Vic.). Tap to expand. Map on the left shows Microburb-level detail — toggle a row to switch the layer.
Population, housing tenure, and census indicators
Amenities, environment, and liveability in St Kilda (Vic.). 6 km from CBD · 0 amenities.
Environmental, infrastructure and social risks for St Kilda (Vic.), with the matched capital-growth association where we have a measured study. 6 flagged · 17 tracked.
VIC 3182 · Data as of 20 Oct 2026
Toggle map layers (multi-select). Click any row for detail.
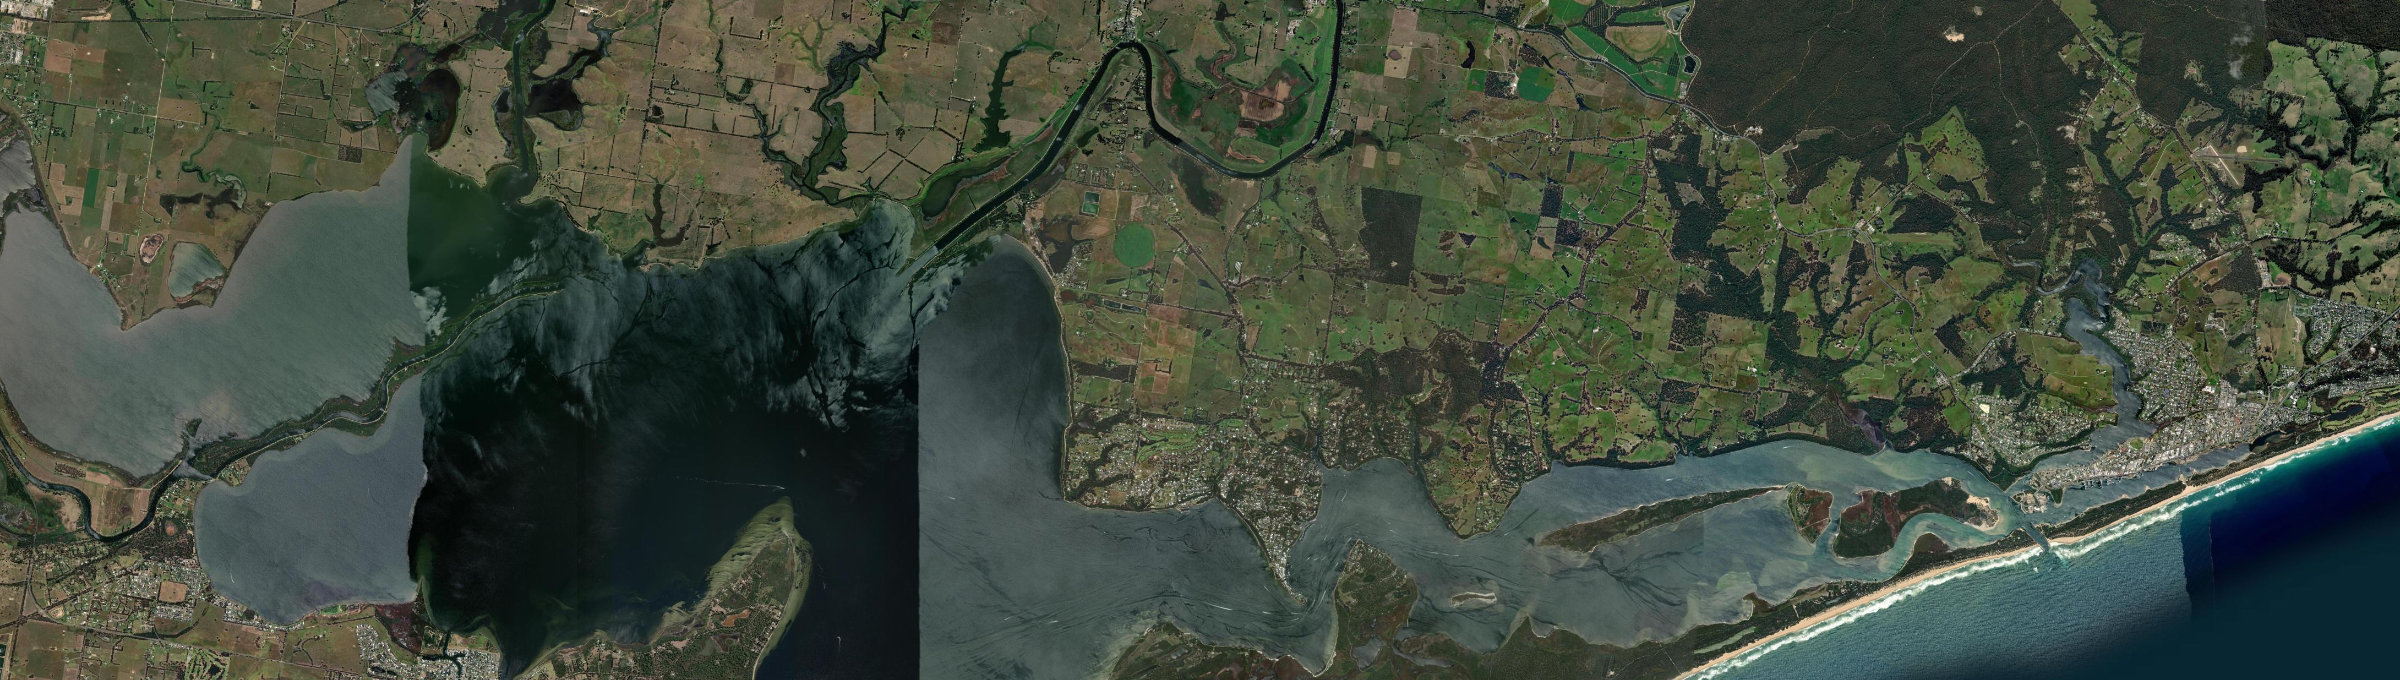
Aerial view
Data as of 25 Oct 2026
Our forecasts identify suburbs that will outperform the 7% national average with 85% accuracy
Past growth comparison over 1, 3, 5, and 10 years
90 streets listed (90 with 2-8yr forecast, model cutoff 25 Oct 2026) in Metung, VIC · Latrobe · Growth 2013 to 2026
| Street | Current Price | Past Growth/yr | 4yr Forecast/yr | 8yr Forecast/yr | Confidence | Houses | Units | Rent/wk | Sales Turnover | Rental Turnover | Renters |
|---|---|---|---|---|---|---|---|---|---|---|---|
| Stirling Road | $904k | +4%/yr👎 | High | 76 | 10 | $403/wk | 10.8yr | 7yr👍 | 13%👎 | ||
| Kings Cove | $800k | +5.1%/yr👎 | High | — | — | — | — | — | — | ||
| Mairburn Road | $468k | +1.5%/yr👍 | High | 36 | 44 | $751/wk | 7.7yr👎 | 2.8yr👎 | 7%👎 | ||
| Plateau Avenue | $937k | +4.9%/yr👎 | High | 33 | 0 | $484/wk | 10yr | 5yr | 18%👎 | ||
| Metung Road | $1.4M | +4.1%/yr👎 | High | 41 | 42 | $433/wk | 9.2yr👎 | 6.9yr👍 | 7%👎 |
Price, size, and type mix by bedroom count in Metung
| Beds | House Price | Unit Price | Recent Sales | Median Baths | Median Land |
|---|---|---|---|---|---|
| 2 bed | $506k | $98k | 900 | 1 | 935 sqm |
| 3 bed | $620k | — | 2,839 | 2 | 1,170 sqm |
| 4 bed | $738k | — | 1,346 | 2 | 1,549 sqm |
| 5 bed | $1.0M | — | 269 | 3 | 4,019 sqm |
Last 4 weeks of smart median data
| Week | House Price | Chg | Unit Price | Chg | Median Rent/wk | Chg |
|---|---|---|---|---|---|---|
| 04 Oct 2026 | $602k | ▲ +0.33% | $125k | +0.00% | $500 | +0.00% |
| 11 Oct 2026 | $603k | ▲ +0.17% | $158k | ▲ +26.40% | $500 | +0.00% |
| 18 Oct 2026 | $603k | +0.00% | $158k | +0.00% | $500 | +0.00% |
| 25 Oct 2026 | $615k |
| ▲ +1.99% |
| $158k |
| +0.00% |
| $500 |
| +0.00% |