
Recent sales and current listings for Glenelg (SA). Hover a row to locate the property on the map.
213
Recent sales (3 yrs)
39
Currently for sale
$688
Avg weekly rent (houses)
$800k
Median sale (3 yrs)
| Address | Type | Bd | Ba | Sale price | Yield |
|---|---|---|---|---|---|
| Apartment 19, 18 Raymond Grove | Unit | 2 | 1 | $612,000 | 2.6% |
| 1d Maturin Road | Townhouse | 4 | 3 | $1,680,000 | 👎1% |
| Unit 611, 16 Holdfast Promenade | Unit | 1 | 1 | $670,000 | 2.4% |
| Apartment 80, 33 Colley Terrace | Unit | 2 | 1 | $870,000 | 👎1.8% |
| Unit 3, 48 Partridge Street | Unit | 2 | 1 | $930,000 | 👎1.7% |
| 35 Gordon Street | House | 6 | 2 | $1,760,000 | 👎0.9% |
| 35-37 Gordon Street | House | 6 | 2 | $1,760,000 | 👎0.9% |
Environmental, infrastructure and social risks for Glenelg (SA), with the matched capital-growth association where we have a measured study. 5 flagged · 17 tracked.
Each row is a price driver in Glenelg (SA). Tap to expand. Map on the left shows Microburb-level detail — toggle a row to switch the layer.
Amenities, environment, and liveability in Glenelg (SA). 11 km from CBD · 0 amenities.
Population, housing tenure, and census indicators
SA 5045 · Data as of 6 Aug 2026
Toggle map layers (multi-select). Click any row for detail.
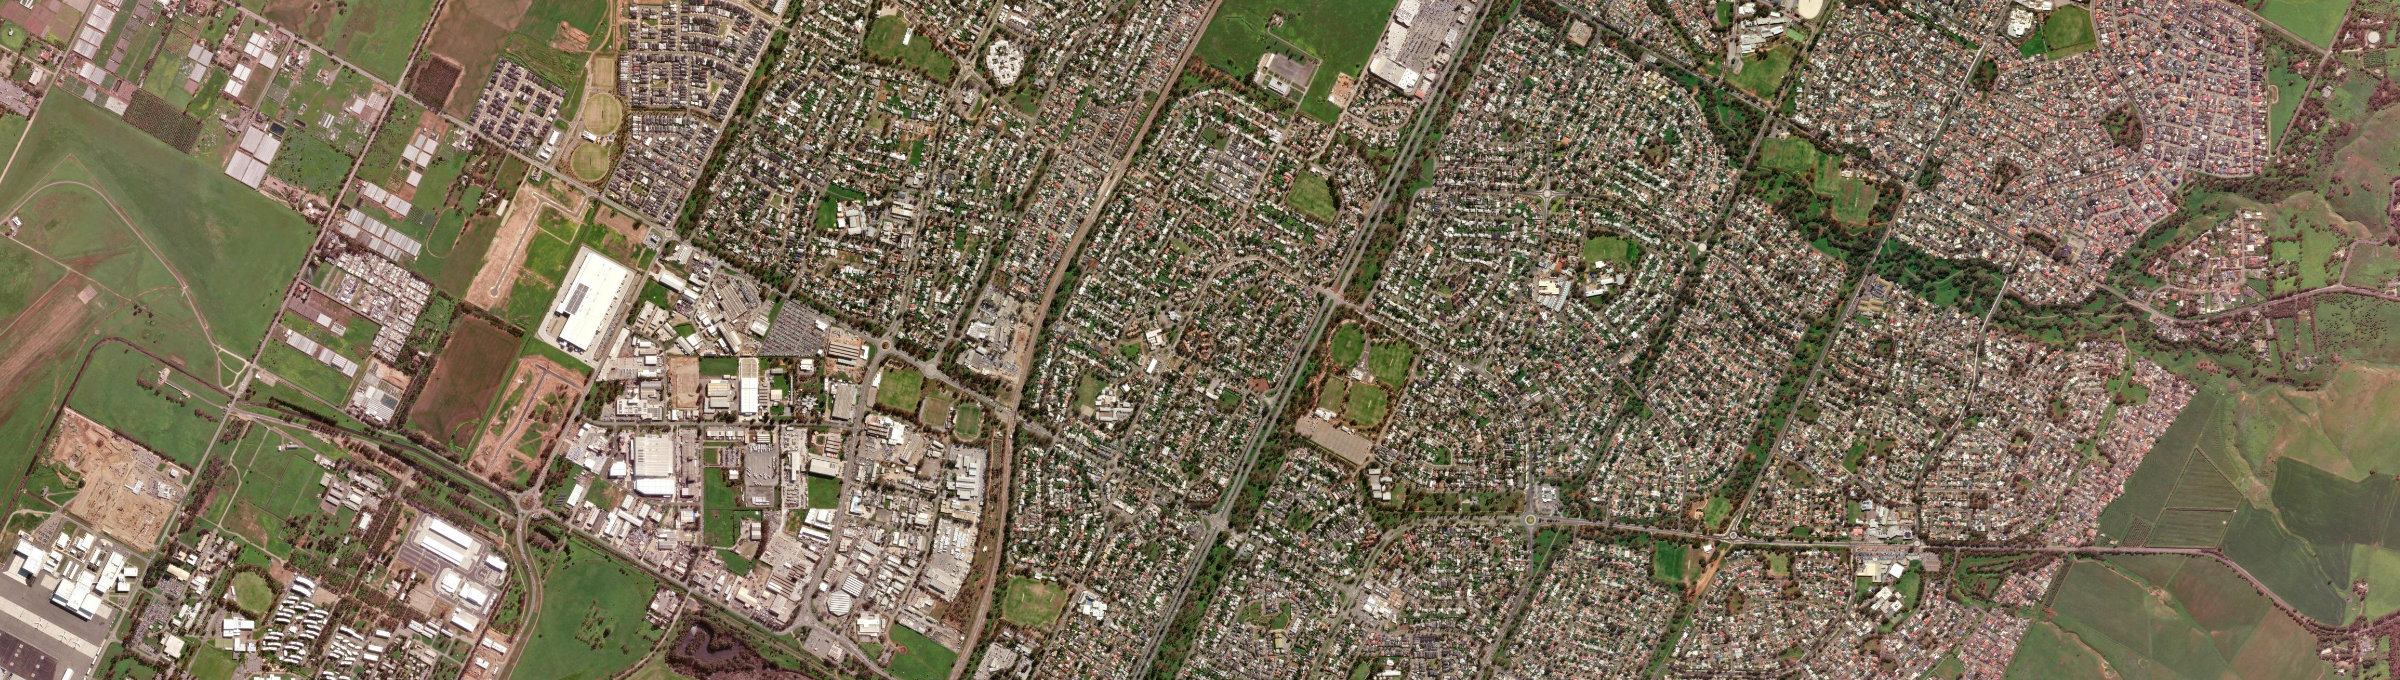
Aerial view
Data as of 24 Oct 2026
Our forecasts identify suburbs that will outperform the 7% national average with 85% accuracy
Past growth comparison over 1, 3, 5, and 10 years
53 streets listed (53 with 2-8yr forecast, model cutoff 24 Oct 2026) in Elizabeth North, SA · Adelaide · Growth 2013 to 2026
| Street | Current Price | Past Growth/yr | 4yr Forecast/yr | 8yr Forecast/yr | Confidence | Houses | Units | Rent/wk | Sales Turnover | Rental Turnover | Renters |
|---|---|---|---|---|---|---|---|---|---|---|---|
| Donnington Road | $598k | +5.1%/yr👎 | High | 77 | 2 | $480/wk | 12yr | 2.8yr | 52%👎 | ||
| Woodford Road | $654k | +5%/yr👎 | High | 93 | 72 | $481/wk | 14.5yr👍 | 3.3yr | 49%👎 | ||
| Old Sarum | $547k | +5%/yr👎 | High | — | — | — | — | — | — | ||
| Knighton Road | $525k | +5.1%/yr👎 | High | 64 | 20 | $483/wk | 12.4yr👍 | 4.4yr👍 | 21%👍 | ||
| Tilshead Road | $503k | +4.9%/yr👎 | High | 52 | 6 | $470/wk | 12.3yr | 3.2yr | 37% |
Price, size, and type mix by bedroom count in Elizabeth North
| Beds | House Price | Unit Price | Recent Sales | Median Baths | Median Land |
|---|---|---|---|---|---|
| 2 bed | $552k | — | 777 | 1 | 516 sqm |
| 3 bed | $595k | — | 6,612 | 1 | 625 sqm |
| 4 bed | $725k | — | 547 | 1 | 794 sqm |
Last 4 weeks of smart median data
| Week | House Price | Chg | Unit Price | Chg | Median Rent/wk | Chg |
|---|---|---|---|---|---|---|
| 04 Oct 2026 | $599k | ▲ +0.50% | — | — | $492 | ▲ +3.58% |
| 11 Oct 2026 | $602k | ▲ +0.50% | — | — | $500 | ▲ +1.63% |
| 18 Oct 2026 | $600k | ▼ -0.33% | — | — | $475 | ▼ -5.00% |
| 25 Oct 2026 | $600k | +0.00% | — | — | $475 | +0.00% |