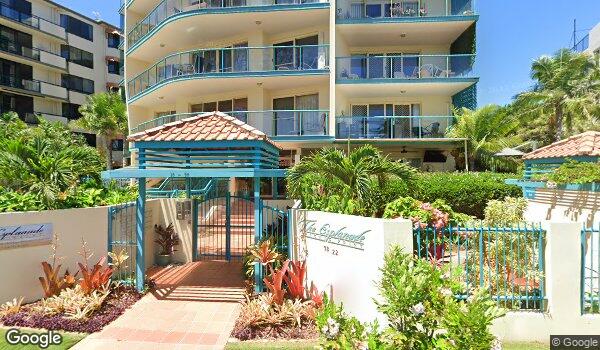
This report zooms in on Unit 13, 18-22 Picnic Point Esplanade. For the whole-of-suburb picture — every street, market trends, demographics and more — see the full Maroochydore suburb report.
See more data — Maroochydore suburb reportEach row is a price driver in Belmont North. Tap to expand. Map on the left shows Microburb-level detail — toggle a row to switch the layer.
Amenities, environment, and liveability in Belmont North. 14 km from CBD · 43 amenities.
Weekly rent, gross yield, 3-year rent growth and vacancy painted per microburb — toggle any layer to update the map.
Environmental, infrastructure and social risks for Belmont North, with the matched capital-growth association where we have a measured study. 10 flagged · 17 tracked.
Population, housing tenure, and census indicators
Belmont North business directory
Mostly residential, too few businesses to identify a market pattern.
The local business mix below shows what is distinctive in this suburb regardless.
Distinctive local venuesgrouped by category
4 businesses in this suburb classified as petrol station. Examples: Ampol, Belmont North, 7-Eleven Belmont North. That is roughly 8.9x more common than in a typical Australian suburb.
5 businesses in this suburb classified as school combined. Examples: Belmont Christian College, Belmont Christian College Limited, Belmont North Public School P& C Association. That is roughly 3.6x more common than in a typical Australian suburb.
3 businesses in this suburb classified as hairdresser. That is roughly 2.7x more common than in a typical Australian suburb.
On the busiest residential street, Wommara Ave, the median house price sits at $924k. Every 5.9 years (quite tightly held).
Built from the local business directory of every Australian suburb. Read the study ›
Recent sales and current listings within 1 km of this property. Hover a row to locate it on the map.
30
Recent sales (3 yrs)
16
Currently for sale
$675
Avg weekly rent (houses)
$1.19M
Median sale (3 yrs)
| Address | Type | Bd | Ba | Sale price | Date sold | |
|---|---|---|---|---|---|---|
| Unit 1, 28 Calverton Crescent | Townhouse | 3 | 1 | $845,000 | 10 Nov 2026 | |
| 7 Brabham Close | House | 3 | 2 | $1,190,000 | 1 Sep 2026 | |
| Unit 1, 141 Floraville Road | House | — | — | $1,340,000 | 24 Aug 2026 | |
| 7 Seacroft Close | House | 5 | 3 | $1,258,000 | 18 Aug 2026 | |
| 139b Floraville Road | Land | 0 | 0 | $820,000 | 30 Jul 2026 | |
| 90 Floraville Road | House | 3 | 1 | $900,000 | 23 Jul 2026 | |
| 11 Rengor Close | House | 3 | 2 | $1,200,000 | 9 Jul 2026 |
Property previous listings
NSW 2280 · Data as of 6 Nov 2026
Toggle map layers (multi-select). Click any row for detail.
The lot, the sales history and current listing, and how the property stacks up as an investment.
The microburb at Unit 13, 18-22 Picnic Point Esplanade is rated low NG exposure, limited concentrated selling pressure from the federal budget's 12 May 2026 restrictions. Scored from 3 ATO-calibrated investor candidates, see the negative-gearing exposure summary for the methodology.
This treats local homes as investments — an owner-occupied property here would be negatively geared too if it were bought and rented out at typical local numbers.
218 streets listed in Maroochydore, QLD · Sunshine Coast · Growth 2013 to 2026
| Street | Current Price | Past Growth/yr | 4yr Forecast/yr | 8yr Forecast/yr | Confidence | Houses | Units | Rent/wk | Sales Turnover | Rental Turnover | Renters |
|---|---|---|---|---|---|---|---|---|---|---|---|
| Bradman Avenue | $1.4M | +3.8%/yr👎 | High | 123 | 460 | $898/wk | 9.3yr👎 | 4.3yr | 42% | ||
| Duporth Avenue | $977k | +4.2%/yr👎 | High | 104 | 909 | $709/wk | 11.4yr👎 | 5.3yr👍 | 29%👍 | ||
| Broadwater Avenue | $1.4M | +3.2%/yr | High | 104 | 249 | $704/wk | 11.7yr👎 | — | 52%👎 | ||
| Tepequar Drive | $1.6M | +4.3%/yr👎 | High | 138 | 27 | $912/wk | 15.1yr👍 | 4.8yr | 36%👍 | ||
| Bedarra Circuit | $1.2M | — | High | 74 | 0 | $805/wk | 5yr👎 | 6.6yr👍 | 39%👍 |
Last 4 weeks of smart median data
| Week of | House Price | Chg | Unit Price | Chg | Median Rent/wk | Chg |
|---|---|---|---|---|---|---|
| 19 Oct 2026 | $1.32M | +0.00% | $920k | +0.00% | $850 | +0.00% |
| 26 Oct 2026 | $1.32M | +0.00% | $919k | ▼ -0.11% | $850 | +0.00% |
| 02 Nov 2026 | $1.32M | +0.00% | $918k | ▼ -0.11% | $850 | +0.00% |
| 09 Nov 2026 | $1.33M |
| ▲ +0.76% |
| $915k |
| ▼ -0.33% |
| $850 |
| +0.00% |
Data as of 12 Nov 2026