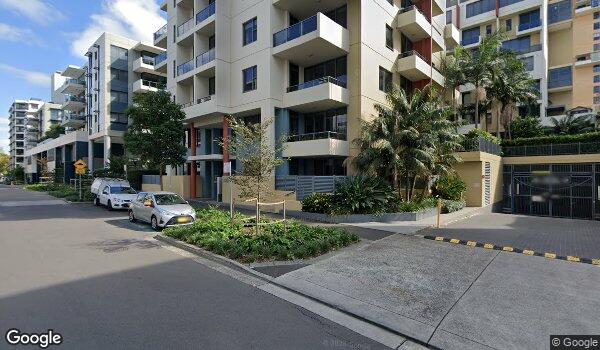
This report zooms in on 28 Danks Street. For the whole-of-suburb picture — every street, market trends, demographics and more — see the full Waterloo suburb report.
See more data — Waterloo suburb reportEach row is a price driver in Belmont North. Tap to expand. Map on the left shows Microburb-level detail — toggle a row to switch the layer.
Amenities, environment, and liveability in Belmont North. 14 km from CBD · 43 amenities.
Environmental, infrastructure and social risks for Belmont North, with the matched capital-growth association where we have a measured study. 10 flagged · 17 tracked.
Weekly rent, gross yield, 3-year rent growth and vacancy painted per microburb — toggle any layer to update the map.
Recent sales and current listings within 1 km of this property. Hover a row to locate it on the map.
30
Recent sales (3 yrs)
16
Currently for sale
$675
Avg weekly rent (houses)
$1.19M
Median sale (3 yrs)
| Address | Type | Bd | Ba | Sale price | Date sold | |
|---|---|---|---|---|---|---|
| Unit 1, 28 Calverton Crescent | Townhouse | 3 | 1 | $845,000 | 10 Nov 2026 | |
| 7 Brabham Close | House | 3 | 2 | $1,190,000 | 1 Sep 2026 | |
| Unit 1, 141 Floraville Road | House | — | — | $1,340,000 | 24 Aug 2026 | |
| 7 Seacroft Close | House | 5 | 3 | $1,258,000 | 18 Aug 2026 | |
| 139b Floraville Road | Land | 0 | 0 | $820,000 | 30 Jul 2026 | |
| 90 Floraville Road | House | 3 | 1 | $900,000 | 23 Jul 2026 | |
| 11 Rengor Close | House | 3 | 2 | $1,200,000 | 9 Jul 2026 |
Property previous listings
NSW 2280 · Data as of 6 Nov 2026
Toggle map layers (multi-select). Click any row for detail.
The lot, the sales history and current listing, and how the property stacks up as an investment.
Subdivision potential isn't assessed here.
The microburb at 28 Danks Street is rated high NG exposure, under the federal budget restrictions on new negative-gearing claims (12 May 2026), areas with concentrated NG holdings face heavier selling pressure as those holders re-price. Scored from 11 ATO-calibrated investor candidates, see the negative-gearing exposure summary for the methodology.
This treats local homes as investments — an owner-occupied property here would be negatively geared too if it were bought and rented out at typical local numbers.
Population, housing tenure, and census indicators
Belmont North business directory
Mostly residential, too few businesses to identify a market pattern.
The local business mix below shows what is distinctive in this suburb regardless.
Distinctive local venuesgrouped by category
4 businesses in this suburb classified as petrol station. Examples: Ampol, Belmont North, 7-Eleven Belmont North. That is roughly 8.9x more common than in a typical Australian suburb.
5 businesses in this suburb classified as school combined. Examples: Belmont Christian College, Belmont Christian College Limited, Belmont North Public School P& C Association. That is roughly 3.6x more common than in a typical Australian suburb.
3 businesses in this suburb classified as hairdresser. That is roughly 2.7x more common than in a typical Australian suburb.
On the busiest residential street, Wommara Ave, the median house price sits at $924k. Every 5.9 years (quite tightly held).
Built from the local business directory of every Australian suburb. Read the study ›
43 streets listed in Waterloo (NSW), NSW · Sydney · Growth 2013 to 2026
Last 4 weeks of smart median data
| Week of | House Price | Chg | Unit Price | Chg | Median Rent/wk | Chg |
|---|---|---|---|---|---|---|
| 19 Oct 2026 | $1.61M | +0.00% | $890k | +0.00% | — | — |
| 26 Oct 2026 | $1.62M | ▲ +0.62% | $880k | ▼ -1.12% | — | — |
| 02 Nov 2026 | $1.61M | ▼ -0.62% | $880k | +0.00% | — | — |
| 09 Nov 2026 | $1.61M | +0.00% | $880k | +0.00% | — | — |
Data as of 12 Nov 2026