Why We Publish Weekly. And Why It Matters for Your Investment
By the time a monthly report hits your inbox, the hottest suburbs have already peaked. Microburbs tracks investor search behaviour every week. You act on signals while they are still signals. Not headlines.
Every Monday, Microburbs publishes a fresh ranking of suburbs attracting the most investor research on our platform. Not quarterly. Not monthly. Weekly. That cadence is deliberate. It is the single most important feature of this report.
Australian property investment moves fast. A suburb can go from overlooked to oversaturated in six to eight weeks. A new infrastructure announcement, a media feature, or a viral social post can shift search volumes in days. Monthly reports can only tell you what was happening. Not what is happening right now.
This week's data covers the seven days to 24 February 2026. It shows exactly why the weekly cadence matters. One suburb went from absent in our top 25 last week to claiming the number one position this week. A rank change of positive 387. Another suburb has held a top-five position for thirty consecutive days. That suggests it has moved from emerging opportunity to established consensus. These are very different investment signals. And you can only tell them apart if you watch every week.
Monthly reports are rearview mirrors. Weekly data is a windshield. A suburb that just entered investor consciousness and one that has held the top five for four weeks tell you very different things about how the market is thinking right now.
This Week's Biggest Story: Clyde North ▲387
If you only read a monthly report, Clyde North in Melbourne's outer south-east growth corridor would have barely registered. It was not in our top 25 last week. This week, it is number one.
“Clyde North wasn't in the top 25 last week. This week it's #1. It captured 1.7% of all investor searches across the country in a single seven-day period.”
A rank change of positive 387 is not marginal. It signals a step-change in investor attention and reveals that something about Clyde North has caught the market's eye. The question for investors right now: what is driving this sudden surge of interest?
Clyde North sits in the City of Casey, one of Australia's fastest-growing local government areas. The suburb is relatively young. Significant land releases are still under way, so stock availability remains reasonable. Infrastructure investment in schools, retail, and transport links continues to mature. For investors who prefer to enter before a suburb becomes a household name, a positive 387 rank change in a single week is the kind of early signal that is very hard to catch without weekly data.
The remaining top-five 7-day suburbs round out the picture. Berwick (▲37), Alfredton (▼2), Point Cook (▲1), and Officer (NEW entry) show Melbourne's south-east and outer west corridors dominating current investor search behaviour. Officer's appearance as a brand-new entry this week echoes Clyde North's trajectory. Worth monitoring closely over the next two to three weeks.
When a suburb jumps from outside the top 25 to number one in a single week, it is one you something significant about where investor attention is shifting. Clyde North is at the very beginning of its investor attention curve. Whether that attention becomes sustained interest, or dissipates as quickly as it arrived, will be visible in next week's data.
Reading the 7-Day vs 30-Day Divergence
The most powerful analytical tool in this report is the comparison between the 7-day ranking and the 30-day ranking. These two tables tell fundamentally different stories. The divergence between them is where the real insight lives.
Here is the framework. A suburb that ranks highly on the 7-day table but does not appear in the 30-day top 10 has just entered investor consciousness. A suburb at the top of the 30-day table that has slipped in the 7-day ranking has sustained attention but is now cooling relative to newer entrants. A suburb appearing in both tables simultaneously is a consistent performer. Demand has been building for weeks with no sign of slowing.
This week's data gives us three clear examples of each signal type:
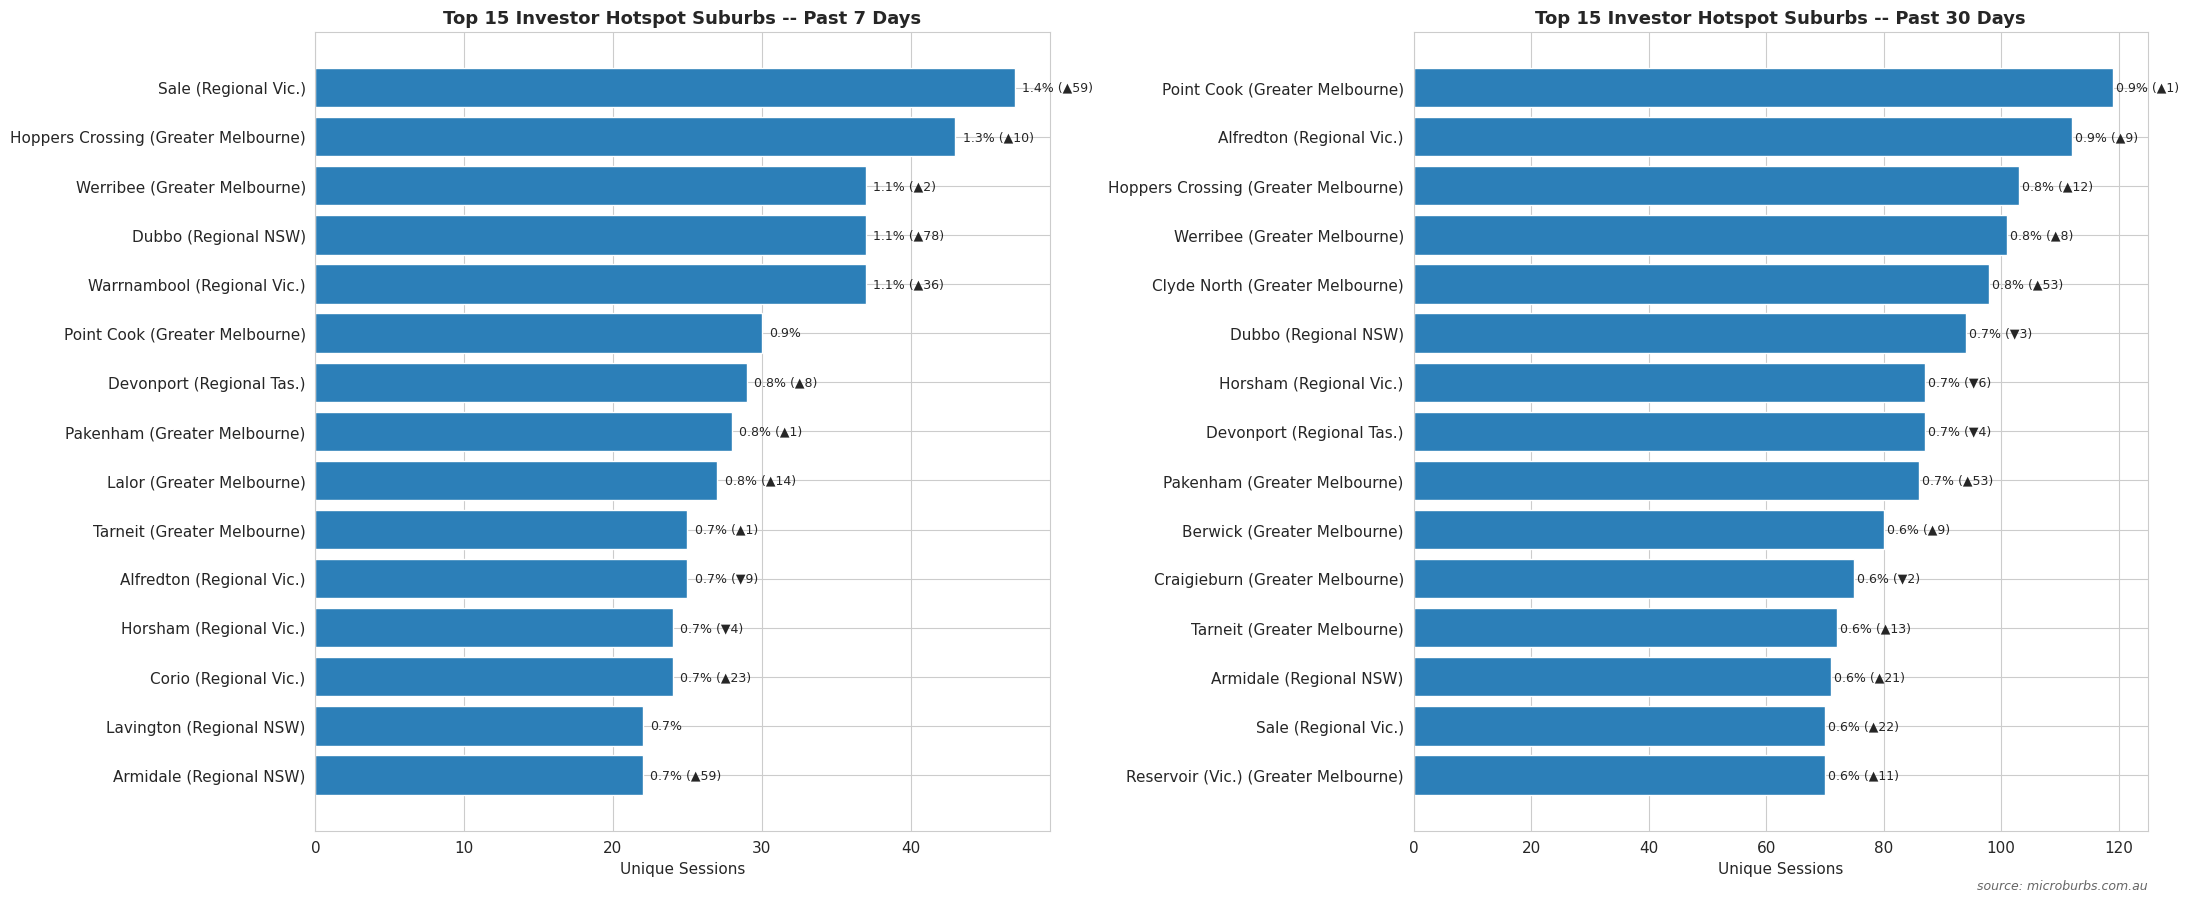
7-day rank: #1. 30-day rank: #5. Absent from the top 25 just last week. This suburb has just entered the investor conversation. The opportunity window is open but may be brief.
30-day rank: #1. 7-day rank: #4. Point Cook has led investor searches for a full month. That sustained attention means more investors already know about it. Newer entrants are drawing attention away.
7-day rank: #3. 30-day rank: #2. Alfredton in Ballarat has held a top-three position across both timeframes. This is not a flash of interest. It reflects deep, sustained investor conviction.
The full 30-day top seven tells a broader story. Point Cook (#1), Alfredton (#2), Hoppers Crossing (#3), Werribee (#4), Clyde North (#5), Horsham (#6), and Devonport in Tasmania (#7). Melbourne's outer west corridor, regional Victoria, and regional Tasmania are all competing for investor attention at once. That breadth of geographic interest is itself a meaningful data point. We explore it in the regional section below.
| 30-Day Rank | Suburb | Region | 7-Day Rank | Signal Type |
|---|---|---|---|---|
| 1 | Point Cook | Melbourne Outer West | #4 | Sustained / Cooling |
| 2 | Alfredton | Ballarat, Regional Vic | #3 | Consistent Performer |
| 3 | Hoppers Crossing | Melbourne Outer West | – | 30-Day Established |
| 4 | Werribee | Melbourne Outer West | – | 30-Day Established |
| 5 | Clyde North | Melbourne Outer South-East | #1 | Emerging – Watch Closely |
| 6 | Horsham | Regional Victoria | – | Regional Established |
| 7 | Devonport | Regional Tasmania | – | Regional Emerging |
Use the two tables together. Not in isolation. The 7-day table shows what is catching fire right now. The 30-day table shows what has already been burning. Cross-referencing the two is how you tell a genuine early opportunity from a suburb the entire investment community has already found.
Fast Movers to Watch
Beyond the headline rankings, week-on-week rank-change data surfaces a second tier of suburbs worth watching. These locations have moved dramatically, often by hundreds of positions, in a single week. Many have only just entered the top 100 or top 200 for the first time. They sit at the very earliest stage of the investor attention curve.
“Endeavour Hills moved up 420 positions in a single week. It wasn't being talked about in investment circles last Monday. It is this Monday.”
| Suburb | Region | 7-Day Rank Change | Notes |
|---|---|---|---|
| Endeavour Hills | Melbourne Outer South-East | ▲420 | Biggest mover of the week nationally |
| Sale | Gippsland, Regional Vic | ▲313 | Regional Victoria continuing to surge |
| Dandenong | Melbourne South-East | ▲306 | Affordability play in established corridor |
| Tarneit | Melbourne Outer West | ▲252 | Joins Point Cook corridor in search activity |
| Hampton Park | Melbourne Outer South-East | ▲217 | South-east corridor widening beyond Clyde North |
| Narre Warren | Melbourne Outer South-East | ▲154 | Established suburb seeing fresh interest |
| Lalor | Melbourne Northern | ▲144 | North corridor emerging alongside south-east |
Several patterns stand out. Melbourne's outer south-east corridor is not a single-suburb story. Clyde North at number one is joined by Endeavour Hills (▲420), Hampton Park (▲217), and Narre Warren (▲154) as fast-rising search targets. Investors are scanning the entire corridor, not just its most-discussed postcodes. This broadening of interest within a corridor often precedes price competition spreading from the first suburb outward to its neighbours.
The outer west corridor is widening too. Tarneit's ▲252 move adds to the established presence of Point Cook, Hoppers Crossing, and Werribee in the 30-day table. And Sale's ▲313 move in Gippsland shows regional Victoria's continued expansion as an investor target. More on that shortly.
These fast-mover suburbs have not yet locked in sustained top-10 positions. They may or may not. But the data reveals where investor thinking is heading before it becomes common knowledge. The window between when a suburb first appears on the fast-movers list and when it becomes a top-10 fixture is where the most useful market intelligence sits.
The fast-movers list is not a buy signal on its own. It is a research prompt. When a suburb moves up 200 or 300 positions in a single week, the right response is to start researching it now. Not to wait until next month when everyone else already has.
The Overheated Signal: Knowing Which Phase You Are In
There is a flip side to the early-mover opportunity. It matters just as much. Weekly data helps you spot suburbs before the crowd. It also helps you spot suburbs where the crowd has already arrived.
When a suburb appears in the top 10 of both the 7-day and 30-day tables for three, four, or five consecutive weeks, it is no longer an early opportunity. It is an established consensus trade. That does not make it a bad investment. But the risk profile has changed. More investors are already in due diligence. More buyers agents are already recommending it. More media articles are already being written about it. By the time a suburb appears in a monthly report as a new hotspot, this stage has typically already passed.
NEW entry this week with no prior ranking. First appearance in the top 25. Investor attention is just beginning. Early research window is now open.
Top 10 in both 7-day and 30-day rankings. Has held this position consistently. The investment community has been watching this suburb for weeks. Consensus has formed.
Officer entered this week's top five as a completely new entry. It shows the fresh-opportunity phase. No one has been writing reports about Officer for the past month. It appears for the first time this week. The investors researching it right now are, by definition, ahead of consensus.
Horsham is the opposite. It has been a fixture in the regional Victoria hotspot rankings long enough to be well-covered territory. That does not mean Horsham is a bad investment. But the market is already well aware of Horsham. Most serious investors in regional Victoria already know about it and have already formed their view.
The weekly cadence gives you a precise window into which phase each suburb occupies at any given moment. Monthly reports average across four weeks and obscure this distinction entirely. A suburb that was fresh in week one and established by week four looks identical in a monthly summary. But the market dynamics around each phase are very different.
The weekly report is not just a list of hot suburbs. It is a diagnostic tool for reading which phase of the attention cycle each suburb is in. New entries and fast movers signal early opportunity. Multi-week top-10 fixtures signal established consensus. Use the report accordingly.
The Bigger Picture: Regional Australia Is Arriving
Stepping back from individual suburb data, there is a structural shift visible in the broader search numbers. Over the past twelve months, the share of investor searches directed at regional locations has undergone a significant and accelerating change. We define regional here using the Greater Capital City Statistical Area (GCCSA) classification, which separates capital city suburbs from rest-of-state locations.
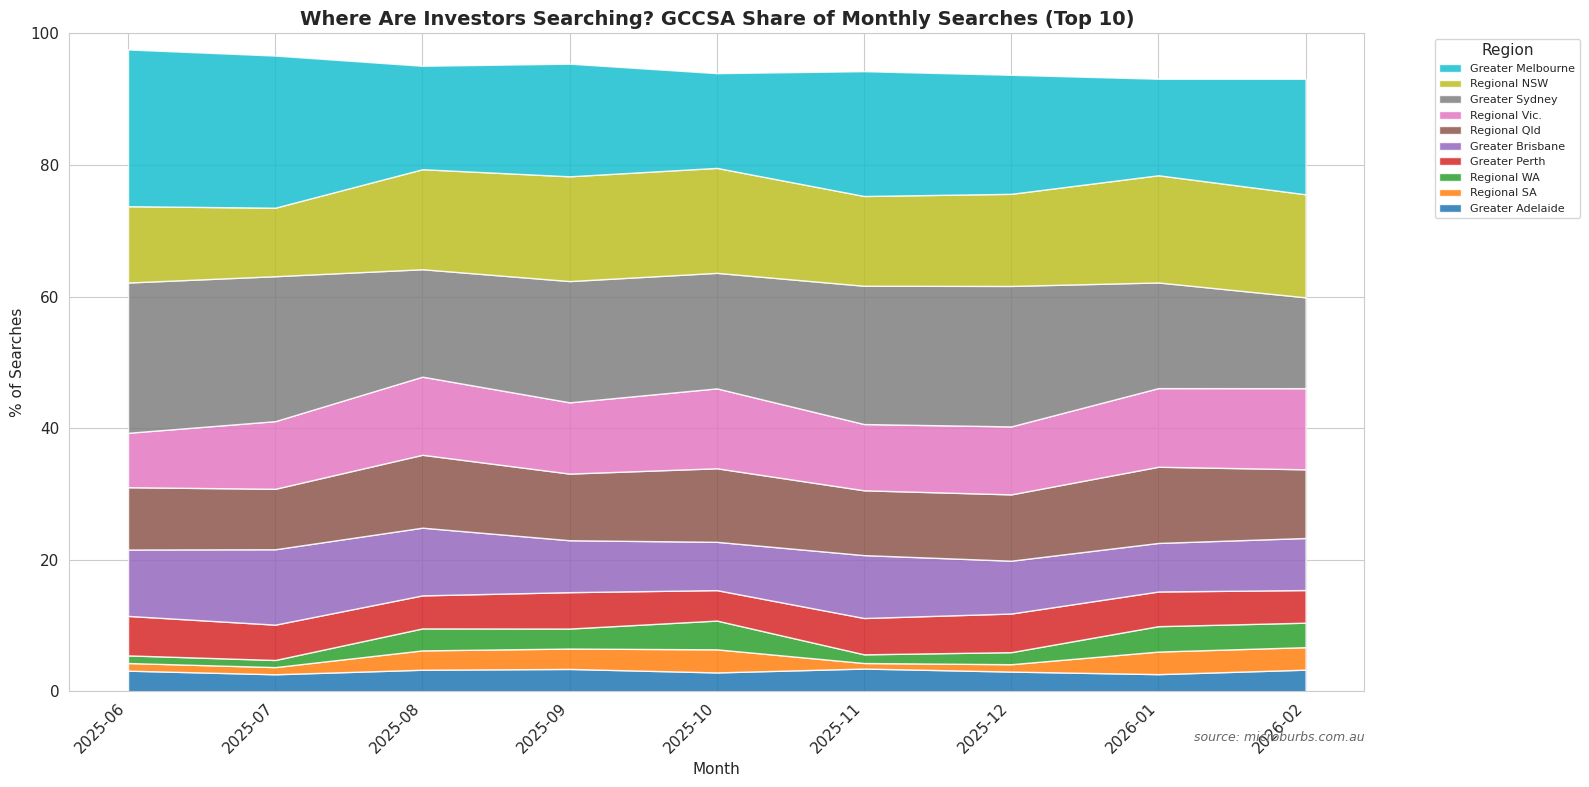
Regional Victoria's share of total investor searches rose from 6.6% in February 2025 to 12.5% in February 2026. That is a near-doubling in twelve months. Not a statistical blip. It reflects a sustained and accelerating reallocation of investor research attention away from capital city suburbs toward regional centres. Alfredton (Ballarat), Sale (Gippsland), and Horsham (Wimmera) all show this trend in this week's data.
Regional Tasmania's trajectory is even more dramatic in proportion. From a base of 1.06% of national investor searches in February 2025, it grew to 3.13% by February 2026. Nearly tripled in a year. Devonport's appearance in the national 30-day top seven reflects this directly. Tasmania was historically treated as a peripheral market by mainland investors. The data suggests that perception is changing.
The drivers are consistent with what buyers agents in these markets observe on the ground. Relative affordability versus capital city prices. Improving rental yields as capital city rents have plateaued. Infrastructure investment in regional centres making them more viable for owner-occupiers, which in turn supports rental demand for investors. The weekly data lets us track precisely how this structural shift plays out at the suburb level in real time.
Regional Victoria and regional Tasmania are not fringe markets any more. They now hold a combined share of investor search activity that would have been unthinkable two years ago. Alfredton, Sale, Horsham, and Devonport are early readings of a structural shift that is still accelerating. Monthly reports are only now beginning to reflect trends that weekly data first captured months ago.
Related Research
We Publish Every Monday
Bookmark this page. Come back each week. The suburbs that top next week's list may not be anywhere near this week's rankings. That is exactly the point.