

Recent sales and current listings for Bondi. Hover a row to locate the property on the map.
90
Recent sales (3 yrs)
51
Currently for sale
$1,800
Avg weekly rent (houses)
$1.63M
Median sale (3 yrs)
| Address | Type | Bd | Ba | Sale price |
|---|---|---|---|---|
| 34 Moore Street | House | 4 | 3 | $4,300,000 |
| Unit 4, 10-12 Edward Street | Unit | 2 | 2 | $1,633,000 |
| Unit 5, 312 Bondi Road | Unit | 2 | 2 | $1,570,000 |
| Unit 4, 34 Bennett Street | Unit | 2 | 1 | $1,200,000 |
| Unit 7, 44 Bennett Street | Unit | 2 | 1 | $1,757,000 |
| 36 Watkins Street | Townhouse | 3 | 2 | $2,700,000 |
| Unit 2, 20 Edward Street | Unit | 1 | 1 | $827,000 |
Population, housing tenure, and census indicators
Bondi business directory
Mostly residential, too few businesses to identify a market pattern.
The local business mix below shows what is distinctive in this suburb regardless.
Distinctive local venuesgrouped by category
5 businesses in this suburb classified as synagogue. Examples: Centre Of Jewish Life Incorporated Inc9894832, JEWISH INCLUSION PROJECT LTD, Lubavitch Jewish Centre Incorporated. That is roughly 73x more common than in a typical Australian suburb.
3 businesses in this suburb classified as tobacconist. Examples: Bondi Road Tobacconist and Mini Mart, Bondi Tobacconist Emporium, Bondi Road Tobacconist CTC. That is roughly 72x more common than in a typical Australian suburb.
5 businesses in this suburb classified as massage. That is roughly 55x more common than in a typical Australian suburb.
3 businesses in this suburb classified as newsagent. That is roughly 8.5x more common than in a typical Australian suburb.
On the busiest residential street, Bondi Rd, the median house price sits at $3.91m. Every 4.8 years (average turnover).
Built from the local business directory of every Australian suburb. Read the study ›
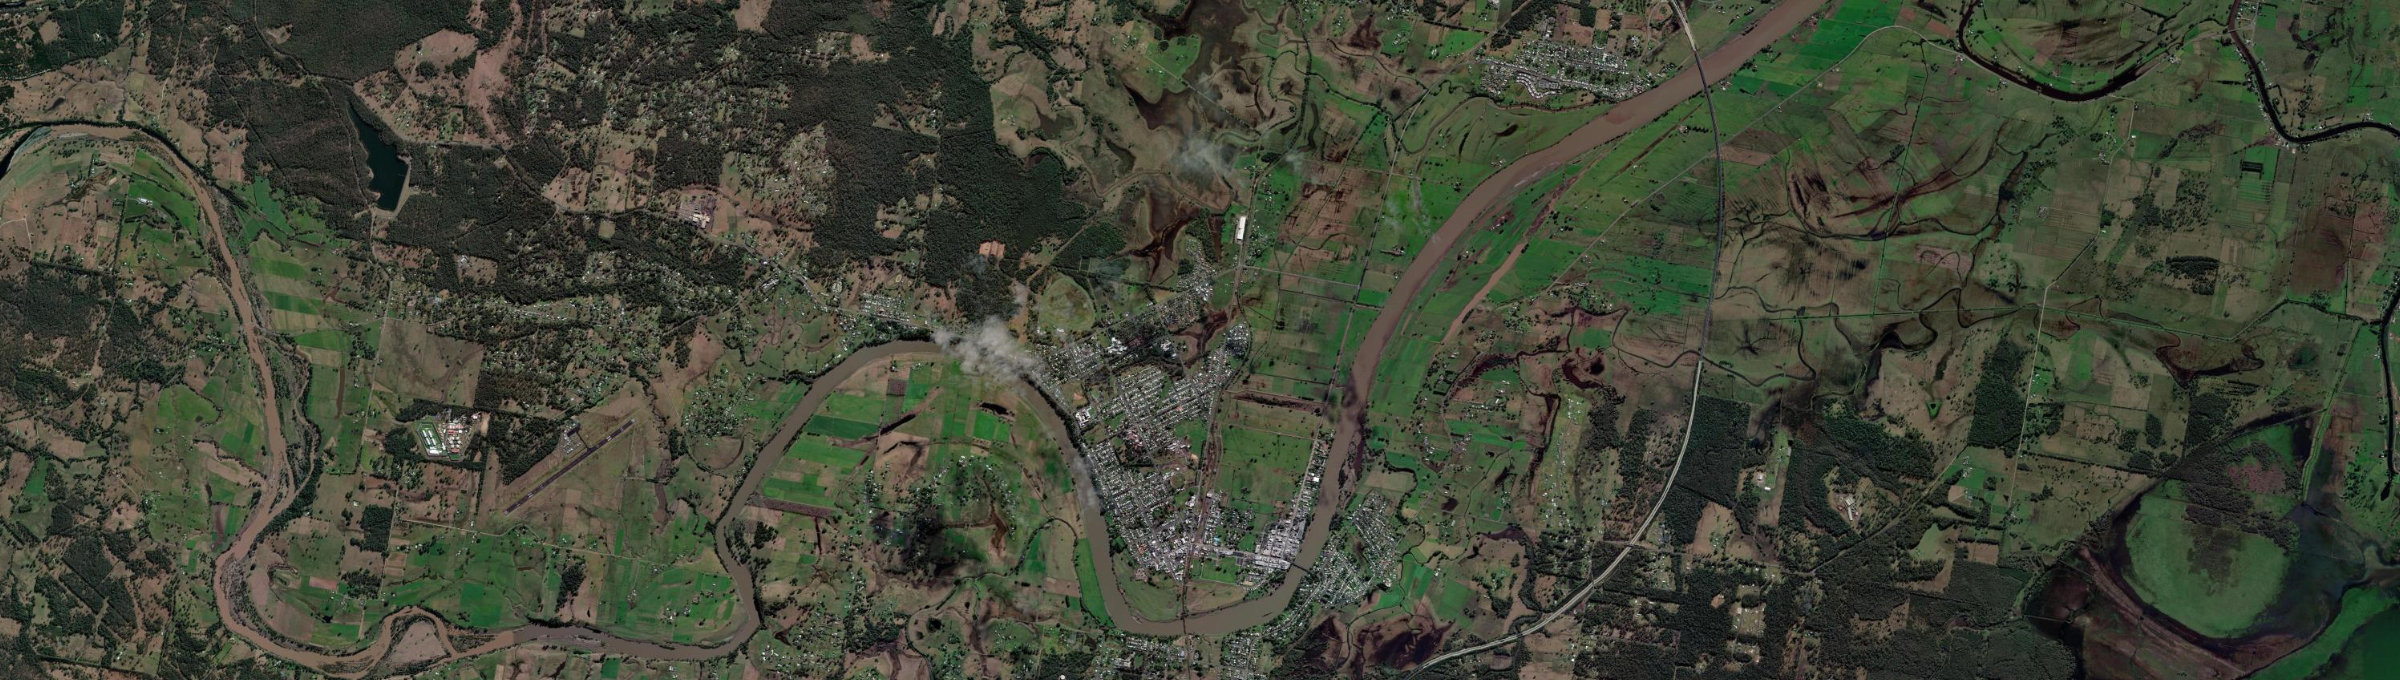
Aerial view
Amenities, environment, and liveability in Bondi. 7 km from CBD · 245 amenities.
Each row is a price driver in Bondi. Tap to expand. Map on the left shows Microburb-level detail — toggle a row to switch the layer.
Environmental, infrastructure and social risks for Bondi, with the matched capital-growth association where we have a measured study. 9 flagged · 17 tracked.
NSW 2026 · Data as of 18 Nov 2026
Toggle map layers (multi-select). Click any row for detail.
Data as of 22 Nov 2026
Our forecasts identify suburbs that will outperform the national median (30.7% over the same 4 years) with 85% accuracy
Past growth comparison over 1, 3, 5, and 10 years
63 streets listed (63 with 2-8yr forecast, model cutoff 22 Nov 2026) in West Kempsey, NSW · Mid North Coast NSW · Growth 2013 to 2026
| Street | Current Price | Past Growth/yr | 4yr Forecast/yr | 8yr Forecast/yr | Confidence | Houses | Units | Rent/wk | Sales Turnover | Rental Turnover | Renters |
|---|---|---|---|---|---|---|---|---|---|---|---|
| River Street | $595k | +4.2%/yr👎 | High | 134 | 26 | $431/wk | 11.1yr | 4.5yr | 23%👎 | ||
| Broughton Street | $442k | +3.9%/yr👎 | High | 89 | 24 | $465/wk | 11.6yr | 4.2yr | 20% | ||
| Tozer Street | $425k | +4.3%/yr👎 | High | 126 | 23 | $488/wk | 9.1yr👎 | 5.5yr | 25%👎 | ||
| North Street | $580k | +3%/yr | High | 81 | 7 | $509/wk | 9.4yr👎 | 3.6yr👎 | 31%👎 | ||
| Sea Street | $410k | +4.3%/yr👎 | High | 79 | 19 | $546/wk | 12.5yr👍 | 4.1yr | 46%👎 |
Price and size by bedroom count in West Kempsey
| Beds | House Price | Unit Price | Sales (3 yrs) | Median Baths | Median Land |
|---|---|---|---|---|---|
| 2 bed | $420k | — | 6 | 1 | 633 sqm |
| 3 bed | $478k | — | 42 | 1 | 613 sqm |
| 4 bed | $600k | — | 8 | 2 | 658 sqm |
| 5 bed | $615k | — | 2 | 2 | 575 sqm |
Last 4 weeks of smart median data
| Week | House Price | Chg | Unit Price | Chg | Median Rent/wk | Chg |
|---|---|---|---|---|---|---|
| 26 Oct 2026 | $470k | +0.00% | — | — | $500 | +0.00% |
| 02 Nov 2026 | $470k | +0.00% | — | — | $500 | +0.00% |
| 09 Nov 2026 | $475k | ▲ +1.06% | — | — | $500 | +0.00% |
| 16 Nov 2026 |
| $475k |
| +0.00% |
| — |
| — |
| $500 |
| +0.00% |