
Recent sales and current listings for Surfers Paradise. Hover a row to locate the property on the map.
715
Recent sales (3 yrs)
632
Currently for sale
$1,200
Avg weekly rent (houses)
$840k
Median sale (3 yrs)
| Address | Type | Bd | Ba | Sale price |
|---|---|---|---|---|
| Unit 170, 12 Commodore Drive | Unit | 3 | 2 | $1,450,000 |
| Unit 18, 33 Beach Parade | Unit | 3 | 2 | $940,000 |
| Unit 25c, 11 Hanlan Street | Unit | 3 | 3 | $2,200,000 |
| Unit 42, 5 Admiralty Drive | House | 2 | 2 | $930,000 |
| Unit 27, 69-73 Ferny Avenue | Unit | 2 | 1 | $620,000 |
| Unit 20, 19 Monaco Street | Unit | 2 | 2 | $749,000 |
| 21 Rapallo Avenue | House | 4 | 3 | $2,430,000 |
Population, housing tenure, and census indicators
Surfers Paradise business directory
No single industry dominates. Mix tracks the broader market.
Distinctive local venuesgrouped by category
5 businesses in this suburb classified as holiday rental. Examples: Chevron Palms, Mari Court Resort, Surf Parade Resort. That is roughly 41x more common than in a typical Australian suburb.
4 businesses in this suburb classified as hostel. Examples: Bunk, Tequila Sunrise Hostel Surfers Paradise, Maze Backpacker Gold Coast. That is roughly 29x more common than in a typical Australian suburb.
54 businesses in this suburb classified as apartments. That is roughly 24x more common than in a typical Australian suburb.
3 businesses in this suburb classified as car rental. That is roughly 24x more common than in a typical Australian suburb.
On the busiest residential street, Stanhill Dr, the median house price sits at $3.14m. Every 4.4 years (high turnover).
Built from the local business directory of every Australian suburb. Read the study ›
Each row is a price driver in Surfers Paradise. Tap to expand. Map on the left shows Microburb-level detail — toggle a row to switch the layer.
Environmental, infrastructure and social risks for Surfers Paradise, with the matched capital-growth association where we have a measured study. 9 flagged · 17 tracked.
Amenities, environment, and liveability in Surfers Paradise. 3 km from CBD · 700 amenities.
QLD 4217 · Data as of 7 Nov 2026
Toggle map layers (multi-select). Click any row for detail.

Median sale prices and 12 month growth
Key market indicators and their impact on capital growth
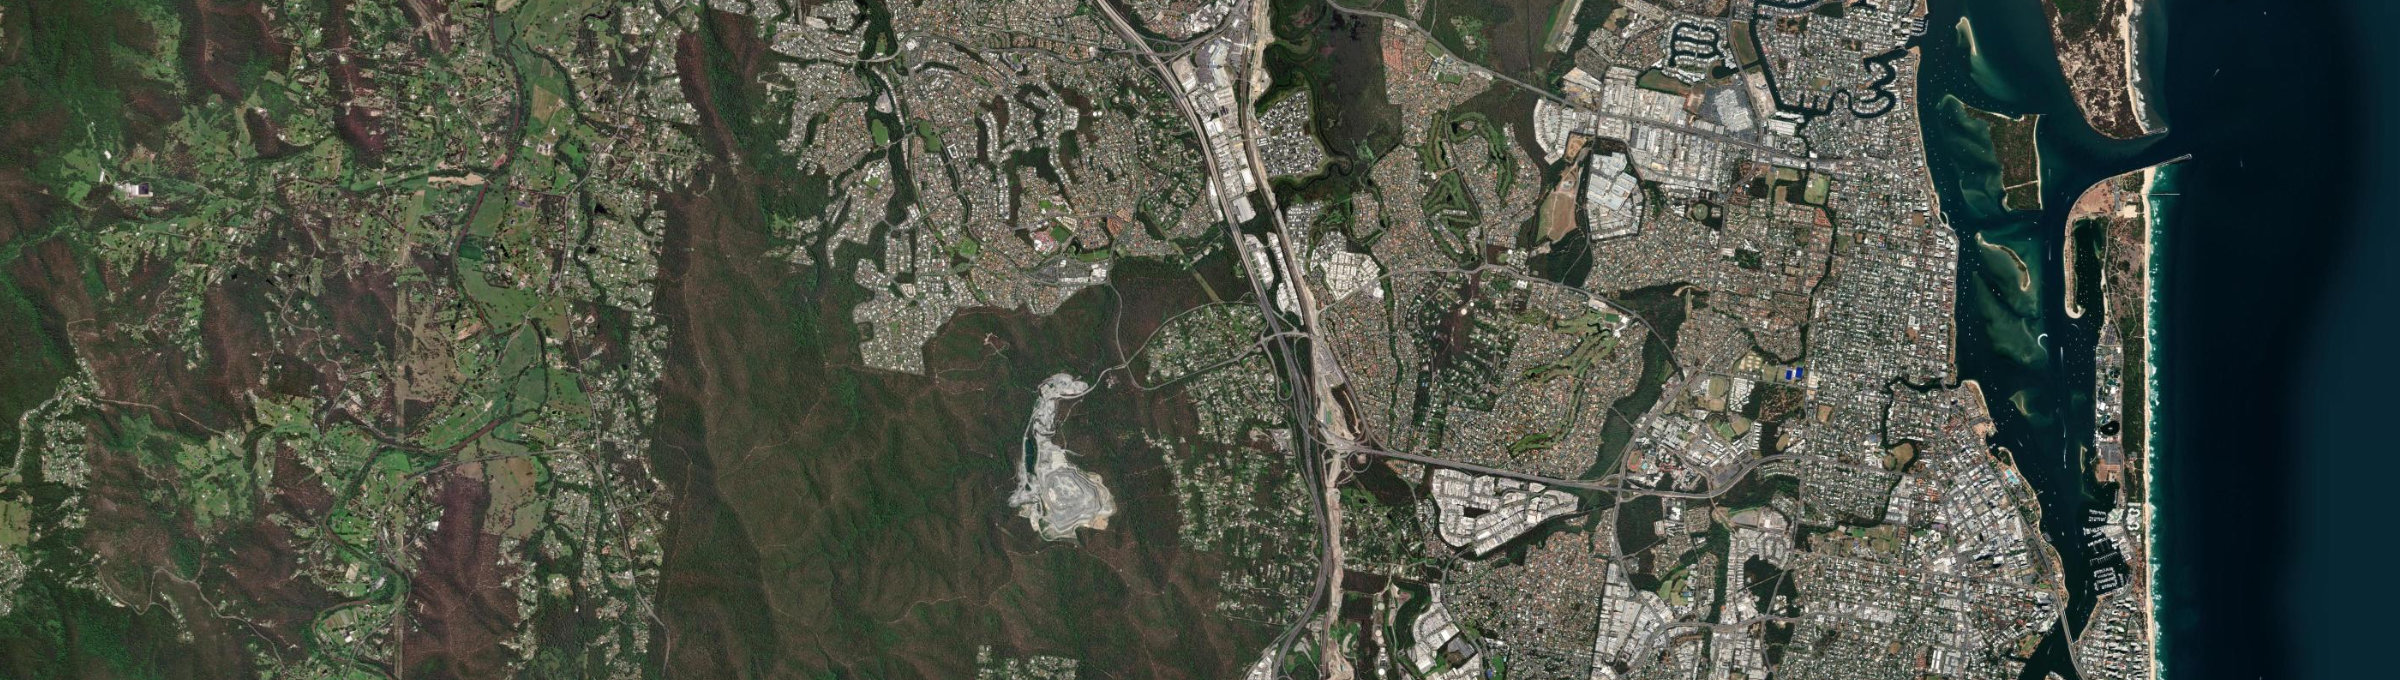
Aerial view
Data as of 12 Nov 2026
Our forecasts identify suburbs that will outperform the national median (30.7% over the same 4 years) with 85% accuracy
Past growth comparison over 1, 3, 5, and 10 years
27 streets listed (27 with 2-8yr forecast, model cutoff 12 Nov 2026) in Gaven, QLD · Gold Coast · Growth 2013 to 2026
| Street | Current Price | Past Growth/yr | 4yr Forecast/yr | 8yr Forecast/yr | Confidence | Houses | Units | Rent/wk | Sales Turnover | Rental Turnover | Renters |
|---|---|---|---|---|---|---|---|---|---|---|---|
| Castle Hill | $1.2M | -0.8%/yr👍 | High | — | — | — | — | — | — | ||
| Glade Drive | $1.4M | — | High | 57 | 6 | $525/wk | 23.2yr👍 | — | 22%👎 | ||
| Banyula Drive | $1.5M | +2.7%/yr👎 | High | 47 | 0 | $633/wk | 17.4yr👎 | 5yr | 10% | ||
| High Ridge | $1.5M | +3.6%/yr👎 | High | — | — | — | — | — | — | ||
| Coolibah Road | $1.6M | +1.8%/yr | High | 44 | 2 | $712/wk | 20yr👍 | 4.3yr | 2%👍 |
Price and size by bedroom count in Gaven
| Beds | House Price | Unit Price | Sales (3 yrs) | Median Baths | Median Land |
|---|---|---|---|---|---|
| 2 bed | — | — | 1 | 1 | 2,365 sqm |
| 4 bed | $1.5M | — | 3 | 2 | 4,678 sqm |
| 5 bed | — | — | 2 | 3 | 7,712 sqm |
| 6 bed | — | — |
Last 4 weeks of smart median data
| Week | House Price | Chg | Unit Price | Chg | Median Rent/wk | Chg |
|---|---|---|---|---|---|---|
| 19 Oct 2026 | $1.55M | +0.00% | — | — | $1,900 | +0.00% |
| 26 Oct 2026 | $1.55M | +0.00% | — | — | $1,700 | ▼ -10.53% |
| 02 Nov 2026 | $1.55M | +0.00% | — | — | $1,700 | +0.00% |
| 2 |
| 3 |
| 5,796 sqm |
| 09 Nov 2026 | $1.55M | +0.00% | — | — | $1,550 | ▼ -8.82% |