The Top 10% of Property Investors Earn 13.6% Per Year. Here Is What Separates Them.
We analysed 40,700 actual house sales across Australia. The median investor earns 5.5% per year after all costs. But the spread between winners and everyone else is enormous. And the winners are not who you think.

Most investors are not failing. They are just average.
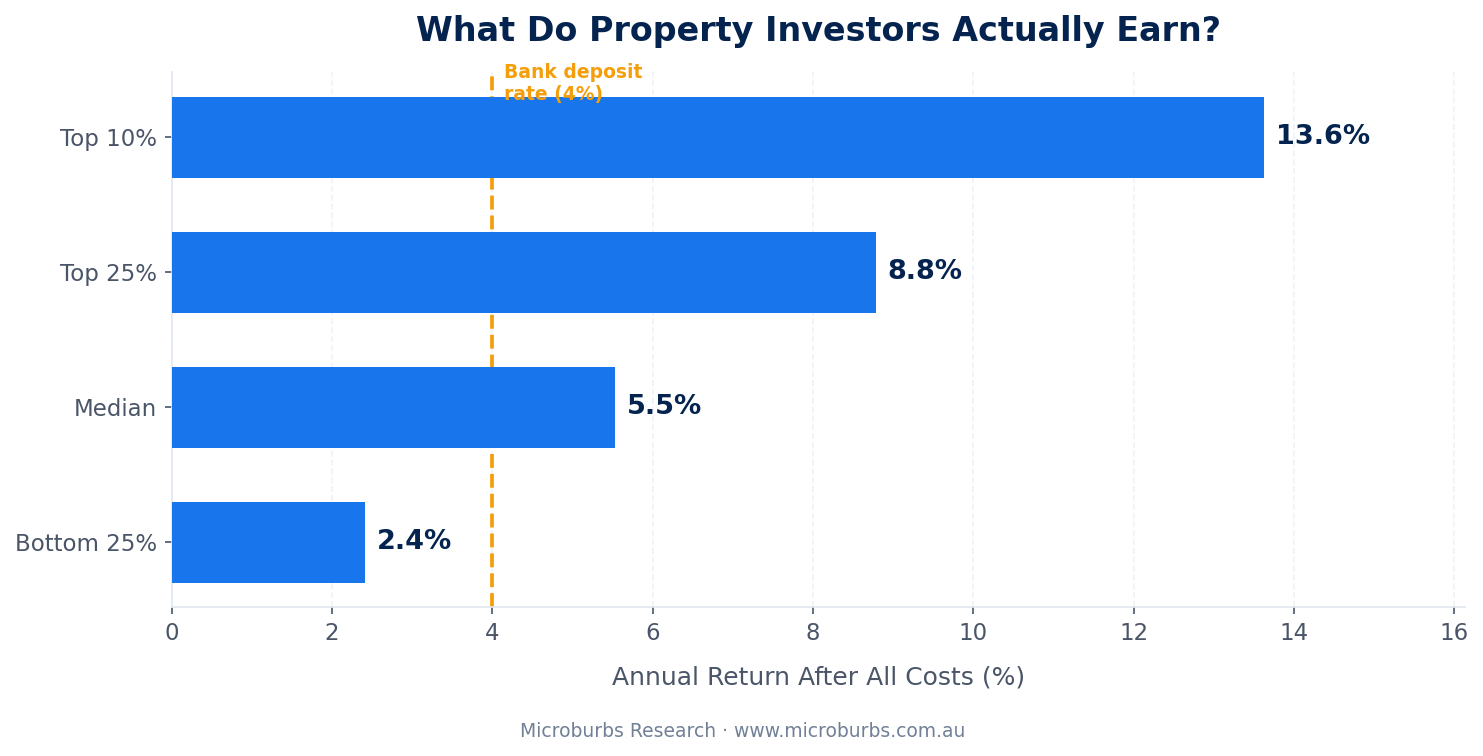
Here is what 40,700 property investments actually returned.
The top 10% earned above 13.6% per year after all costs. The top 25% earned above 8.8%. The median investor earned 5.5%. And the bottom 25% earned below 2.4%.
That spread is not about luck. It is about where you buy, what you pay, and how long you hold.
We modelled every cost. Stamp duty. Agent fees. Loan interest. Maintenance. Insurance. Rates. Land tax. Property management. Income tax on rent. Everything a real investor actually pays.
Some investors made 30% in a year. Here is what they bought.
The biggest returns in our dataset came from short holds in affordable suburbs. We went to considerable effort to remove renovated properties from the dataset. Any sale where the price jumped well beyond suburb-wide growth was flagged and excluded. So these returns are not renovation profits. They are organic capital growth plus rental income from investors who bought in the right place at the right time.
Falcon, Western Australia. Bought for $210,000 in July 2020. Sold for $306,000 fourteen months later. A 31% annual return after every cost. Falcon is a beachside suburb south of Mandurah. Median house price under $400,000.
Morwell, Victoria. Bought for $135,000. Sold two years later for $250,000. A 30% annual return. Morwell is in the Latrobe Valley. Entry prices were so low that even modest dollar growth turned into huge percentage gains.
Bundamba, Queensland. Bought for $330,000. Sold 1.1 years later for $475,000. A 30% annual return. Bundamba is in Ipswich, outer Brisbane. Working-class suburb with a good train line to the CBD.
Condon, Queensland. Bought for $285,000. Sold 1.2 years later for $440,000. Another 30% annual return. Condon is in Townsville. Not a suburb that appears in buyer's agent newsletters.
The pattern is clear. Low entry price. Regional or outer-metro location. Bought before the crowd arrived.
The pattern: The top-performing investors bought affordable properties in regional or outer-metro suburbs. They got in before prices repriced. You do not need a $1.5 million Sydney property to build wealth in real estate. For the full methodology and detailed breakdown, read the complete whitepaper.
Hold for five years and the odds shift dramatically
Short-term investors face a wider range of outcomes. Some earn 30% a year. Others lose money. But the longer you hold, the more predictable the result becomes.
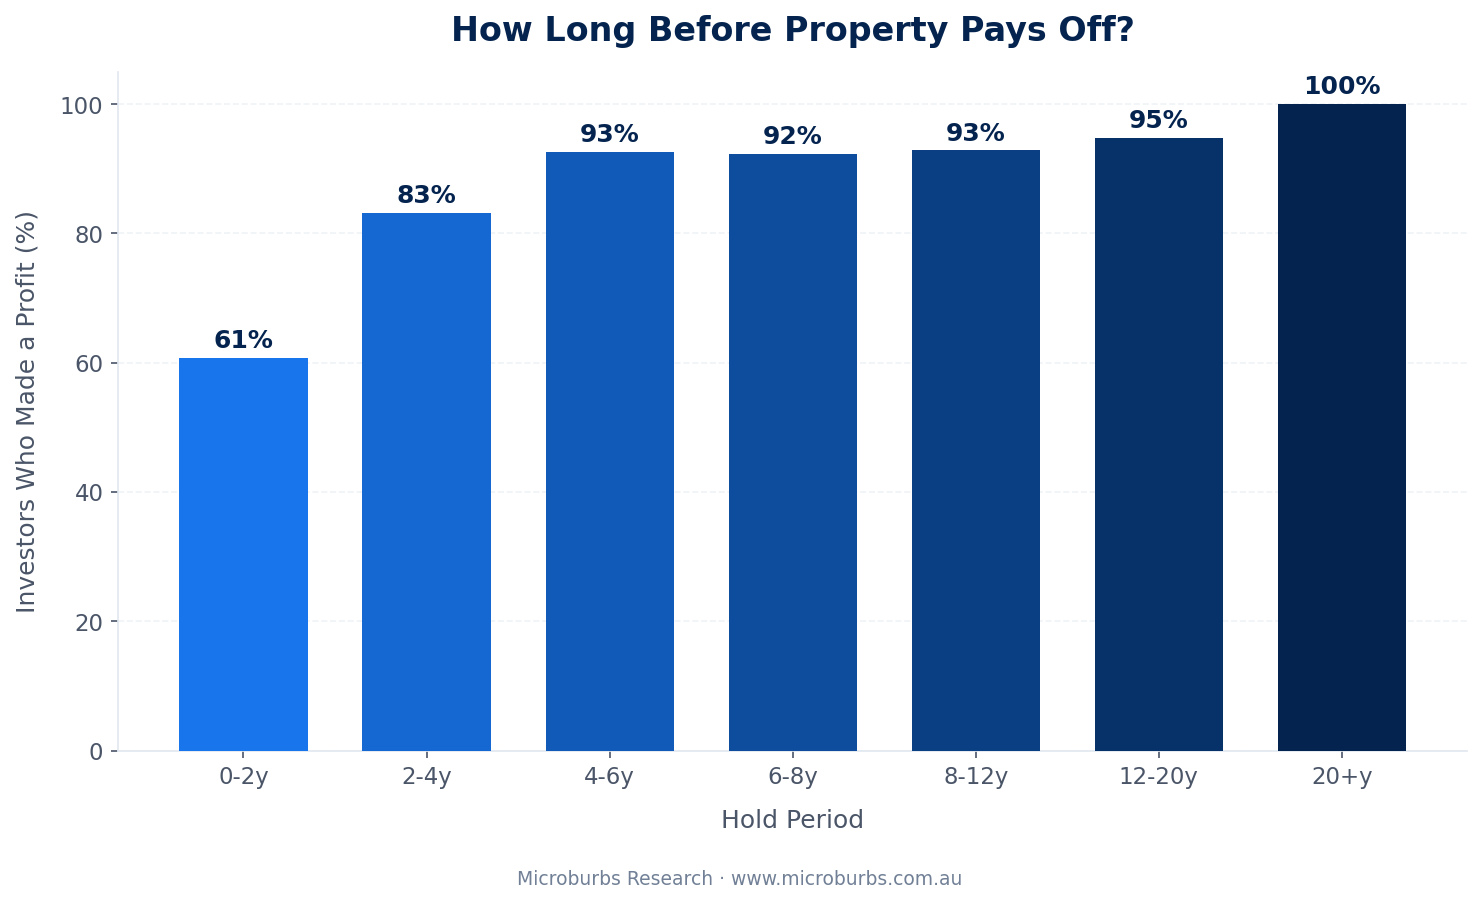
At 0 to 2 years, 61% of investors made a profit. At 4 to 6 years, that climbed to 93%. At 20 years or more, 100% made a profit. Every single one.
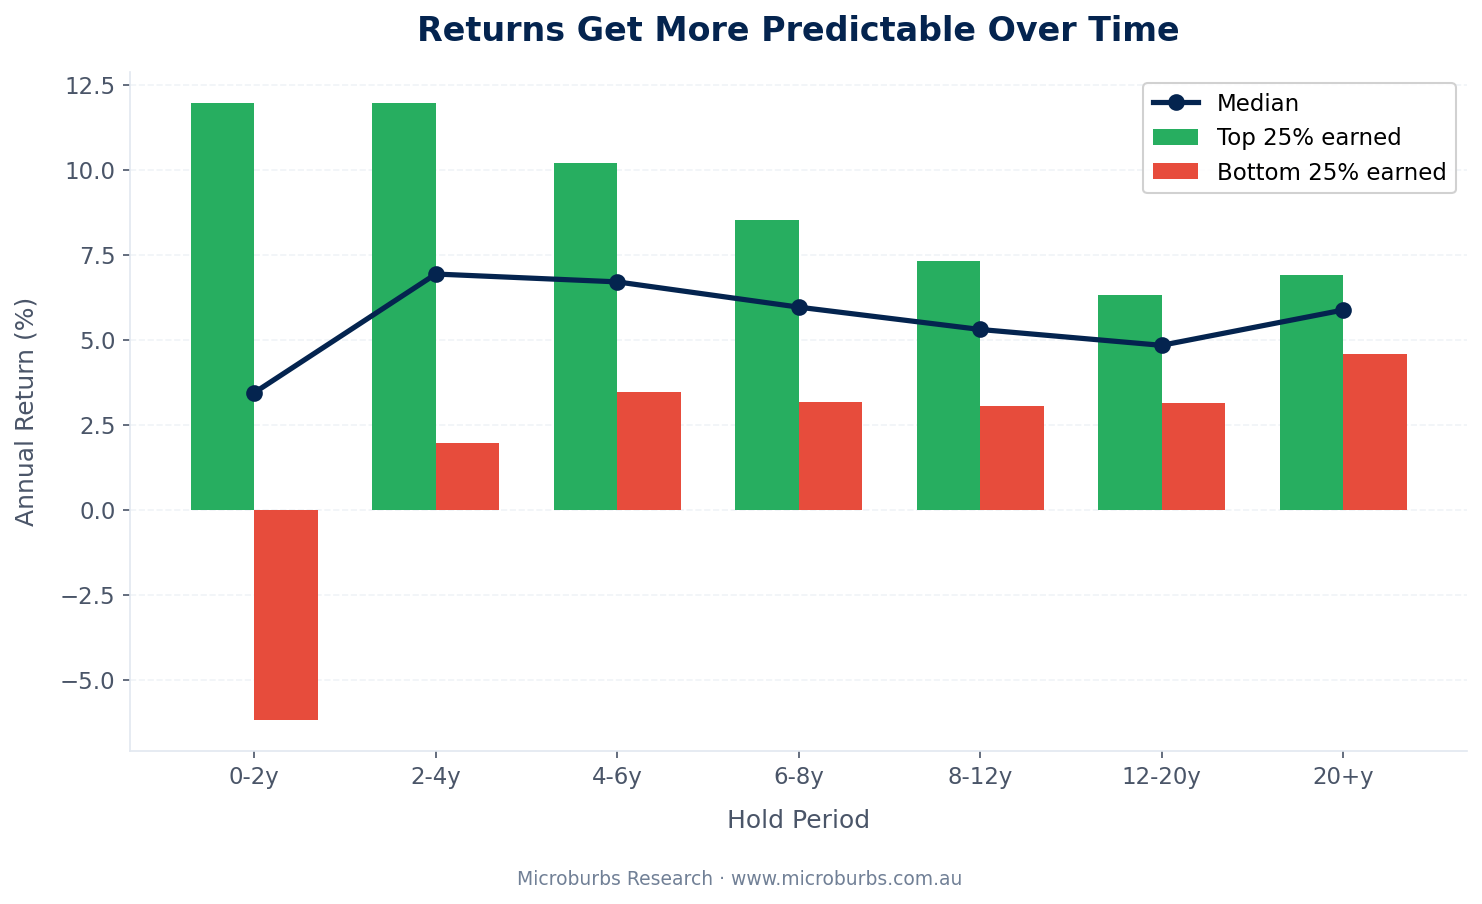
The top 25% of short-term holders earned above 12% per year. But the bottom 25% of those same short-term holders lost money. Hold for 20 years and the gap between top 25% and bottom 25% narrowed to just a few percentage points. Everyone converged toward the same steady return.
Time does not increase your return. It narrows the range of outcomes. That is the real story.
The core finding: Short-term and long-term property are two different products. A short hold is a high-upside play that requires smart buying. A long hold is a slow, predictable grind toward near-certain profit. Both can work. But you need to know which one you are choosing.
Where the winners come from
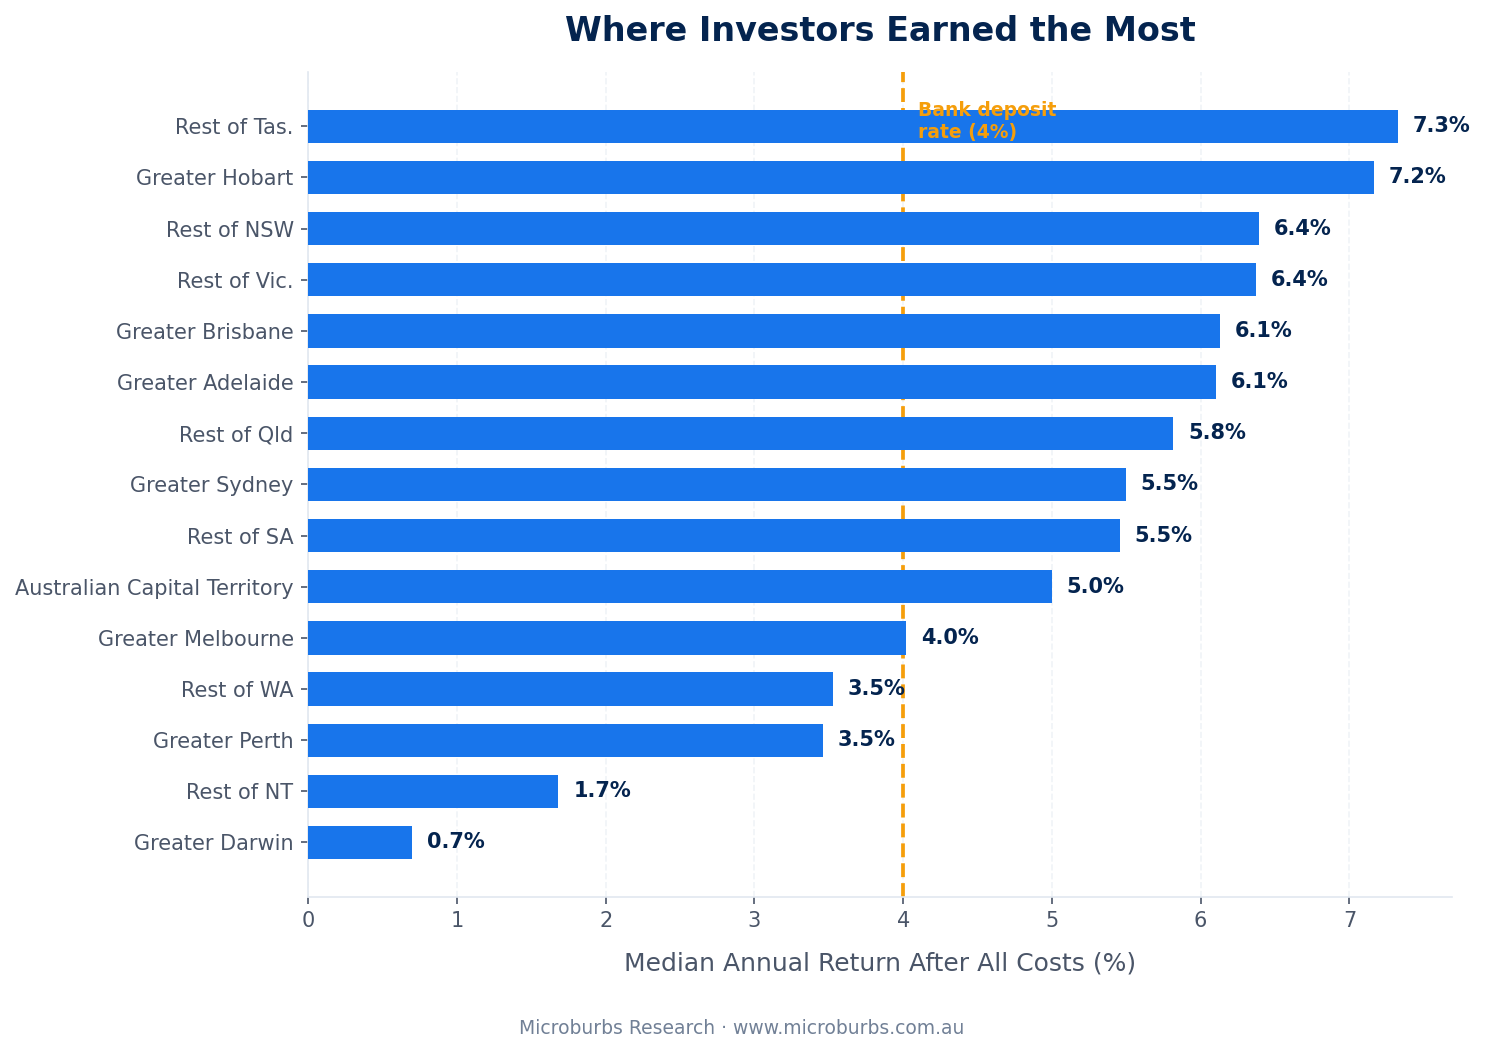
Tasmania leads the country. Investors there earned a median 7.2% to 7.3% per year. Regional NSW and Victoria followed at 6.4%. Brisbane and Adelaide sat at 6.1%. Sydney was 5.5%. Melbourne was 4.0%.
Darwin was 0.7%. Barely above zero.
But the individual suburb results tell the more interesting story.
Cooee Bay, Queensland: 15.0% median annual return. A small coastal suburb near Yeppoon. Affordable beachside property that repriced during the regional boom.
South Bunbury, Western Australia: 13.8%. Regional WA's comeback that most east-coast investors missed entirely.
Bairnsdale, Victoria: 13.2%. East Gippsland. Under $400,000 entry prices. Strong rental demand from the local hospital and TAFE.
Elizabeth North, South Australia: 12.2%. Adelaide's affordable northern corridor. Quietly compounding while everyone watched Sydney.
Raceview, Queensland: 11.8%. Ipswich growth corridor. The investors who bought here are already out with their profits.
Not one prestige suburb on the list. Not one capital city blue chip. The top performers were affordable markets that repriced. The first Greater Sydney suburb does not appear until position 37 on our list. That is Budgewoi on the Central Coast, with an entry price around $360,000.
What does this mean for the average investor?
Three things stand out from 40,700 transactions.
Entry price matters more than prestige. The top performers were not harbour-view mansions. They were $200,000 to $400,000 houses in regional towns and outer suburbs. Affordable entry prices gave these investors room to grow.
Time compresses risk. If you can hold for five years or more, the chance of making a profit jumps above 93%. At 20 years, every investor in our dataset made money. Every one.
Location is not what you think. The best-performing regions were Tasmania, regional NSW, and regional Victoria. Not Sydney. Not Melbourne. The investors who bought in places the crowd ignored earned the highest returns.
And 64% of all investors beat a 4% bank deposit return. Property did not just preserve capital for most people. It outperformed the safe alternative.
A note on the numbers
This analysis covers 40,700 house transactions identified as investment properties across Australia. Returns are calculated as the annualised rate of return after stamp duty, agent commission, loan costs, maintenance, insurance, council rates, water rates, land tax, property management fees, and income tax on rental income. We went to considerable effort to remove renovated properties from the dataset. Any sale where the price jumped well beyond suburb-wide growth was flagged and excluded using a statistical filter. These are organic returns from holding property, not renovation profits. For the full methodology, see the complete whitepaper.
The gap between good and average is not what you think
The top 10% did not buy better-known suburbs. They bought cheaper ones, earlier, and held through the repricing. The top 25% earned above 8.8% per year. The median earned 5.5%.
The gap is real. But it is not about secret knowledge or insider access. It is about entry price, timing, and patience. Three things any investor can control.
Full Research Paper
Want the full methodology, data tables, and detailed analysis?
Read the complete whitepaper with percentile breakdowns, regional comparisons, and our renovation exclusion method.
Find suburbs before they reprice
Microburbs analyses every suburb in Australia at the street level. See which pockets are undervalued, which streets are tightly held, and where the data points before the crowd arrives.