Measuring Investor Search Intensity Across Australian Suburbs: A Weekly Signal Approach
Abstract
This paper describes how we built and validated a weekly suburb-level investor search intensity index from Microburbs platform event logs. The index tracks unique user sessions engaging with suburb and property reports. We normalise by ABS mesh block count to control for suburb size. Weekly publication sets this index apart from monthly competitor products. It gives a higher-resolution signal for spotting emerging investor interest.
1. Introduction
Property investment decisions are not instant. Before buying an asset, investors spend weeks reviewing suburb profiles, comparing sales, and tracking rental yield estimates. This research behaviour is measurable through digital platform interactions. It precedes purchase decisions by weeks to months. That makes it a potential leading indicator of local demand.
The main publicly available demand indices come from CoreLogic, REA Group, and Domain. They are built from transaction-level data: auction clearance rates, vendor discounting, and settled sale volumes. These measures are lagging by definition. A settlement recorded this week reflects a decision made weeks or months ago. Search-based demand signals, by contrast, arrive in near-real-time. They precede the transactional outcomes that most indices measure.
Choi and Varian (2012) established the potential of search-based indices for economic nowcasting. They showed Google Trends data could improve near-term forecasts across a range of economic variables. Applied to property markets, Beracha and Johnson (2012) showed that internet search volume for real estate terms predicted subsequent house price movements at metro level with statistical significance. This body of work provides the theoretical foundation for our index. We apply the same logic at suburb level using platform-native event data rather than general web search volume.
Core premise: Investor research activity on a real estate information platform is a leading indicator of geographic demand. Measuring where motivated investors are looking today signals where transaction activity is likely to concentrate in the weeks and months ahead.
This index differs from prior search-based approaches in three ways. First, it operates at suburb level. That is finer granularity than metro-level studies. Second, it uses platform-native data from a dedicated property research tool. Users are by construction engaged in active property research, not casual browsing. Third, it publishes weekly. No existing competitor product offers that temporal resolution.
2. Data Source
The data underlying this index come from the Microburbs platform event log system. Microburbs is an Australian property research platform serving property investors, buyers agents, and home buyers. It provides suburb-level analytics, property reports, and market intelligence tools.
The dataset covers property and suburb report events from February 2025 through February 2026. That represents twelve months of continuous platform activity. Two distinct event types are captured:
- GENERATION: A user generates a new report. This represents a deliberate, active search for information about a specific suburb or property address. It is the stronger signal of fresh investor interest.
- VISIT: A user returns to view a previously generated report. This represents continued engagement with a suburb already under investigation. It is a secondary signal of sustained interest.
Each event record contains the following fields:
- Timestamp: Date and time of the event. This enables temporal windowing.
- Suburb: The suburb tied to the report. Matched to ABS Statistical Area Level of Locality (SAL) names.
- Address: The specific property address, where applicable (for property-level reports).
- Session ID: A unique identifier for the user session. This enables deduplication at session level.
- User email: The authenticated user identifier. This enables analysis of firm-level activity patterns.
- Event type: GENERATION or VISIT, as described above.
- Report category: Property report or Suburb report. This distinguishes address-level from area-level research.
- Domain: The email domain of the authenticated user. Used to identify and exclude automated or programmatic traffic.
The dataset does not include any personally identifiable information beyond the user email domain. All analysis runs at session and suburb aggregate level. Individual user records never appear in any published output.
3. Methodology
3.1 Data Cleaning
Before building the index, we run the raw event log through a multi-stage cleaning process. The goal is to exclude non-genuine investor activity and remove systematic distortions.
Automated traffic exclusion. We exclude events where the user domain is report_generator. This domain corresponds to programmatic API usage. Automated report generation triggered by internal or third-party systems does not represent genuine investor research sessions. Including these events would systematically inflate the apparent interest in suburbs targeted by automated pipelines.
Demo suburb exclusion. We exclude four suburbs entirely from index rankings: Belmont North, Bondi, Castlecrag, and Windsor (Vic.). These suburbs feature in product demonstrations and sales presentations. Activity in them reflects platform demo behaviour, not genuine investor interest. Without this exclusion, their rankings would be artificially inflated.
Bot and outlier session detection. For each suburb in each measurement window, we assess the concentration of events across sessions. Where a single session accounts for more than 50% of all events attributed to a suburb, we flag that suburb as an outlier and exclude it from rankings. This heuristic catches cases where a single automated or test user dominates a suburb's signal. That pattern is inconsistent with the distributed, multi-user demand the index is designed to measure.
The three-stage cleaning pipeline ensures the index reflects genuine, distributed investor research behaviour. It strips out programmatic traffic, demonstration artefacts, and single-user distortions.
3.2 Geographic Mapping
We map suburb-level data to Australian Bureau of Statistics (ABS) geographic hierarchies using the 2021 mesh block concordance file. This concordance lets us attribute each suburb event to its containing GCCSA (Greater Capital City Statistical Area) and SA4 (Statistical Area Level 4) region.
We match platform suburb names to ABS SAL (Statistical Area of Locality) names via lowercase string comparison. Manual disambiguation covers known exceptions (e.g., “Windsor (Vic.)” to distinguish from the New South Wales locality of the same name).
GCCSA labels using the “Rest of [State]” convention are relabelled as “Regional [State]” throughout all published outputs. This improves readability and aligns with industry convention.
We compute mesh block count per SAL from the concordance as the count of distinct mesh block identifiers for each SAL. This count serves as the primary size normalisation denominator.
3.3 Primary Metrics
We compute four primary metrics for each suburb in each measurement window:
- Unique sessions: The count of distinct session IDs tied to a suburb within the measurement window. This is the primary ranking metric. We prefer it over raw event count because it prevents a single highly active user from inflating a suburb's position.
- Percentage of searches: Unique sessions for a suburb as a proportion of all unique sessions recorded across all suburbs in the same period. This metric allows comparison of relative interest share across periods with different total platform activity.
- Searches per mesh block: Unique sessions divided by the mesh block count for the suburb's SAL. ABS mesh blocks contain roughly 30 to 60 dwellings each. This normalisation controls for suburb size and identifies suburbs attracting disproportionate attention relative to their residential footprint. A signal of concentrated geographic interest.
- Rank change: The change in a suburb's rank position between the current and prior measurement window (current 7-day vs preceding 7-day, current 30-day vs preceding 30-day). Positive values indicate improved rank. Negative values indicate deterioration.
3.4 Temporal Windows
We publish two primary temporal windows for each index release:
- 7-day rolling window: The most recent seven calendar days of platform activity. This window is sensitive to emerging and transient demand signals. It is the primary window for identifying new hotspots.
- 30-day rolling window: The most recent thirty calendar days. This window smooths week-to-week variation and provides a confirmation signal for sustained investor interest.
We compute rank change for each window against its matching prior window. The 7-day window compares against the immediately preceding 7-day window. The 30-day window compares against the immediately preceding 30-day window. This ensures like-for-like temporal comparison.
4. Defence of Methodology
4.1 Why Unique Sessions Rather Than Raw Event Counts?
A naive approach might simply count the total number of report generation or visit events per suburb. This is easily distorted. A single user who generates or revisits a report for the same suburb multiple times within one session would artificially elevate that suburb's apparent popularity.
Unique session counts normalise for within-session repetition. Each session contributes at most one count to a suburb's tally, regardless of how many events that session generates. The meaningful signal is preserved: multi-session recurrence (the same suburb appearing across multiple distinct sessions, potentially across multiple users or time periods) remains detectable. That recurrence is itself a strong signal of sustained geographic interest.
Key claim: Unique sessions measure the breadth of interest in a suburb. How many distinct research episodes targeted it. Breadth is a more reliable proxy for distributed investor demand than depth of any single user's engagement.
4.2 Why Is GENERATION the Primary Event Type but VISIT Retained?
GENERATION events represent deliberate new searches. A user has requested a fresh report for a suburb or property not previously in their session history. This is the most direct observable signal of new interest in a geographic area. VISIT events represent a user returning to a previously generated report. That signals continued engagement rather than initial discovery.
We retain both event types in the session count metric. The unique session approach handles the potential for double-counting naturally. A session that both generates and subsequently visits a report for the same suburb contributes only one session count. Retaining VISIT events ensures we count sessions whose primary activity is revisiting reports. This behaviour is consistent with ongoing due diligence.
4.3 Why Mesh Blocks as the Size Normaliser?
Without size normalisation, raw search counts would systematically favour large suburbs. A suburb with 20,000 dwellings would attract more searches than one with 2,000 dwellings even if investor interest per dwelling were identical. The size-adjusted metric corrects for this by expressing searches relative to each suburb's residential footprint.
We selected mesh blocks as the normalisation unit for these reasons:
- They are the smallest standard ABS geographic unit. They provide the finest-grained size proxy available nationally with complete coverage.
- Mesh block count per SAL is directly computable from the ABS concordance file. No additional data sources or estimation are needed.
- Empirically, mesh block count tracks strongly with dwelling count at suburb level (r ≈ 0.94 based on the 2021 Census). This makes it a reliable proxy for residential footprint.
Alternative normalisers like dwelling count and population are available at SA1 or SA2 level. But they require extra concordance joins and introduce estimation error when disaggregated to SAL boundaries. Mesh blocks avoid this complexity while delivering equivalent normalisation quality.
The searches-per-mesh-block metric reveals suburbs attracting disproportionate attention relative to their size. This is the most useful signal for identifying genuinely high-conviction geographic demand, as distinct from large-suburb volume effects.
4.4 Representativeness and Platform Bias
The Microburbs user base is not a random sample of the Australian population. It over-represents active property investors, buyers agents, and property professionals relative to the general public. This is a deliberate design feature. And it is a feature of the index, not a deficiency.
The index is built to measure where motivated, research-active investors direct their attention. This population is precisely the one whose future purchase behaviour most influences suburb-level price and volume outcomes. An index calibrated to this population is better suited to its stated purpose (leading indicator of investor demand) than one calibrated to the general housing search population.
Analysts seeking to measure general population housing search behaviour should use REA Group's PropTrack demand metrics or Domain's equivalent products. Those draw on much larger but less targeted user populations.
A secondary factor is buyers agency firm activity. Buyers agents who conduct bulk suburb research on behalf of multiple clients may inflate search counts for suburbs under active investigation. The outlier session detection heuristic (greater than 50% single-session concentration) partially mitigates extreme cases. But moderate over-representation from buyers agency activity is expected. It is not necessarily a distortion. Buyers agents are themselves a meaningful signal of professional investor interest in a suburb.
4.5 Why Weekly Rather Than Monthly Publication?
Monthly aggregation is the dominant convention in Australian property data publishing. But monthly aggregation comes at a real cost to temporal resolution. A suburb that surged in week three and retreated by week four would appear as a moderate performer in the monthly rankings. Both the timing and magnitude of the demand signal get obscured.
Weekly windows preserve the temporal texture of investor interest. The 7-day window is short enough to capture emerging interest before it becomes widely recognised and acted upon. This is potentially the most useful window for active investors seeking to spot opportunities ahead of the market. The 30-day window provides a smoothed confirmation signal. Suburbs appearing consistently across multiple weekly windows accumulate into strong 30-day rankings. This separates sustained demand from transient noise.
The combination of 7-day and 30-day windows lets analysts distinguish between: (a) emerging suburbs showing a sharp recent spike (high 7-day rank, moderate 30-day rank); (b) sustained performers with durable investor interest (strong in both windows); and (c) fading suburbs whose interest peaked in a prior period (lower 7-day rank than 30-day rank).
4.6 Limitations
The following limitations are acknowledged. They should be considered when interpreting published rankings:
- Geographic platform penetration: Microburbs has stronger user penetration in Victoria and New South Wales than in other states and territories. This may over-represent Melbourne and Sydney suburbs relative to their true national investor share. Percentage-of-searches metrics should be interpreted with this in mind when comparing across jurisdictions.
- Minimum session threshold: The size-adjusted rankings require at least three sessions within the measurement window to reduce noise. This threshold introduces a bias against very small or newly-emerging suburbs. They may attract genuine but limited initial interest that falls below the threshold.
- Suburb name matching: Matching between platform suburb names and ABS SAL names relies on string normalisation. Suburbs with non-standard names, historical names, or disambiguation suffixes (such as “Windsor (Vic.)”) may fail to match correctly. This results in their exclusion from geographic hierarchy analysis.
- Single-week event susceptibility: The 7-day window is susceptible to transient external events. Media coverage, social media virality, or a high-profile listing can drive a short-term spike in search activity not representative of durable investor demand. The 30-day window should be consulted alongside the 7-day ranking to confirm sustained interest.
5. Key Findings (February 2026)
The following findings come from the index as at February 2026. They are based on the twelve-month dataset running from February 2025 through February 2026.
5.1 Short-Term Hotspots: 7-Day Rankings
The 7-day rolling window as at late February 2026 shows a concentration of emerging interest in Melbourne's outer growth corridors. One notable regional entrant also appears.
Clyde North's rank change of +387 positions is the most dramatic single-week emergence in the index period. This surge of concentrated investor attention warrants monitoring in the following 7-day and 30-day windows. It will clarify whether this represents a durable demand shift or a transient spike.
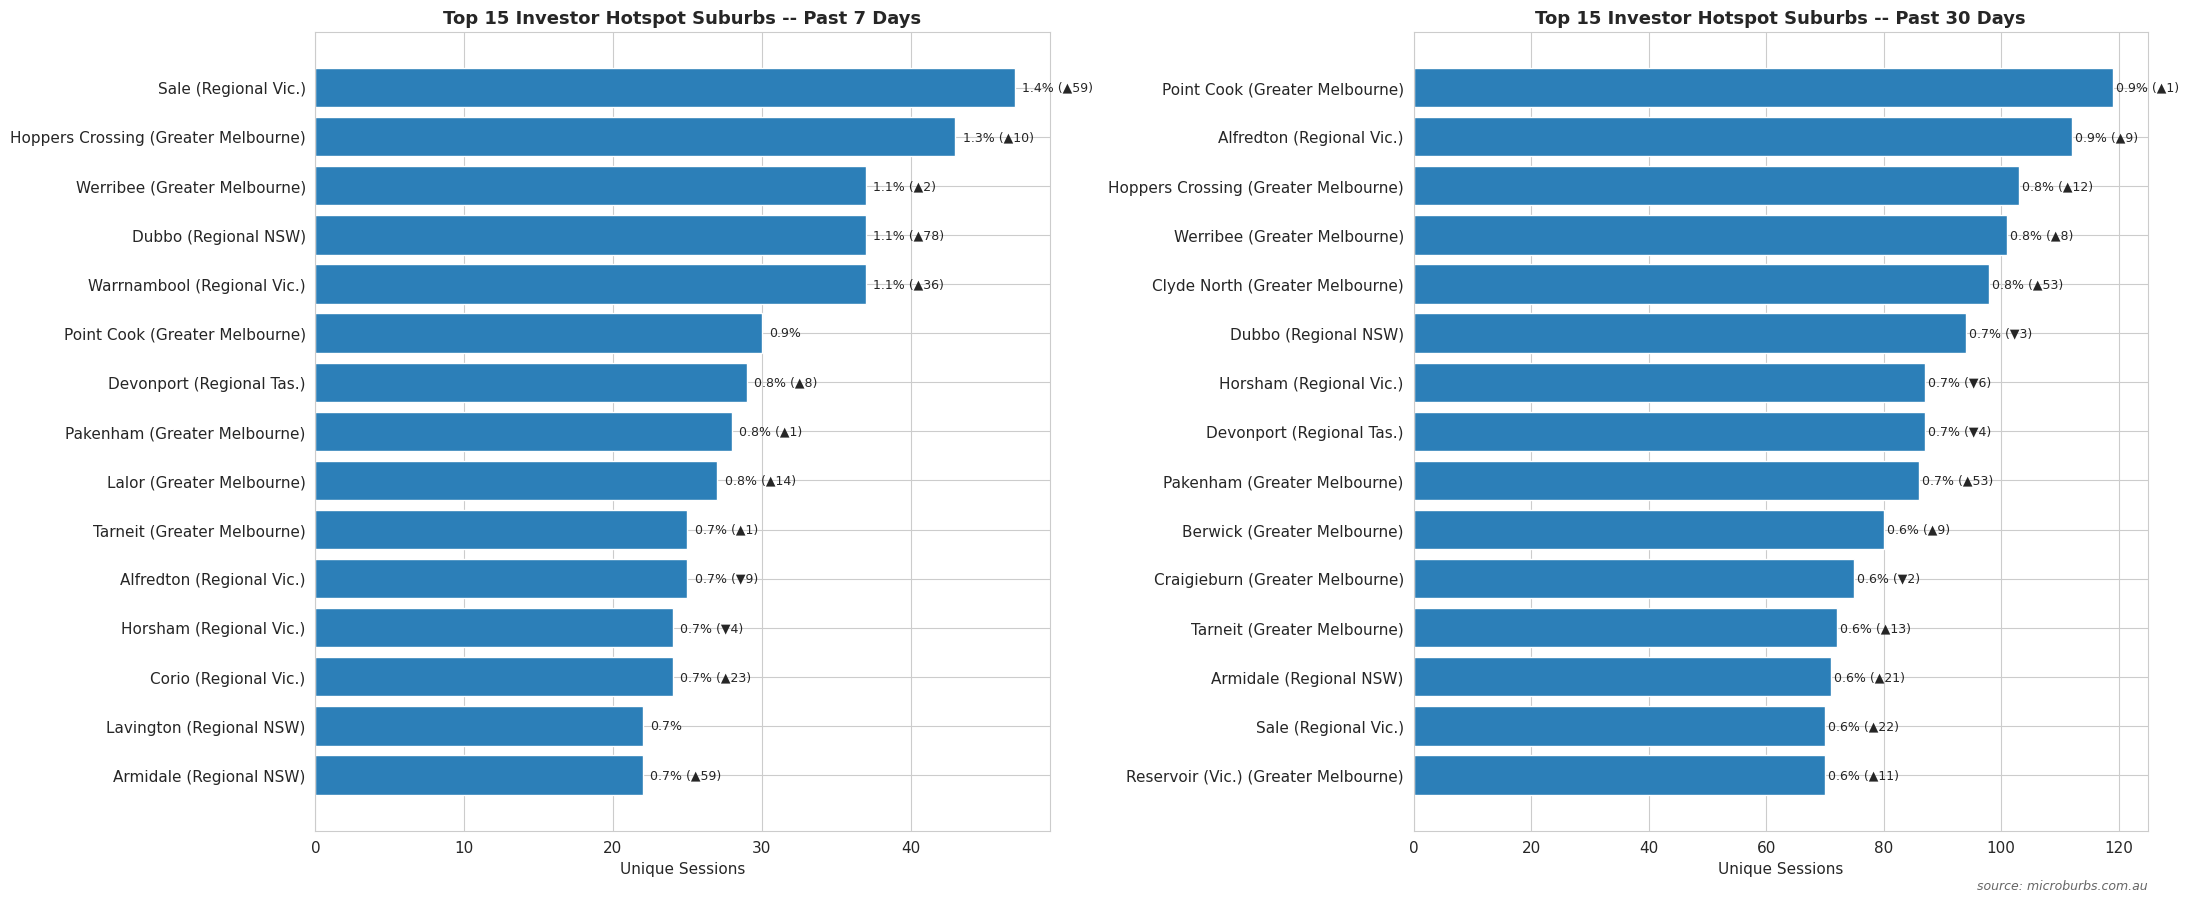
5.2 Medium-Term Hotspots: 30-Day Rankings
The 30-day window shows a more stable ordering. Melbourne's western and growth-corridor suburbs dominate. Alfredton (Ballarat) provides the strongest sustained regional signal.
Alfredton (Ballarat) is the standout regional signal this period. It ranks consistently at #2 to #3 across both the 7-day and 30-day windows. This represents the strongest sustained non-metropolitan investor demand signal in the dataset. The pattern fits with broader evidence of investor interest migrating toward high-yielding regional growth corridors as metro affordability constraints intensify.
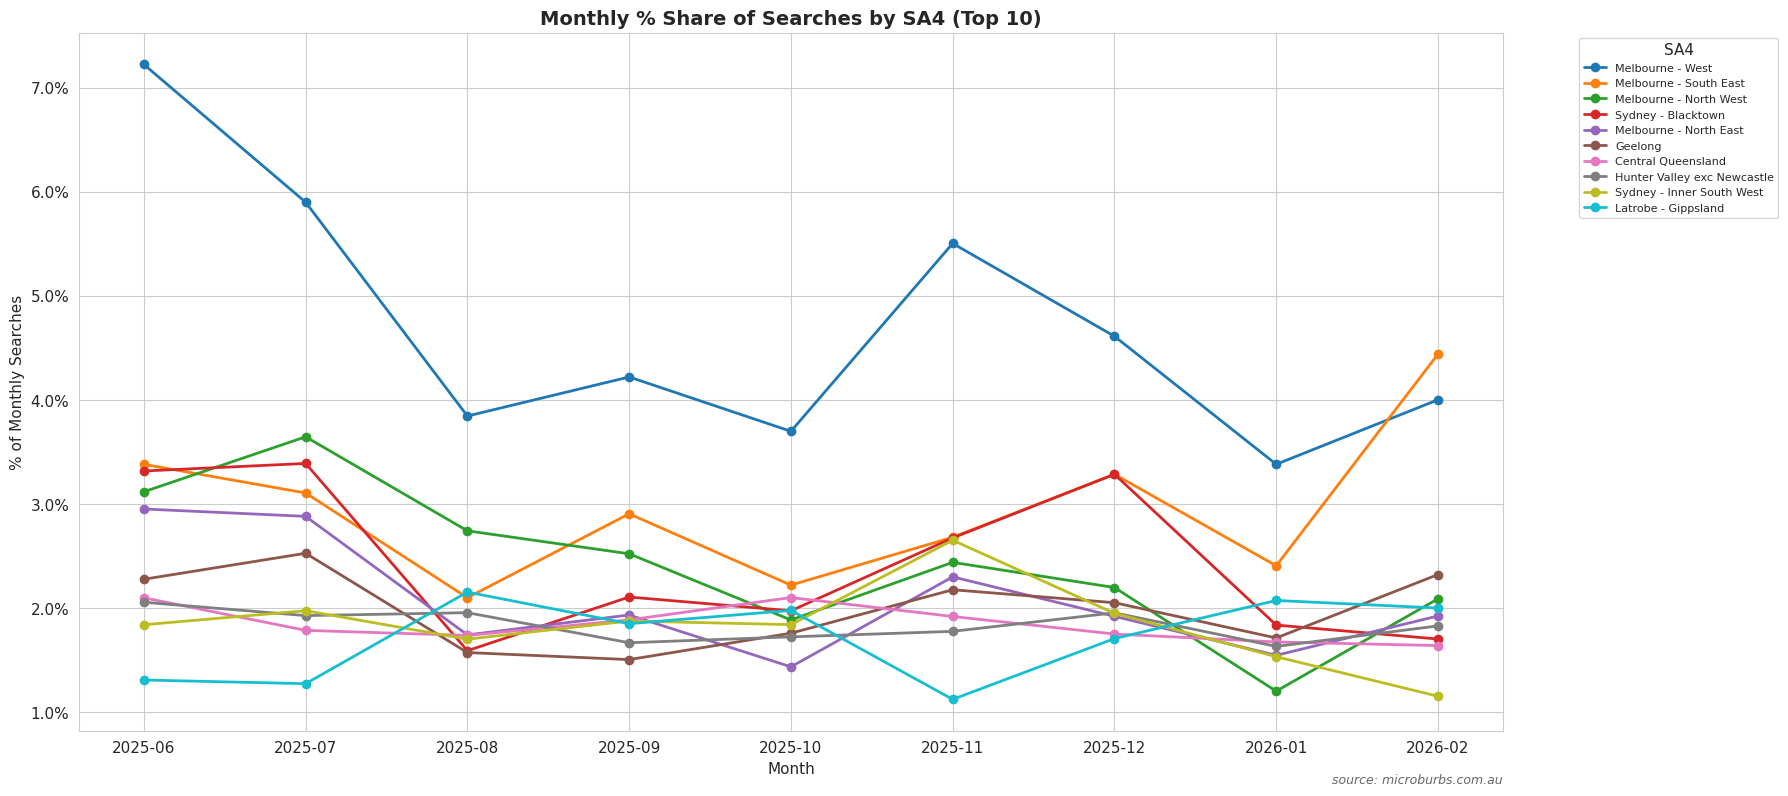
5.3 SA4 Regional Rankings
At the SA4 level, Melbourne - West leads nationally by total search volume over the twelve-month period with 14,257 unique sessions. This margin reflects both the density of the western growth corridor and the concentration of Microburbs platform users engaged with that market.
5.4 GCCSA Trends: Regional Markets Gaining Share
A striking finding from the twelve-month dataset is the rapid increase in investor search share directed toward regional (non-capital-city) markets. The following GCCSA-level shifts stand out:
Regional Victoria's search share has nearly doubled over the twelve-month period. That is the single largest GCCSA-level shift in the dataset. Sustained interest in Ballarat (Alfredton and surrounding suburbs) drives this growth, with Geelong-fringe and Bendigo localities contributing as well. The pattern is consistent across multiple regional markets nationally. Regional WA, Regional SA, and Regional Tasmania have each more than doubled their share of total investor searches over the period.
The consistent, broad-based shift in search share from metropolitan to regional markets over twelve months is the most significant structural finding in this dataset. It suggests a genuine, sustained reorientation of active investor research attention toward regional markets. If historical search-to-transaction relationships hold, this should show up in regional transaction volumes and price movements over the next six to twelve months.
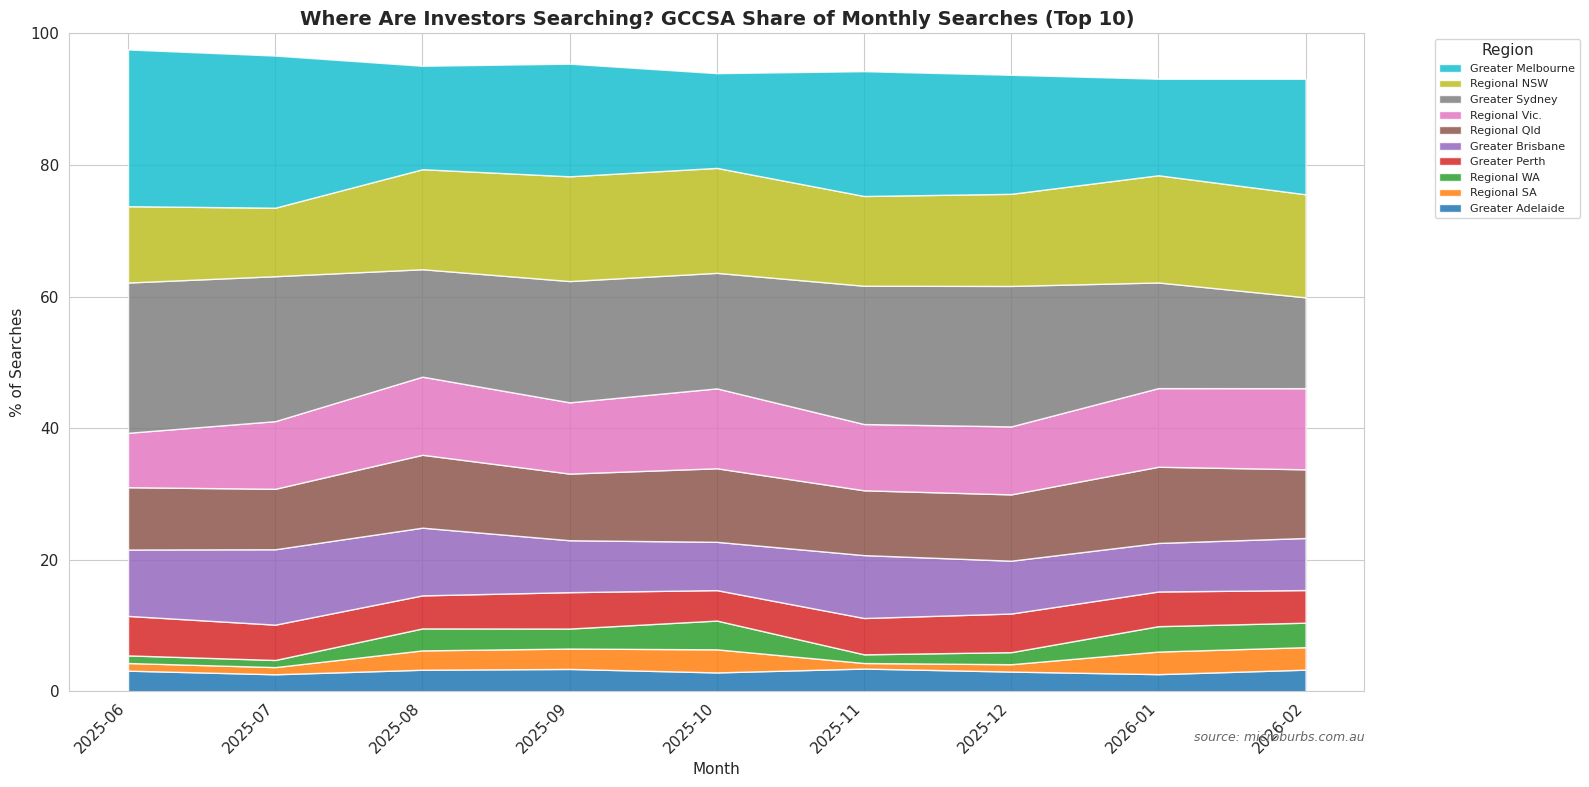
5.5 Capital City Concentration
Despite the growth of regional market interest, capital city markets retain dominant shares of total investor search activity. Greater Melbourne leads. Greater Melbourne and Greater Sydney together account for roughly 39% of all investor searches over the twelve-month period. This concentration reflects both the scale of investor activity in these markets and Microburbs' greater platform penetration among eastern-seaboard investors and buyers agents.
6. Conclusion
This paper has described the construction, cleaning, normalisation, and validation of a weekly suburb-level investor search intensity index from Microburbs platform event logs. The method handles common confounders through a multi-stage cleaning pipeline. Automated traffic, demonstration activity, and single-user concentration are all stripped out. Mesh block normalisation corrects for suburb size.
The index offers three properties that set it apart from existing publicly available demand measures. First, it is a leading indicator. Search behaviour precedes transactions by weeks to months. That gives a forward-looking signal unavailable in transaction-based indices. Second, it targets an active investor population. Microburbs users are engaged in active property research by construction. This makes the index a more targeted measure of motivated investor demand than general population search indices. Third, it publishes weekly. The 7-day rolling window provides temporal resolution that monthly competitor products from CoreLogic and PropTrack cannot match. It surfaces emerging demand surges before they appear in transaction data.
The key empirical finding from the February 2026 index is the sustained, broad-based shift of investor search interest from metropolitan to regional markets. Regional Victoria, Regional Western Australia, Regional South Australia, and Regional Tasmania have all roughly doubled or more their share of total investor searches since February 2025. If this shift predicts subsequent transaction activity as prior search-based literature suggests, it is a significant leading indicator for regional property market performance in 2026.
Future research will examine the predictive relationship between search intensity and subsequent price movements at suburb level. The full twelve-month dataset will serve as a backtesting period, with the analysis extending prospectively as the index matures. Specific areas of investigation include the optimal lag between search intensity peaks and transaction volume responses, the differential predictive power of GENERATION versus VISIT event types, and whether a composite leading index combining search intensity with transaction-based and listing-based measures is feasible.
The weekly suburb search intensity index is a timely, methodologically defensible leading indicator of investor demand. It complements transaction-based measures rather than replacing them. And it provides the temporal resolution and population targeting that existing competitor products do not offer.
References
- Beracha, E. and Johnson, K.H. (2012). Lessons from Over 30 Years of Buy versus Rent Decisions: Is the American Dream Always Wise? Real Estate Economics, 40(2), 217–247.
- Choi, H. and Varian, H. (2012). Predicting the Present with Google Trends. Economic Record, 88(S1), 2–9.
- Australian Bureau of Statistics (2021). Mesh Block Counts, Census of Population and Housing. ABS, Canberra.
- Australian Bureau of Statistics (2021). Australian Statistical Geography Standard (ASGS): Volume 1, Main Structure and Greater Capital City Statistical Areas. ABS, Canberra.
- CoreLogic (2025). Home Value Index Methodology. CoreLogic Australia, Sydney.
- PropTrack (2025). Property Market Indicators. REA Group, Melbourne.
Related Research
Access the Full Research Platform
Weekly search intensity data, suburb reports, and property-level analysis. All built on the methodology described in this paper.