Updated Weekly · Microburbs Research
Where Are Property Investors Searching?
Week Ending 24 Feb 2026
This report tracks where property investors are actually searching. Not where pundits say they should look. Where they look. Built from real search activity on Microburbs, updated 24 Feb 2026.
1. Trending Suburbs This Week
Key Takeaways
- Investors are clustering in Greater Melbourne and Regional Vic. Melbourne's western and south-eastern growth corridors dominate.
- Fast risers this week: Sale, Hoppers Crossing, Dubbo, Warrnambool, Lalor. All jumped sharply compared to the prior week.
- The "% of searches" column shows each suburb's share of national investor searches. "Weekly/monthly change" shows ranking movement (▲ up, ▼ down) vs the same prior period.
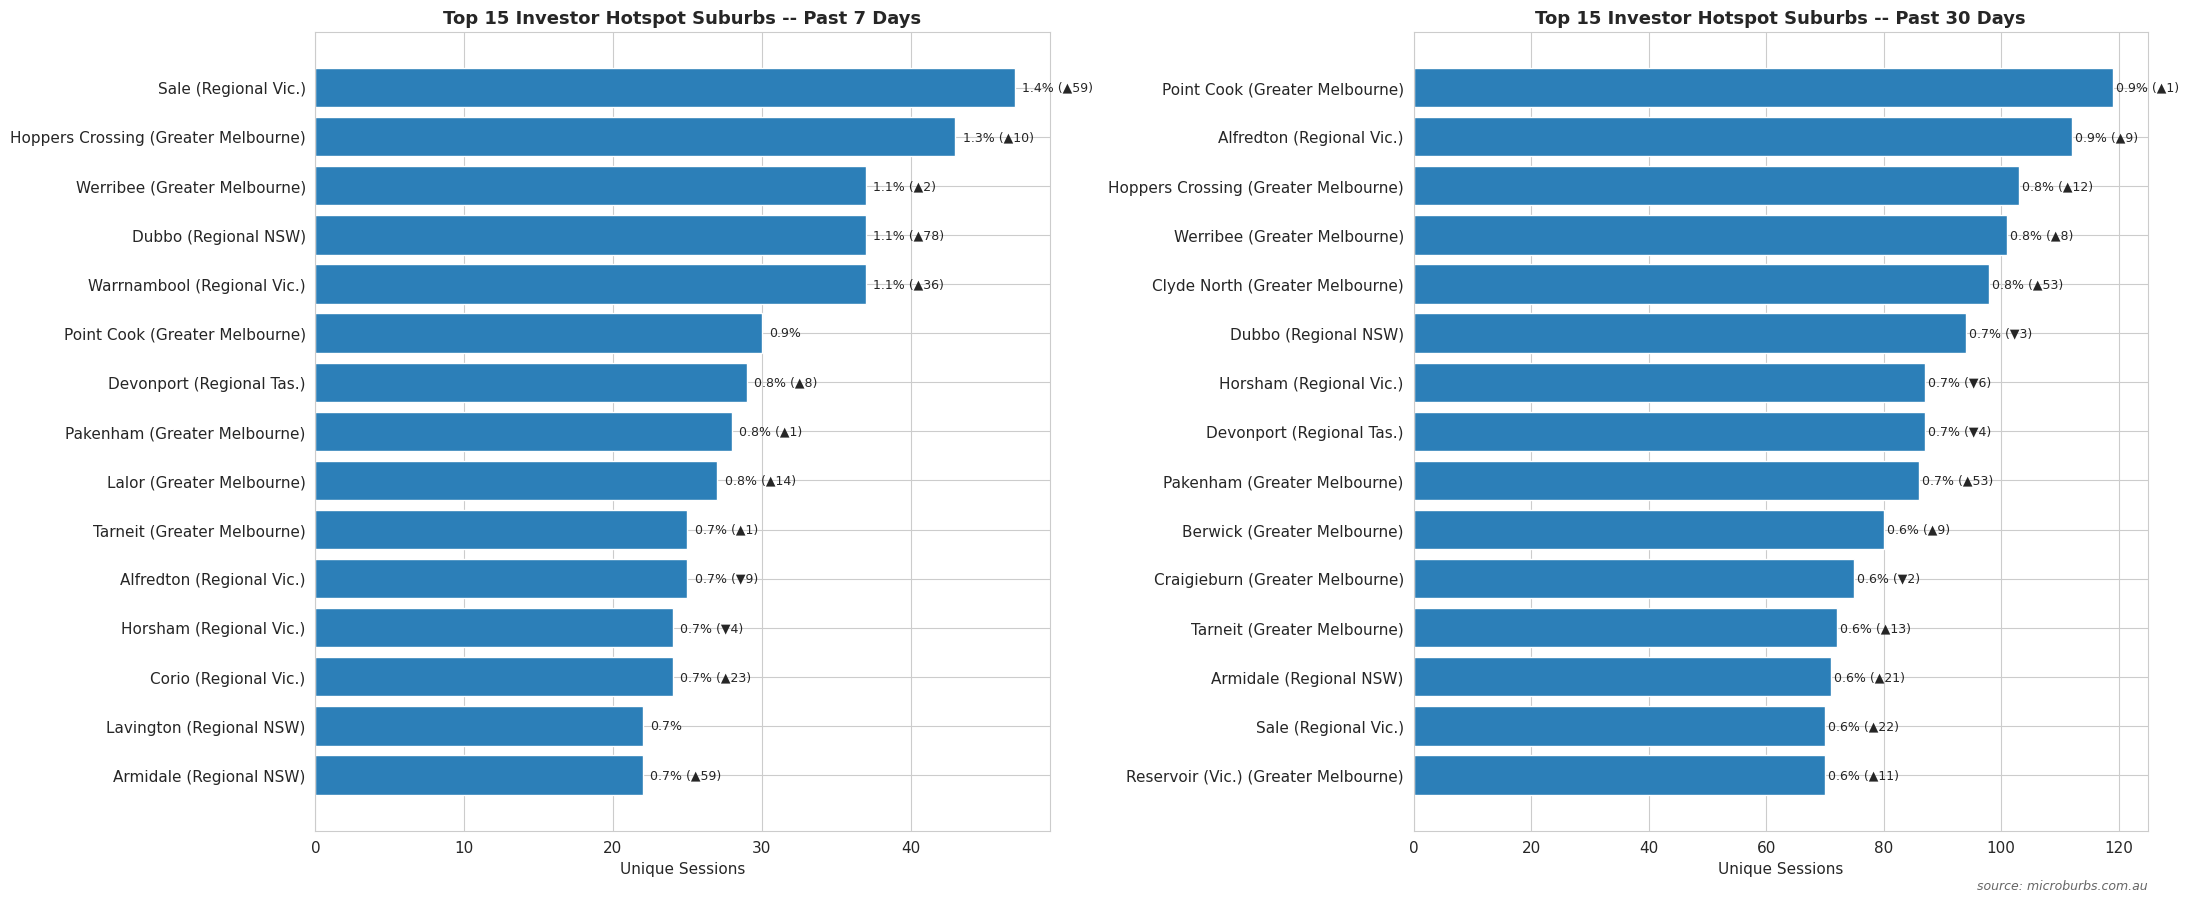
Past 7 Days (17 Feb - 24 Feb 2026)
| Rank | Suburb | GCCSA | SA4 | % of Searches | Search Intensity | Weekly Change |
|---|---|---|---|---|---|---|
| 1 | Sale | Regional Vic. | Latrobe - Gippsland | 1.38 | 0.205 | ▲59 |
| 2 | Hoppers Crossing | Greater Melbourne | Melbourne - West | 1.27 | 0.099 | ▲10 |
| 3 | Werribee | Greater Melbourne | Melbourne - West | 1.09 | 0.061 | ▲2 |
| 4 | Dubbo | Regional NSW | Far West and Orana | 1.09 | 0.057 | ▲78 |
| 5 | Warrnambool | Regional Vic. | Warrnambool and South West | 1.09 | 0.079 | ▲36 |
| 6 | Point Cook | Greater Melbourne | Melbourne - West | 0.88 | 0.049 | – |
| 7 | Devonport | Regional Tas. | West and North West | 0.85 | 0.124 | ▲8 |
| 8 | Pakenham | Greater Melbourne | Melbourne - South East | 0.82 | 0.052 | ▲1 |
| 9 | Lalor | Greater Melbourne | Melbourne - North East | 0.8 | 0.109 | ▲14 |
| 10 | Tarneit | Greater Melbourne | Melbourne - West | 0.74 | 0.044 | ▲1 |
| 11 | Alfredton | Regional Vic. | Ballarat | 0.74 | 0.179 | ▼9 |
| 12 | Horsham | Regional Vic. | North West | 0.71 | 0.107 | ▼4 |
| 13 | Corio | Regional Vic. | Geelong | 0.71 | 0.115 | ▲23 |
| 14 | Lavington | Regional NSW | Murray | 0.65 | 0.117 | – |
| 15 | Armidale | Regional NSW | New England and North West | 0.65 | 0.052 | ▲59 |
| 16 | Mildura | Regional Vic. | North West | 0.65 | 0.045 | ▲5 |
| 17 | Clyde North | Greater Melbourne | Melbourne - South East | 0.62 | 0.072 | ▼16 |
| 18 | Wodonga | Regional Vic. | Hume | 0.62 | 0.06 | ▲14 |
| 19 | Norlane | Regional Vic. | Geelong | 0.59 | 0.159 | ▼1 |
| 20 | Berwick | Greater Melbourne | Melbourne - South East | 0.56 | 0.036 | ▼17 |
| 21 | Reservoir (Vic.) | Greater Melbourne | Melbourne - North East | 0.56 | 0.03 | ▼11 |
| 22 | Cherrybrook | Greater Sydney | Sydney - Baulkham Hills and Hawkesbury | 0.56 | 0.103 | ▲92 |
| 23 | Shepparton | Regional Vic. | Shepparton | 0.56 | 0.042 | ▲42 |
| 24 | Risdon Vale | Greater Hobart | Hobart | 0.56 | 0.452 | ▲38 |
| 25 | Officer | Greater Melbourne | Melbourne - South East | 0.53 | 0.093 | ▼21 |
Past 30 Days (25 Jan - 24 Feb 2026)
| Rank | Suburb | GCCSA | SA4 | % of Searches | Search Intensity | Monthly Change |
|---|---|---|---|---|---|---|
| 1 | Point Cook | Greater Melbourne | Melbourne - West | 0.93 | 0.194 | ▲1 |
| 2 | Alfredton | Regional Vic. | Ballarat | 0.87 | 0.8 | ▲9 |
| 3 | Hoppers Crossing | Greater Melbourne | Melbourne - West | 0.8 | 0.238 | ▲12 |
| 4 | Werribee | Greater Melbourne | Melbourne - West | 0.79 | 0.167 | ▲8 |
| 5 | Clyde North | Greater Melbourne | Melbourne - South East | 0.77 | 0.336 | ▲53 |
| 6 | Dubbo | Regional NSW | Far West and Orana | 0.73 | 0.144 | ▼3 |
| 7 | Horsham | Regional Vic. | North West | 0.68 | 0.388 | ▼6 |
| 8 | Devonport | Regional Tas. | West and North West | 0.68 | 0.372 | ▼4 |
| 9 | Pakenham | Greater Melbourne | Melbourne - South East | 0.67 | 0.159 | ▲53 |
| 10 | Berwick | Greater Melbourne | Melbourne - South East | 0.62 | 0.153 | ▲9 |
| 11 | Craigieburn | Greater Melbourne | Melbourne - North West | 0.59 | 0.128 | ▼2 |
| 12 | Tarneit | Greater Melbourne | Melbourne - West | 0.56 | 0.127 | ▲13 |
| 13 | Armidale | Regional NSW | New England and North West | 0.55 | 0.167 | ▲21 |
| 14 | Sale | Regional Vic. | Latrobe - Gippsland | 0.55 | 0.306 | ▲22 |
| 15 | Reservoir (Vic.) | Greater Melbourne | Melbourne - North East | 0.55 | 0.11 | ▲11 |
| 16 | Officer | Greater Melbourne | Melbourne - South East | 0.52 | 0.345 | ▲268 |
| 17 | Wendouree | Regional Vic. | Ballarat | 0.52 | 0.407 | ▲7 |
| 18 | Mildura | Regional Vic. | North West | 0.52 | 0.136 | ▼2 |
| 19 | Lavington | Regional NSW | Murray | 0.52 | 0.351 | ▲33 |
| 20 | Warrnambool | Regional Vic. | Warrnambool and South West | 0.51 | 0.138 | ▲61 |
| 21 | Corio | Regional Vic. | Geelong | 0.51 | 0.312 | ▼13 |
| 22 | Wodonga | Regional Vic. | Hume | 0.49 | 0.18 | ▲8 |
| 23 | Frankston | Greater Melbourne | Mornington Peninsula | 0.48 | 0.105 | ▼16 |
| 24 | Shepparton | Regional Vic. | Shepparton | 0.47 | 0.134 | ▼3 |
| 25 | Morwell | Regional Vic. | Latrobe - Gippsland | 0.46 | 0.236 | ▲41 |
2. Small Suburbs Punching Above Their Weight
Key Takeaways
- Raw search counts favour big suburbs. That is misleading. Adjusting by suburb size (ABS mesh blocks, roughly 30 to 60 dwellings each) shows smaller suburbs pulling outsized investor attention.
- These suburbs tend to be early signals. They do not show up in headline rankings yet.
- A high search intensity score means investors are researching that suburb heavily relative to its size.
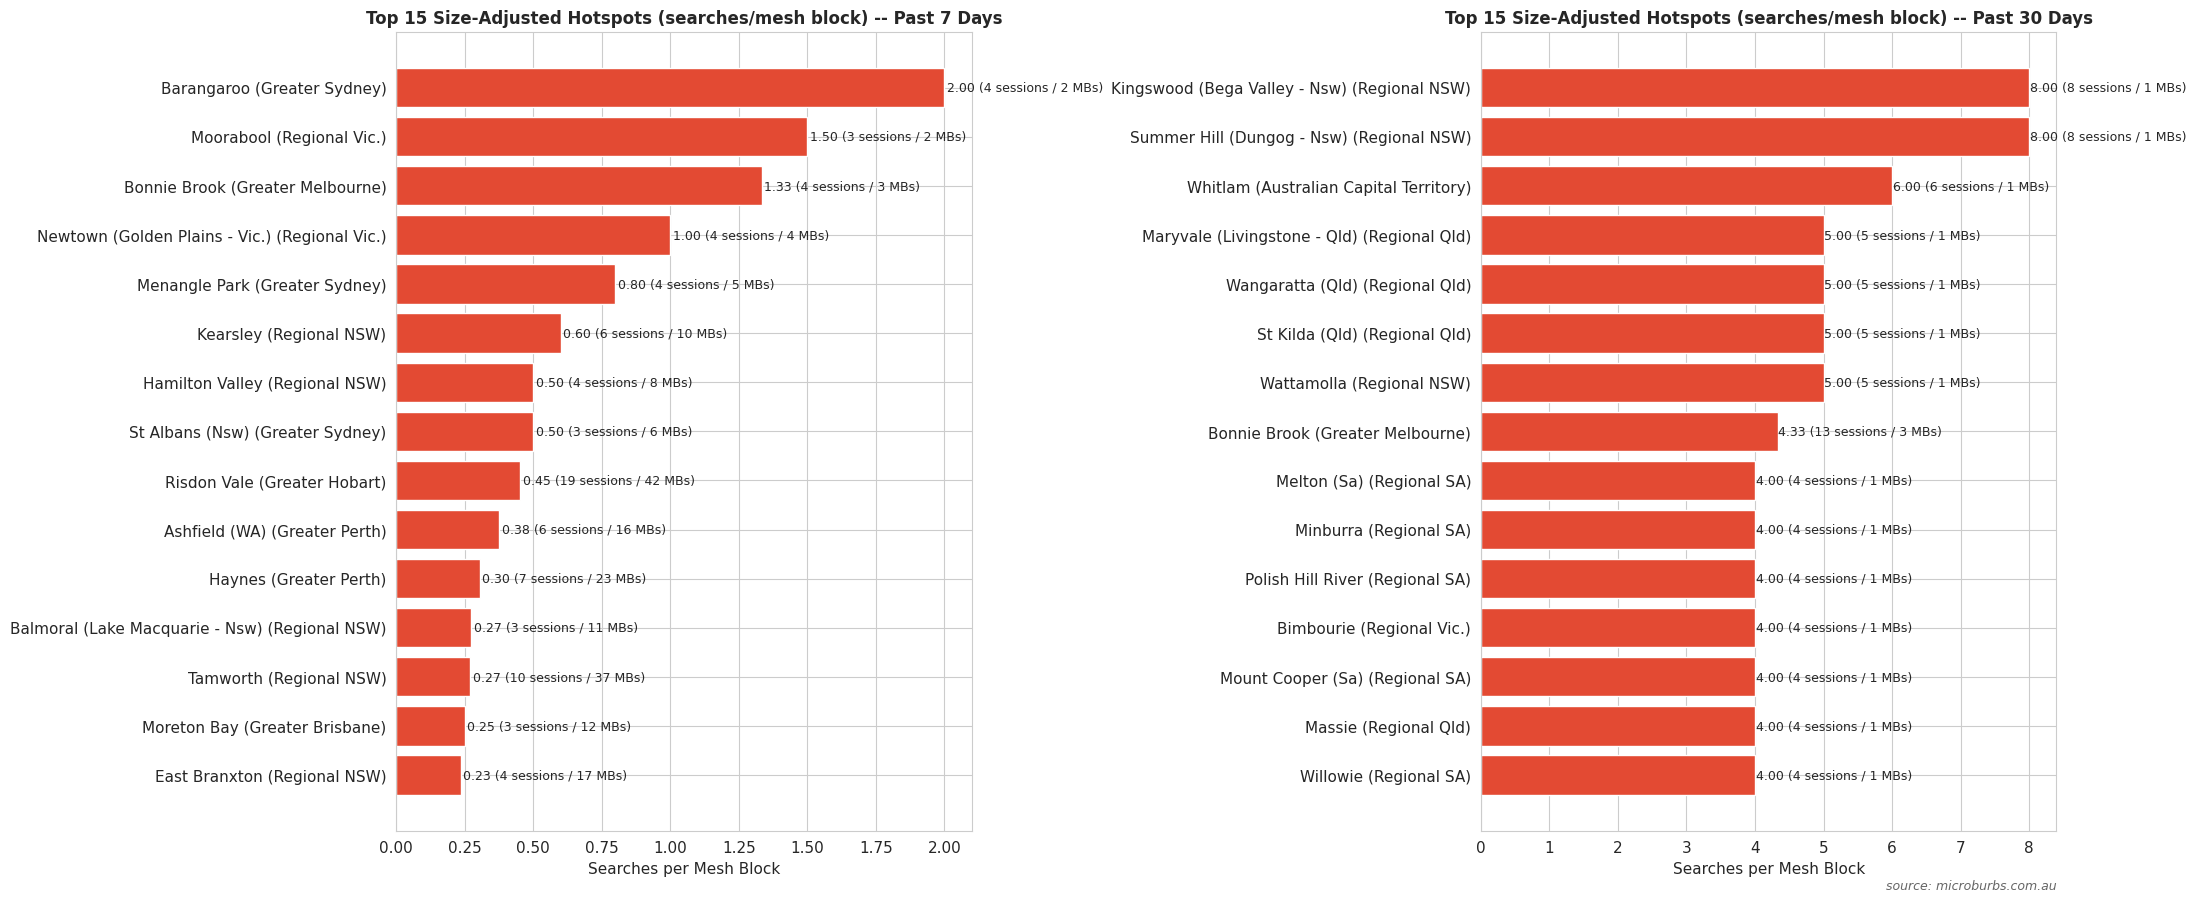
Highest Search Intensity, Past 7 Days
| Rank | Suburb | Unique Sessions | GCCSA | SA4 | Search Intensity | % of Searches |
|---|---|---|---|---|---|---|
| 1 | Barangaroo | 4 | Greater Sydney | Sydney - City and Inner South | 2 | 0.12 |
| 2 | Moorabool | 3 | Regional Vic. | Geelong | 1.5 | 0.09 |
| 3 | Bonnie Brook | 4 | Greater Melbourne | Melbourne - West | 1.333 | 0.12 |
| 4 | Newtown (Golden Plains - Vic.) | 4 | Regional Vic. | Ballarat | 1 | 0.12 |
| 5 | Menangle Park | 4 | Greater Sydney | Sydney - Outer South West | 0.8 | 0.12 |
| 6 | Kearsley | 6 | Regional NSW | Hunter Valley exc Newcastle | 0.6 | 0.18 |
| 7 | Hamilton Valley | 4 | Regional NSW | Murray | 0.5 | 0.12 |
| 8 | St Albans (Nsw) | 3 | Greater Sydney | Sydney - Baulkham Hills and Hawkesbury | 0.5 | 0.09 |
| 9 | Risdon Vale | 19 | Greater Hobart | Hobart | 0.452 | 0.56 |
| 10 | Ashfield (WA) | 6 | Greater Perth | Perth - North East | 0.375 | 0.18 |
| 11 | Haynes | 7 | Greater Perth | Perth - South East | 0.304 | 0.21 |
| 12 | Balmoral (Lake Macquarie - Nsw) | 3 | Regional NSW | Newcastle and Lake Macquarie | 0.273 | 0.09 |
| 13 | Tamworth | 10 | Regional NSW | New England and North West | 0.27 | 0.29 |
| 14 | Moreton Bay | 3 | Greater Brisbane | Brisbane - East | 0.25 | 0.09 |
| 15 | East Branxton | 4 | Regional NSW | Hunter Valley exc Newcastle | 0.235 | 0.12 |
| 16 | California Gully | 16 | Regional Vic. | Bendigo | 0.232 | 0.47 |
| 17 | Oxford Falls | 3 | Greater Sydney | Sydney - Northern Beaches | 0.231 | 0.09 |
| 18 | Acton (Tas.) | 5 | Regional Tas. | West and North West | 0.227 | 0.15 |
| 19 | Adelong | 5 | Regional NSW | Riverina | 0.227 | 0.15 |
| 20 | Newnham | 18 | Regional Tas. | Launceston and North East | 0.225 | 0.53 |
| 21 | Avenell Heights | 12 | Regional Qld | Wide Bay | 0.218 | 0.35 |
| 22 | Beaconsfield (Nsw) | 3 | Greater Sydney | Sydney - City and Inner South | 0.214 | 0.09 |
| 23 | Paxton | 3 | Regional NSW | Hunter Valley exc Newcastle | 0.214 | 0.09 |
| 24 | Donnybrook (Vic.) | 5 | Greater Melbourne | Melbourne - North East | 0.208 | 0.15 |
| 25 | Bellbird | 6 | Regional NSW | Hunter Valley exc Newcastle | 0.207 | 0.18 |
Highest Search Intensity, Past 30 Days
| Rank | Suburb | Unique Sessions | GCCSA | SA4 | Search Intensity | % of Searches |
|---|---|---|---|---|---|---|
| 1 | Kingswood (Bega Valley - Nsw) | 8 | Regional NSW | Capital Region | 8 | 0.06 |
| 2 | Summer Hill (Dungog - Nsw) | 8 | Regional NSW | Hunter Valley exc Newcastle | 8 | 0.06 |
| 3 | Whitlam | 6 | Australian Capital Territory | Australian Capital Territory | 6 | 0.05 |
| 4 | Maryvale (Livingstone - Qld) | 5 | Regional Qld | Central Queensland | 5 | 0.04 |
| 5 | Wangaratta (Qld) | 5 | Regional Qld | Townsville | 5 | 0.04 |
| 6 | St Kilda (Qld) | 5 | Regional Qld | Wide Bay | 5 | 0.04 |
| 7 | Wattamolla | 5 | Regional NSW | Southern Highlands and Shoalhaven | 5 | 0.04 |
| 8 | Bonnie Brook | 13 | Greater Melbourne | Melbourne - West | 4.333 | 0.1 |
| 9 | Melton (Sa) | 4 | Regional SA | Barossa - Yorke - Mid North | 4 | 0.03 |
| 10 | Minburra | 4 | Regional SA | Barossa - Yorke - Mid North | 4 | 0.03 |
| 11 | Polish Hill River | 4 | Regional SA | Barossa - Yorke - Mid North | 4 | 0.03 |
| 12 | Bimbourie | 4 | Regional Vic. | North West | 4 | 0.03 |
| 13 | Mount Cooper (Sa) | 4 | Regional SA | South Australia - Outback | 4 | 0.03 |
| 14 | Massie | 4 | Regional Qld | Darling Downs - Maranoa | 4 | 0.03 |
| 15 | Willowie | 4 | Regional SA | Barossa - Yorke - Mid North | 4 | 0.03 |
| 16 | Butler (Sa) | 4 | Regional SA | South Australia - Outback | 4 | 0.03 |
| 17 | Ascot (Ballarat - Vic.) | 4 | Regional Vic. | Ballarat | 4 | 0.03 |
| 18 | Billeroy | 4 | Regional NSW | Far West and Orana | 4 | 0.03 |
| 19 | Big Ridge | 4 | Regional NSW | Hunter Valley exc Newcastle | 4 | 0.03 |
| 20 | Langley | 4 | Regional Vic. | Bendigo | 4 | 0.03 |
| 21 | Wicherina | 4 | Regional WA | Western Australia - Outback (South) | 4 | 0.03 |
| 22 | Piney Range | 4 | Regional NSW | Central West | 4 | 0.03 |
| 23 | Miniyeri | 4 | Regional NT | Northern Territory - Outback | 4 | 0.03 |
| 24 | Charles Sturt University | 8 | Regional NSW | Riverina | 4 | 0.06 |
| 25 | North Yelta | 4 | Regional SA | Barossa - Yorke - Mid North | 4 | 0.03 |
3. Where Are Investors Looking? Regional Breakdown
Key Takeaways
- Greater Melbourne draws the largest share of investor searches. Accessible prices and solid rental yields in growth corridors explain why.
- Regional Victoria and Regional NSW together account for about 25% of all searches. Investors are looking well beyond capital cities for value.
- Greater Brisbane's share has steadied after a late-2025 spike. Greater Perth holds at roughly 6%.
- Regional Tasmania and Regional SA have grown their search share in recent months. More affordable markets are pulling new interest.
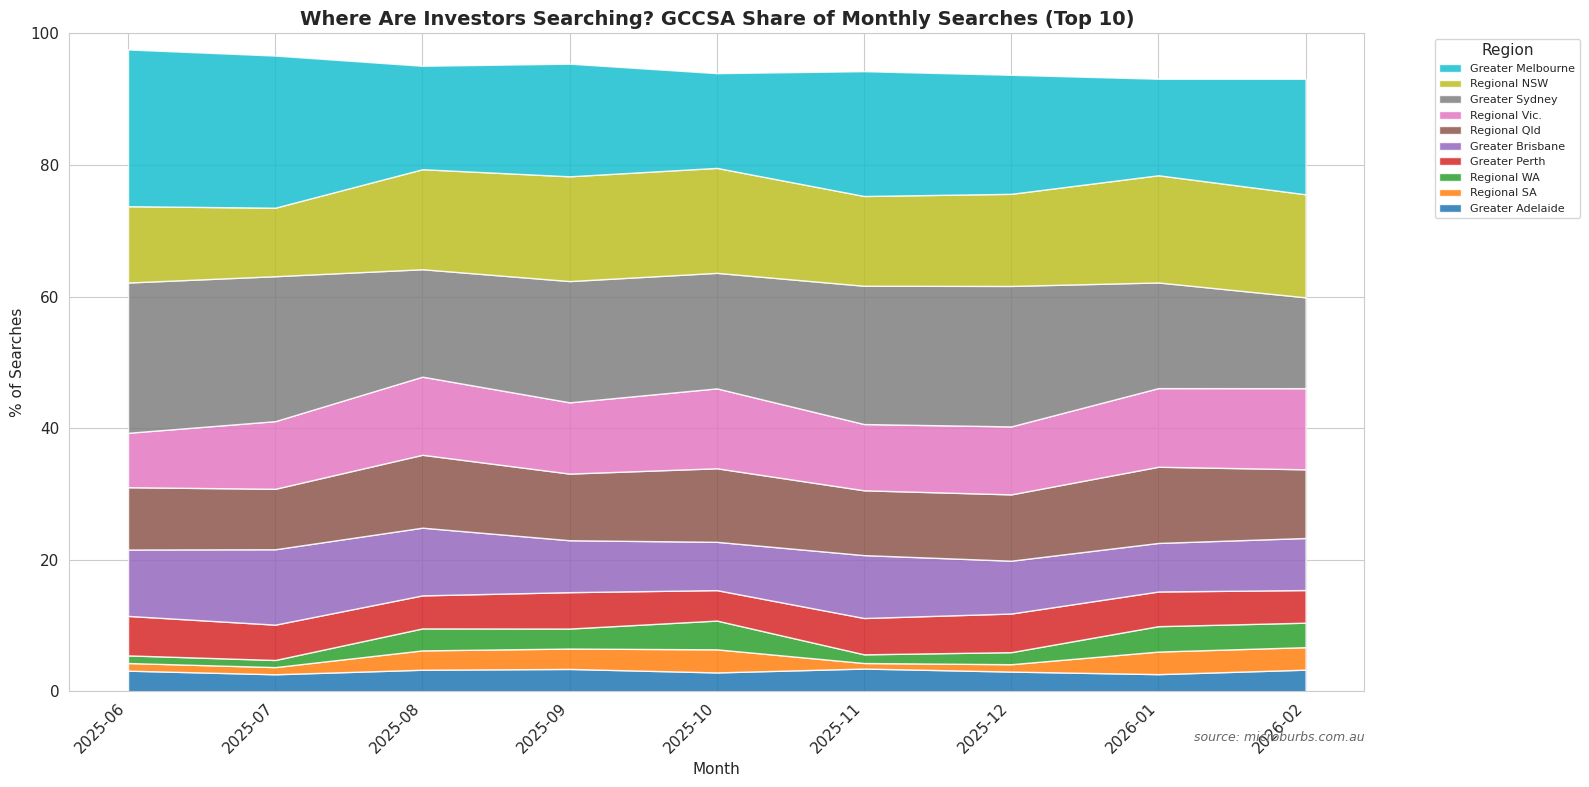
Share of Investor Searches by Region (%)
| Month | Greater Melbourne | Greater Sydney | Regional NSW | Regional Qld | Regional Vic. | Greater Brisbane | Greater Perth | Greater Adelaide | Regional WA | Regional SA | Regional Tas. | Greater Hobart | Australian Capital Territory | Greater Darwin | Regional NT | Other Territories |
|---|---|---|---|---|---|---|---|---|---|---|---|---|---|---|---|---|
| 2025-02 | 27.85 | 14.06 | 14.32 | 10.61 | 6.63 | 8.22 | 5.84 | 5.84 | 1.59 | 1.06 | 1.06 | 0.27 | 2.39 | 0.27 | 0 | 0 |
| 2025-03 | 26.86 | 13.93 | 9.51 | 13.76 | 7.51 | 7.59 | 10.51 | 5.25 | 2.17 | 1.5 | 0.33 | 0.42 | 0.33 | 0.33 | 0 | 0 |
| 2025-04 | 17.29 | 32.58 | 22.33 | 7.37 | 5.32 | 6.76 | 3.16 | 1.99 | 0.44 | 0.61 | 0.22 | 0.55 | 0.11 | 1.27 | 0 | 0 |
| 2025-05 | 22.71 | 19.1 | 15.63 | 11.01 | 8.13 | 10.62 | 6.13 | 2.59 | 1.33 | 0.67 | 0.46 | 0.35 | 0.6 | 0.6 | 0.07 | 0 |
| 2025-06 | 23.82 | 22.84 | 11.6 | 9.47 | 8.27 | 10.09 | 6 | 3.14 | 1.16 | 1.16 | 0.72 | 0.52 | 0.66 | 0.49 | 0.06 | 0 |
| 2025-07 | 23.12 | 22.03 | 10.41 | 9.19 | 10.28 | 11.46 | 5.37 | 2.59 | 1.08 | 1.09 | 1.03 | 0.95 | 0.69 | 0.61 | 0.08 | 0.01 |
| 2025-08 | 15.72 | 16.33 | 15.2 | 11.08 | 11.87 | 10.29 | 5.02 | 3.28 | 3.34 | 2.94 | 2.18 | 1.1 | 0.54 | 0.57 | 0.51 | 0.02 |
| 2025-09 | 17.12 | 18.43 | 15.92 | 10.13 | 10.83 | 7.89 | 5.53 | 3.4 | 3.04 | 3.1 | 2.07 | 0.75 | 0.7 | 0.52 | 0.57 | 0.01 |
| 2025-10 | 14.4 | 17.56 | 15.95 | 11.18 | 12.14 | 7.34 | 4.63 | 2.87 | 4.37 | 3.51 | 2.91 | 1.15 | 0.78 | 0.37 | 0.86 | 0.01 |
| 2025-11 | 18.97 | 21.02 | 13.64 | 9.85 | 10.07 | 9.56 | 5.52 | 3.46 | 1.32 | 0.84 | 2.56 | 1.94 | 0.69 | 0.48 | 0.1 | 0 |
| 2025-12 | 18.09 | 21.35 | 14 | 10.08 | 10.33 | 8.03 | 5.87 | 3 | 1.83 | 1.12 | 3.3 | 1.8 | 0.71 | 0.33 | 0.14 | 0.01 |
| 2026-01 | 14.67 | 16.06 | 16.29 | 11.58 | 11.95 | 7.38 | 5.27 | 2.61 | 3.86 | 3.43 | 3.24 | 1.33 | 1.24 | 0.52 | 0.54 | 0.02 |
| 2026-02 | 17.62 | 13.99 | 15.64 | 10.39 | 12.3 | 7.87 | 4.97 | 3.28 | 3.69 | 3.38 | 3.08 | 1.72 | 1.09 | 0.47 | 0.5 | 0.02 |
4. Investor Interest by SA4 Region, Monthly
Key Takeaways
- Melbourne - West (Werribee, Point Cook, Hoppers Crossing, Tarneit) is the most searched SA4 in Australia. New housing stock at lower price points drives the attention.
- Regional SA4s like Ballarat, Latrobe - Gippsland, and New England and North West show sustained interest. The regional investment trend is real.
- Sydney's SA4s rank lower than Melbourne equivalents. Price is the obvious reason.
- Wide Bay (Hervey Bay, Bundaberg area) has settled into the top 10 SA4s. Affordability and lifestyle pull investors there.
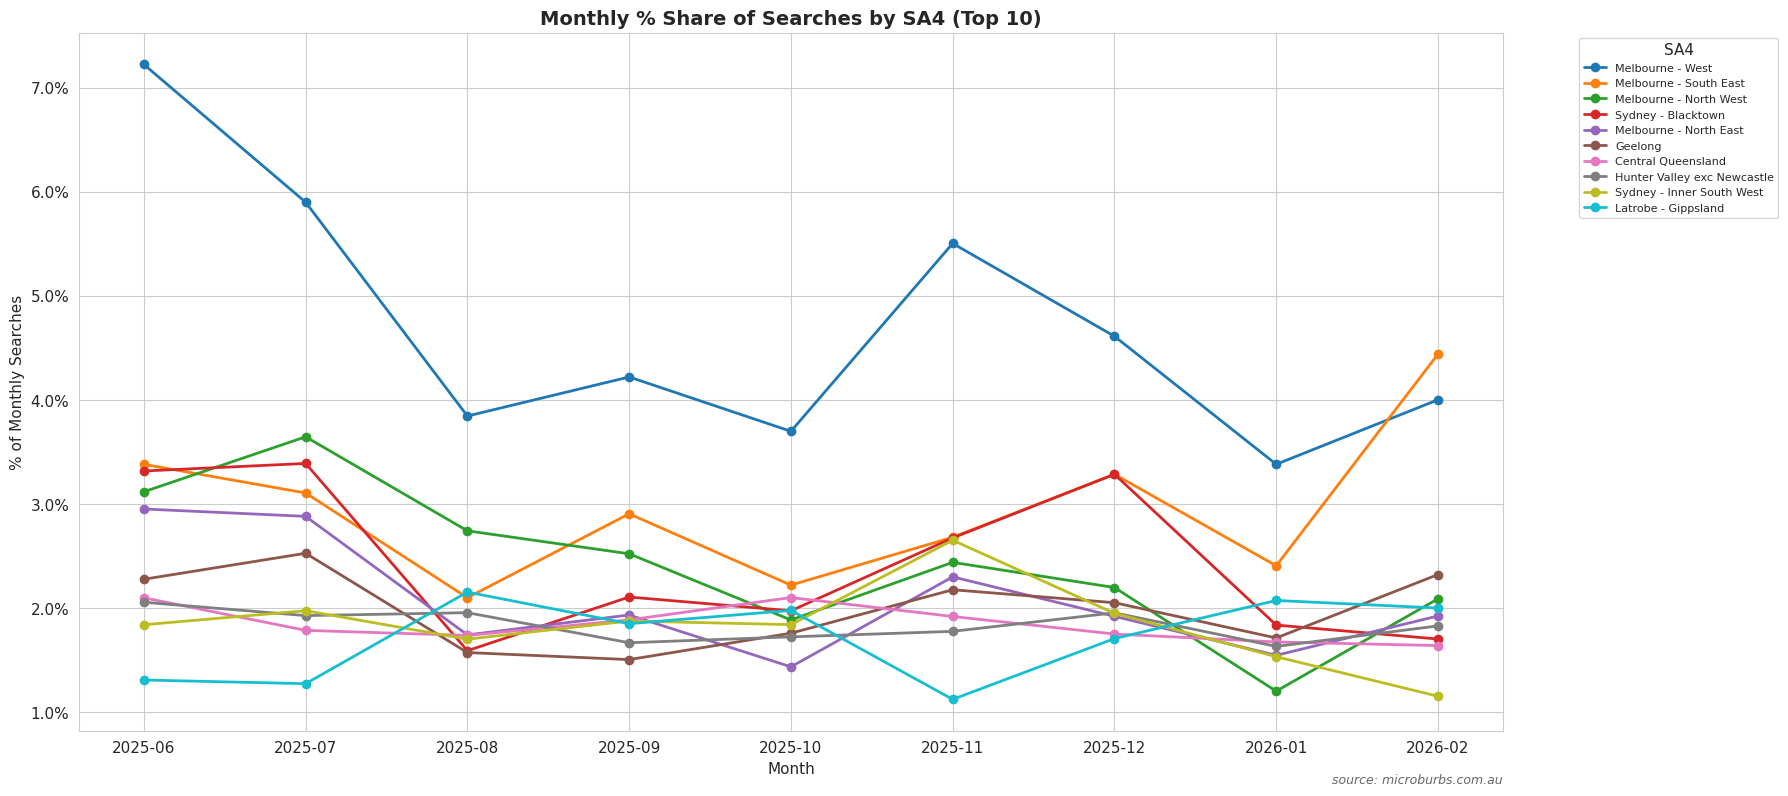
Top 30 SA4 Regions, Monthly Search Trends
| Month | Melbourne - West | Melbourne - South East | Melbourne - North West | Sydney - Blacktown | Melbourne - North East | Geelong | Central Queensland | Hunter Valley exc Newcastle | Sydney - Inner South West | Latrobe - Gippsland | Ipswich | Central Coast | Ballarat | North West | Newcastle and Lake Macquarie | Sydney - Parramatta | New England and North West | Bendigo | Wide Bay | Perth - South East | Melbourne - Inner | Sydney - North Sydney and Hornsby | Melbourne - Outer East | Cairns | Riverina | Brisbane - South | Perth - North West | Logan - Beaudesert | Sydney - Outer South West | Hobart |
|---|---|---|---|---|---|---|---|---|---|---|---|---|---|---|---|---|---|---|---|---|---|---|---|---|---|---|---|---|---|---|
| 2025-02 | 26 | 10 | 18 | 9 | 15 | 7 | 6 | 13 | 0 | 2 | 9 | 3 | 1 | 5 | 14 | 0 | 2 | 5 | 0 | 4 | 7 | 4 | 4 | 0 | 3 | 2 | 8 | 7 | 2 | 1 |
| 2025-03 | 119 | 35 | 49 | 13 | 50 | 20 | 31 | 18 | 35 | 16 | 19 | 7 | 16 | 13 | 24 | 13 | 15 | 9 | 10 | 35 | 19 | 18 | 5 | 24 | 9 | 10 | 22 | 10 | 9 | 5 |
| 2025-04 | 87 | 23 | 67 | 55 | 50 | 20 | 27 | 45 | 56 | 13 | 36 | 57 | 6 | 12 | 98 | 49 | 30 | 18 | 19 | 16 | 37 | 50 | 12 | 21 | 37 | 10 | 13 | 18 | 27 | 10 |
| 2025-05 | 181 | 64 | 112 | 62 | 95 | 79 | 47 | 100 | 46 | 15 | 79 | 33 | 26 | 34 | 100 | 42 | 36 | 43 | 35 | 49 | 53 | 54 | 47 | 56 | 34 | 45 | 37 | 36 | 22 | 10 |
| 2025-06 | 1702 | 797 | 735 | 782 | 696 | 537 | 495 | 485 | 434 | 309 | 496 | 329 | 213 | 310 | 439 | 499 | 221 | 266 | 331 | 360 | 376 | 437 | 381 | 298 | 130 | 333 | 368 | 339 | 394 | 122 |
| 2025-07 | 1498 | 789 | 926 | 861 | 732 | 642 | 454 | 490 | 502 | 324 | 578 | 393 | 378 | 303 | 315 | 491 | 259 | 565 | 211 | 436 | 408 | 458 | 529 | 386 | 179 | 363 | 375 | 534 | 449 | 242 |
| 2025-08 | 1497 | 818 | 1068 | 620 | 679 | 613 | 677 | 762 | 663 | 839 | 925 | 671 | 536 | 696 | 647 | 564 | 635 | 768 | 706 | 643 | 442 | 554 | 427 | 499 | 440 | 578 | 442 | 617 | 368 | 428 |
| 2025-09 | 1616 | 1113 | 966 | 807 | 741 | 577 | 723 | 639 | 719 | 709 | 572 | 647 | 521 | 655 | 787 | 721 | 784 | 663 | 585 | 640 | 464 | 494 | 447 | 503 | 589 | 558 | 428 | 475 | 412 | 288 |
| 2025-10 | 1891 | 1136 | 965 | 1010 | 735 | 900 | 1075 | 882 | 942 | 1012 | 802 | 916 | 824 | 1125 | 737 | 739 | 893 | 777 | 790 | 637 | 662 | 717 | 605 | 682 | 905 | 531 | 587 | 526 | 526 | 587 |
| 2025-11 | 1736 | 846 | 770 | 844 | 726 | 687 | 606 | 561 | 837 | 355 | 433 | 704 | 696 | 445 | 707 | 565 | 490 | 548 | 238 | 488 | 536 | 481 | 306 | 515 | 540 | 650 | 432 | 365 | 399 | 611 |
| 2025-12 | 950 | 677 | 453 | 677 | 396 | 423 | 361 | 403 | 402 | 352 | 383 | 424 | 407 | 282 | 304 | 389 | 314 | 303 | 205 | 317 | 376 | 281 | 274 | 390 | 435 | 213 | 246 | 261 | 380 | 370 |
| 2026-01 | 1503 | 1070 | 535 | 817 | 688 | 762 | 745 | 726 | 682 | 922 | 688 | 765 | 917 | 749 | 614 | 666 | 821 | 661 | 855 | 514 | 628 | 476 | 766 | 659 | 557 | 441 | 588 | 488 | 640 | 592 |
| 2026-02 | 1885 | 2069 | 974 | 804 | 903 | 1077 | 765 | 849 | 536 | 930 | 703 | 569 | 896 | 801 | 609 | 624 | 789 | 573 | 825 | 654 | 555 | 532 | 752 | 483 | 590 | 710 | 607 | 475 | 459 | 802 |
Method: This analysis uses property and suburb research activity on the Microburbs platform. "Searches" are individual suburb or property report lookups. We clean the data to exclude automated traffic and test activity. Suburbs map to ABS statistical regions (SA4, GCCSA) via the 2021 ABS mesh block concordance. Search intensity equals searches divided by the number of ABS mesh blocks in each suburb. Ranking changes compare the current period to the same prior period (e.g. this week vs last week).
Related Research
Blog Post
Investor Search Trends
Weekly commentary on where investors are searching. Charts, rankings, and regional breakdowns.
Whitepaper
Investor Search Intensity Index
Full methodology, validation, and 12-month analysis of investor search behaviour across Australia.
Original Report
Hotspot Report v1
The original edition of this weekly hotspot report with full suburb and region rankings.
See Which Suburbs Investors Are Watching Right Now
Get full access to Microburbs investor search data, suburb rankings, and research tools. Updated weekly.
Want the deeper analysis? Read the full trends report →