
What we found
- Sri Lankans lead. 53% of Sri Lankan Australians live in a mortgaged home, against 38% of all Australians (2021).
- Indians are right behind. 50% of Indian Australians live in a home with a mortgage (2021).
- Age and arrival year do not explain it. Matched with people the same age who arrived the same year, Sri Lankans still have about ten more mortgages in every hundred.
- Greeks and Macedonians have paid theirs off. Half of each group live in a home owned outright (2021).
The story: which communities in Australia have the most mortgages?
Sri Lankan Australians lead. In 2021, 53% of Sri Lankan adults lived in a home with a mortgage. Tamil and Sinhalese Australians were at 52%. Indian Australians were close behind at 50%.
Across all Australians aged 20 and over, the figure was 38%. Chinese and Vietnamese Australians were at 45%. English and Irish Australians were near 37%.
These figures count adults by the ancestry they gave in the 2021 Census. A person counts as mortgaged when their household was paying off its home.
Is it just because they are young and new arrivals?
That was the first thing we checked. We matched each group with people of the same age and arrival year.
The gap barely shrinks. Sri Lankans still have about ten more mortgages in every hundred than people like them. Indians have about nine more.
Other groups go the other way. Koreans have about six fewer in every hundred, and nearly half rent. Japanese Australians have about fifteen fewer. The census records who has a mortgage. It does not say why.
Where are the mortgage belts in Melbourne and Sydney?
In Melbourne they sit on the new estates of the west and south-east. In Clyde North, one in four people have Indian or Sri Lankan roots. Seven in ten homes there had a mortgage in 2021, twice the share of homes across Australia (35%).
Tarneit and Truganina, in Melbourne's west, are similar. More than a quarter of people there have Indian or Sri Lankan roots. About 57% of homes in each had a mortgage in 2021.
Sydney shows two pictures. In Harris Park and Parramatta, about three in ten people have Indian or Sri Lankan roots. About seven in ten homes there are rented. Out at Marsden Park, in the north-west, a quarter have those roots. There, 69% of homes had a mortgage in 2021.
Who owns their home outright?
Australians of Southern European ancestry lead here. In 2021, 54% of Maltese Australians lived in a home owned outright. Greek and Macedonian Australians were at 50%, and Croatians at 48%.
Italian Australians were at 42%. Across all Australians, about a third lived in a home owned outright.
How we made this reel
- We counted every adult by ancestry. Each adult 20 and over, by the ancestry they gave in the 2021 Census.
- Then we checked their home. Owned outright, mortgaged or rented, as each household reported it.
- Then we compared like with like. Each group against people of the same age who arrived in the same years.
What it means for you
- Mortgage belts move with new estates. In Clyde North and Marsden Park, most homes carry a loan (2021).
- Renters cluster closer in. In Harris Park and Parramatta, Sydney, about seven in ten homes are rented (2021).
- Check the street, not just the suburb. The share of mortgaged homes changes from block to block.
Where to see it on Microburbs
- Home ownership, in every suburb report. Open Demographics and read the share owned outright, mortgaged and rented.
- Block by block. The report splits each suburb into small areas, each with its own mix.
See mortgages in St Kilda (Vic.) →
Get the data
The mortgage share for every suburb and every small area in it comes from one request: homes owned outright, mortgaged and rented, from the 2021 Census.
This is one of about 17,000 fields you can request from our data service, for any suburb in Australia.
Try it now, free
Live and in our data service. In St Kilda, Melbourne, 24% of homes had a mortgage and about half were rented, across 330 small areas (2021 Census). This request is free for our sample suburbs and homes, one in each state and territory, with no sign up and no card.
curl "https://api.microburbs.com.au/v1/suburbs/St%20Kilda%20%28Vic.%29/demographics/tenure" \
  -H "Authorization: Bearer test"
What it sent back on 12 November 2026, in 1.3 seconds. Each list is cut to its first three entries here; the longest holds 330.
{
  "data": {
    "suburb": "St Kilda (Vic.)",
    "census_year": 2021,
    "owned_outright_pct": 23.7,
    "mortgaged_pct": 23.6,
    "owner_occupied_pct": 47.3,
    "renting_pct": 50.5,
    "public_housing_pct": 2.2,
    "tier": "Investor-Heavy",
    "n_microburbs": 330,
    "microburbs": [
      {
        "mb": "20520220000",
        "street": "Alfred",
        "owned_outright_pct": 22.4,
        "mortgaged_pct": 20.6,
        "renting_pct": 55.2,
        "public_housing_pct": 0.6
      },
      {
        "mb": "20520230000",
        "street": "Acland",
        "owned_outright_pct": 26.4,
        "mortgaged_pct": 22.2,
        "renting_pct": 48.7,
        "public_housing_pct": 0.0
      },
      {
        "mb": "20520240000",
        "street": "Shakespeare",
        "owned_outright_pct": 23.9,
        "mortgaged_pct": 23.1,
        "renting_pct": 51.1,
        "public_housing_pct": 1.3
      }
    ]
  }
}
See the full API docs for every request, the price of each and how to get a key for the rest of Australia.
See the mortgages in any suburb
Home ownership, in every suburb report. Open Demographics and read the share owned outright, mortgaged and rented.
More reels
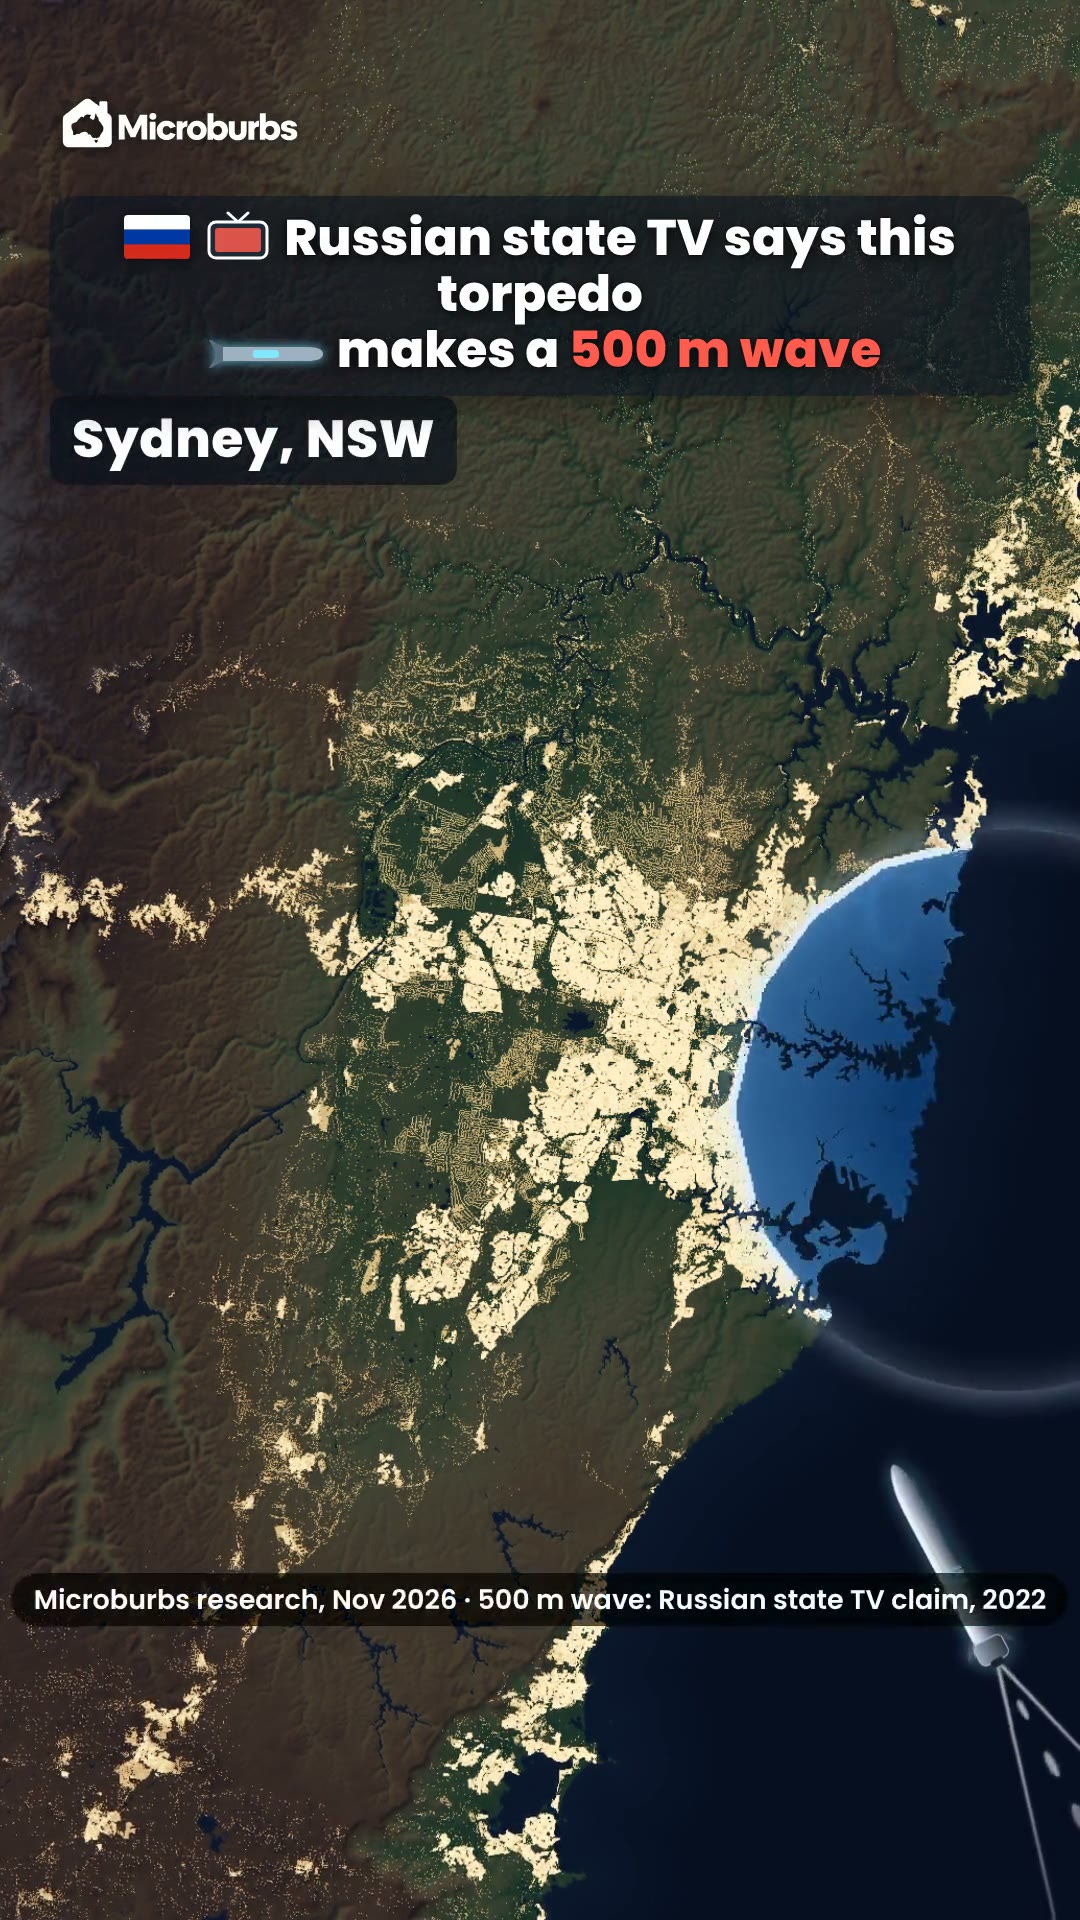 Could a nuclear tsunami hit Sydney? Russia's Poseidon torpedo and the real wave
 Flags with the Southern Cross: 99 Australian designs, and the ones people fly
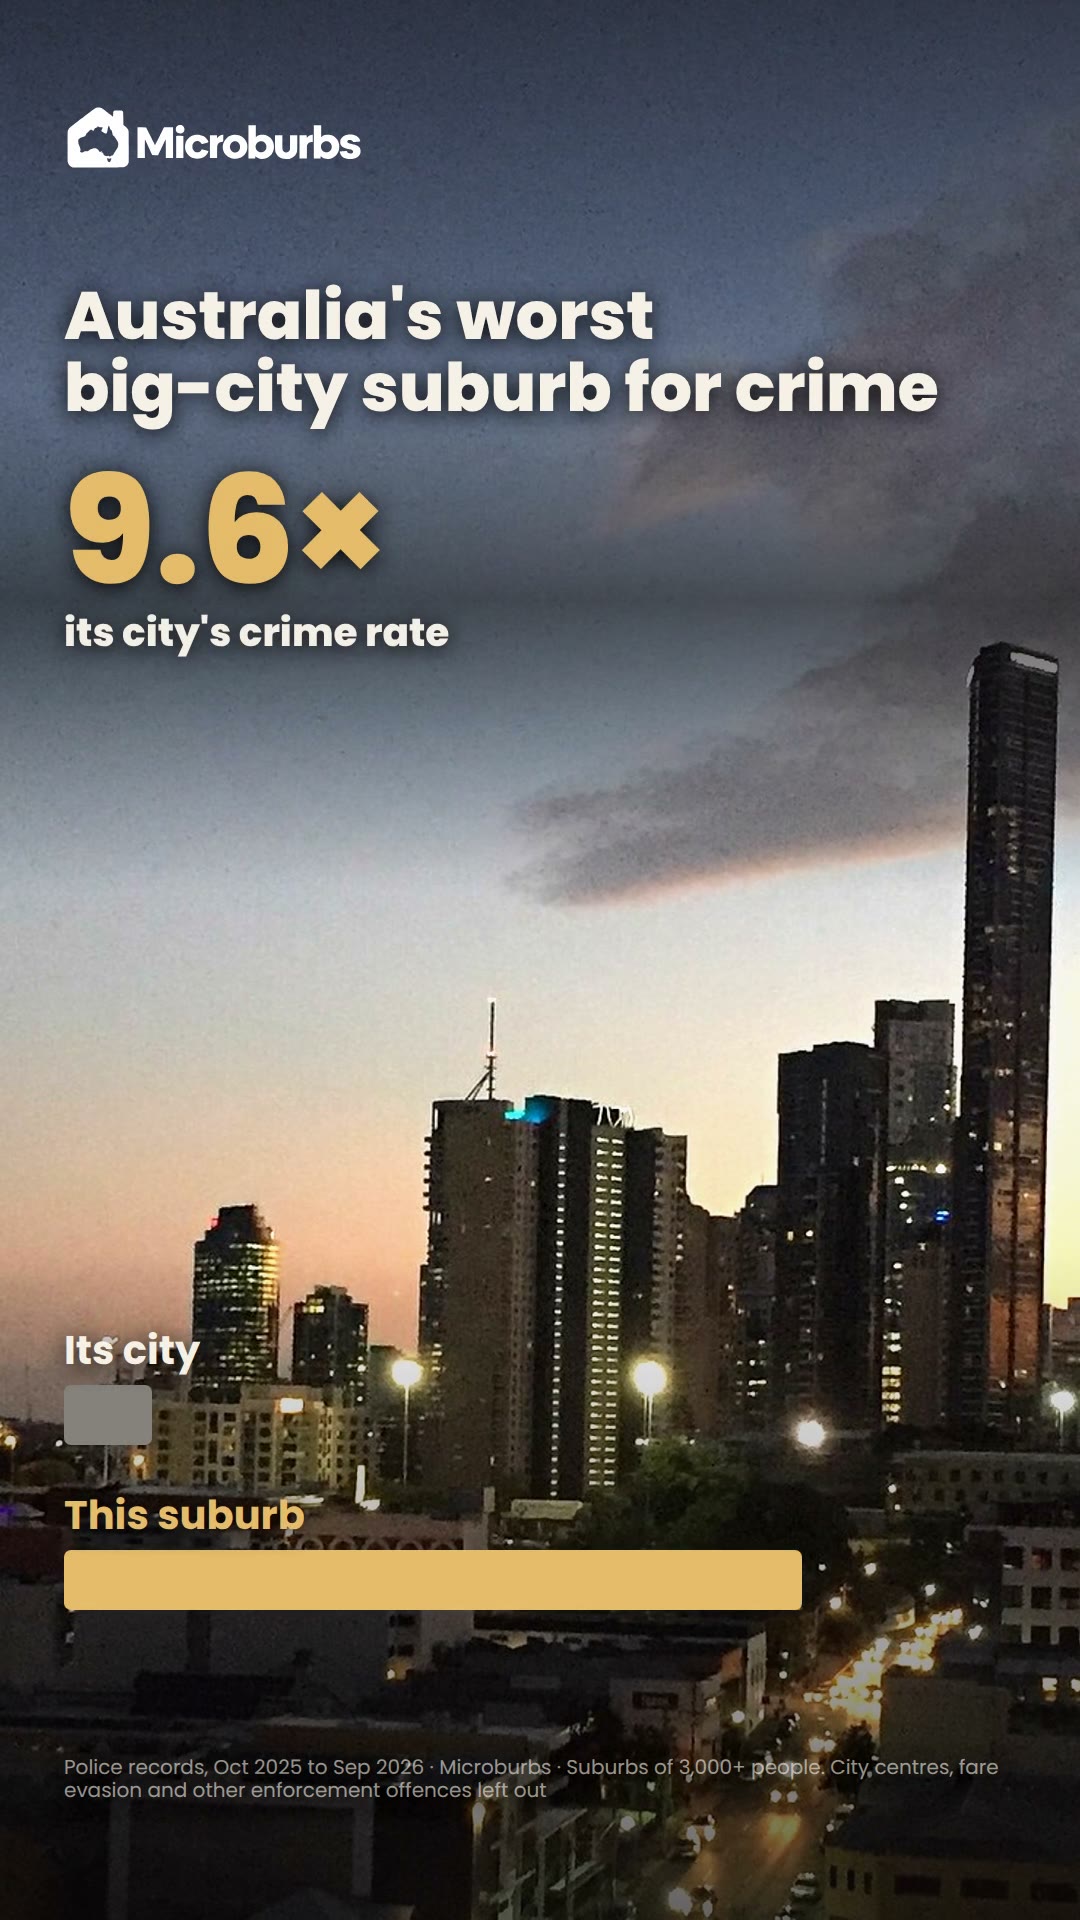 Highest crime suburbs in Australia: the top five against their own city
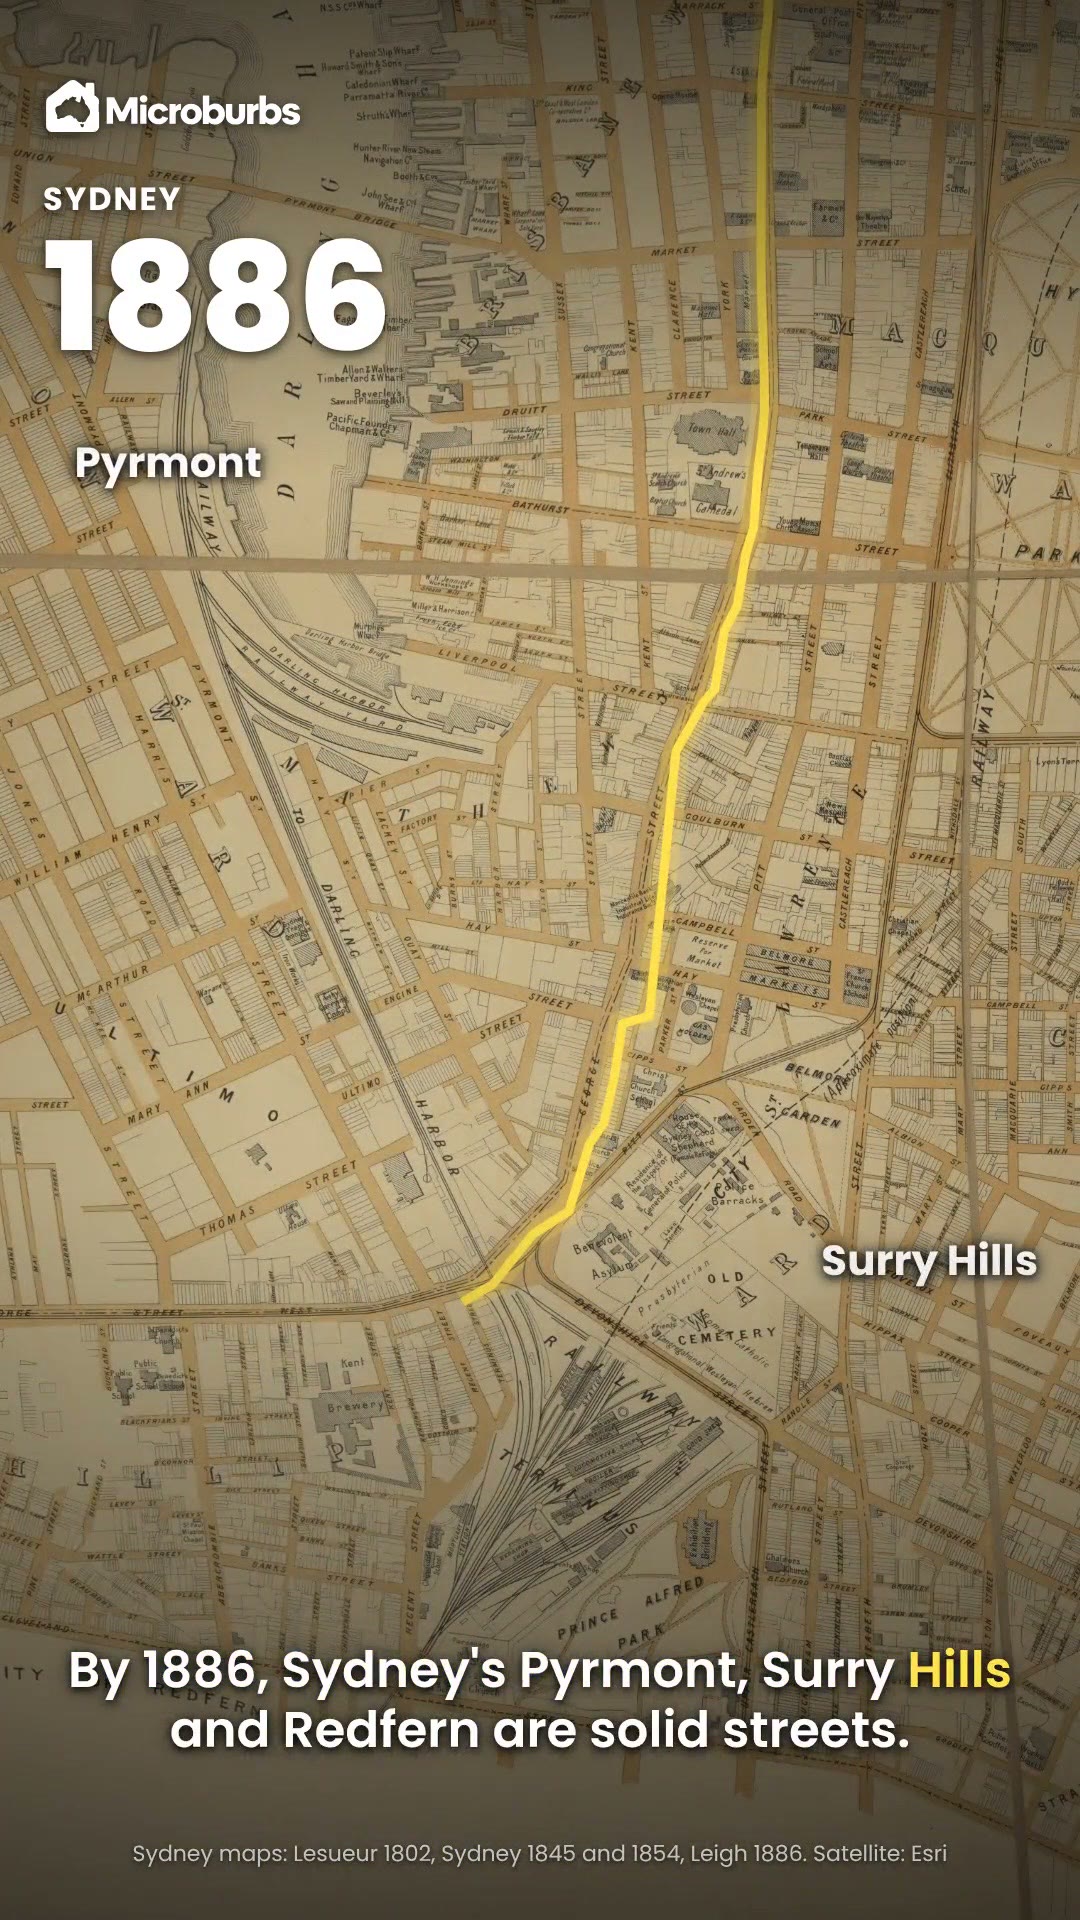 History of Sydney and Melbourne streets: the old maps, lined up on today's city