What we found
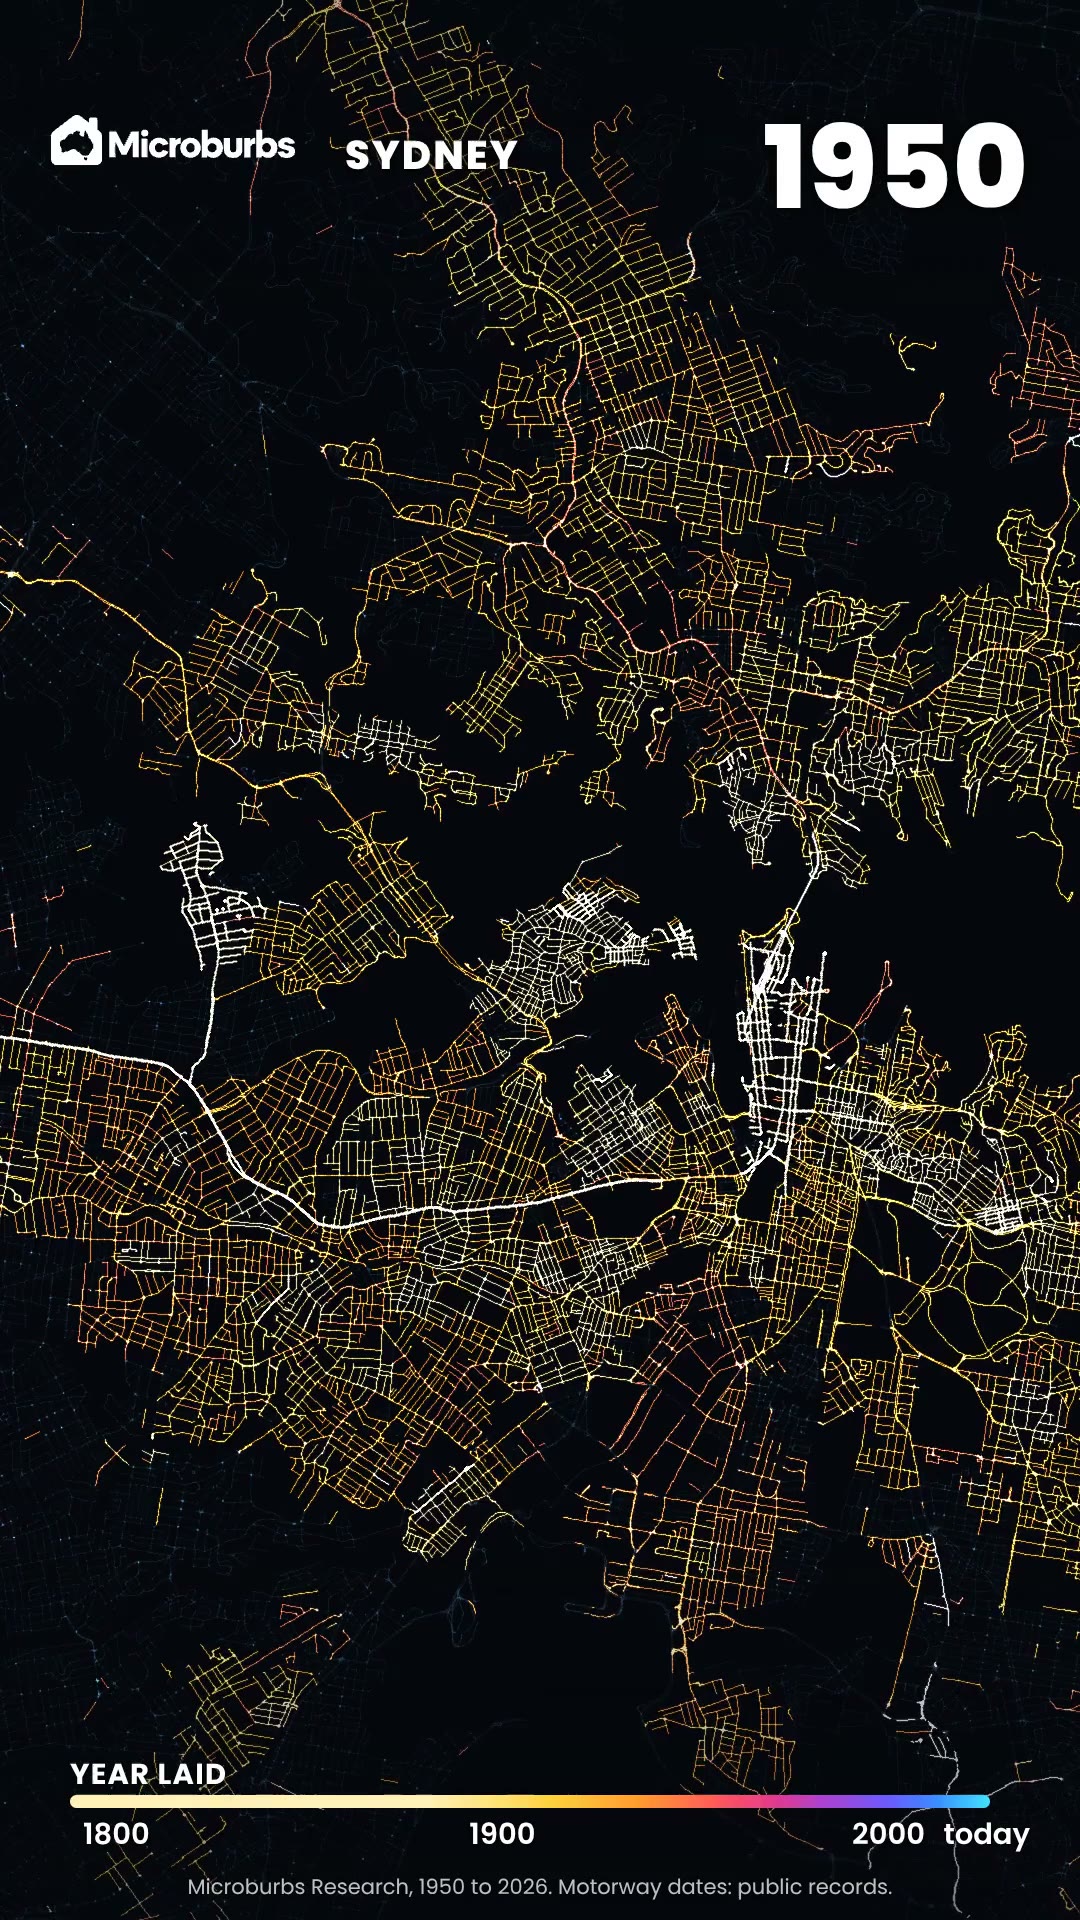
- George Street has not moved. Laid over today's city, the 1845 map puts George Street right where it is now.
- Sydney filled in fast. By 1886, Sydney's Pyrmont, Surry Hills and Redfern are solid streets.
- Melbourne's grid came first. In 1837 there was a river and about a dozen huts. Then surveyors drew the grid.
- A hill disappeared. Batman's Hill stood at the end of Collins Street. By 1876 it was cut down for the railway.
Our research: What the build year of a home tells you
The story: how was Sydney's street plan made?
Sydney grew from tracks, not from a plan. In 1788 the First Fleet camped beside a creek of fresh water. It was soon called the Tank Stream. A track ran from the camp along the stream to the brick pits. That track became George Street.
The oldest map in our reel is French. Charles-Alexandre Lesueur, of the Baudin expedition, drew Sydney in November 1802. It shows a small town wrapped around Sydney Cove. Governor Macquarie named George Street in 1810.
Laid over today's city, the 1845 map puts George Street right where it is now. It still bends where it bent in 1845.
Which parts of Sydney were built first?
The 1845 map is Francis Webb Sheilds' Map of the City of Sydney. Streets crowd the harbour end of town. Further south there are gaps between them.
By 1854, Woolcott and Clarke's map shows the gaps filling in. By 1886, Sydney's Pyrmont, Surry Hills and Redfern are solid streets. The lanes those maps drew are still the streets of the inner city today.
How was Melbourne's grid laid out?
Melbourne did it the other way round. Robert Russell's map of 1837 shows a river and about a dozen huts. They stood there before the town was founded.
Surveyors drew the grid before a single block was sold. Robert Hoddle's plan is dated 25 March 1837. The first land sale followed on 1 June 1837. The grid runs a mile long and half a mile wide, lined up with the Yarra.
How did Melbourne fill its grid?
The 1855 map comes just after the gold rush hit. The grid is packed. North of it, the blocks are marked out, and nearly empty.
By 1876, Bonney's map shows Melbourne's Carlton and Fitzroy filled in. Batman's Hill stood at the end of Collins Street. It was cut down from 1863 to 1865 for the Spencer Street railway yards. The 1876 map prints the railway terminus on the same spot.
The city still fills those same lines. In St Kilda, Melbourne, one home in ten was built in 1883 or earlier.
How we made this reel
- Seven real maps. Sydney in 1802, 1845, 1854 and 1886. Melbourne in 1837, 1855 and 1876.
- Each one lined up on today's streets. We pinned every map to corners that still exist, then laid it over a 2026 satellite photo.
- Then we let the years roll. Each city fills in where the maps show it really did.
What it means for you
- Old street lines mean old homes. In St Kilda, Melbourne, one home in ten was built in 1883 or earlier.
- Check the build year before you inspect. Every suburb report gives the typical build year, pocket by pocket.
Where to see it on Microburbs
- Build year, in every suburb report. Open Market and read the typical year the homes were built.
- Pocket by pocket. The report splits each suburb into small areas, each with its own build year.
Get the data
The old maps show which streets came first. The build year of the homes on them is live in our API, for any suburb in Australia.
Try it now, free. In St Kilda, Melbourne, the typical home was built in 1950. One in ten dates from 1883 or earlier, and one in ten from 2019 or later. That is across 20,197 homes. This request is free for our sample suburbs, one in each state and territory, with no sign up and no card.
curl "https://api.microburbs.com.au/v1/suburbs/St%20Kilda%20%28Vic.%29/market/built-year" \
  -H "Authorization: Bearer test"
What it sent back on 10 November 2026, cut to three of its 367 street blocks:
{
  "data": {
    "area_name": "St Kilda (Vic.)",
    "area_level": "suburb",
    "median_yr": 1950,
    "p10_yr": 1883,
    "p90_yr": 2019,
    "modal_era": "1920_1949",
    "n_props": 20197,
    "n_mbs": 367,
    "mbs": [
      {
        "mb": "20520220000",
        "median_yr": 1941.0,
        "p10_yr": 1937.0,
        "p90_yr": 1944.0,
        "modal_era": "1920_1949",
        "n_props": 37
      },
      {
        "mb": "20520230000",
        "median_yr": 1938.0,
        "p10_yr": 1935.0,
        "p90_yr": 1942.0,
        "modal_era": "1920_1949",
        "n_props": 30
      },
      {
        "mb": "20520240000",
        "median_yr": 1951.0,
        "p10_yr": 1948.0,
        "p90_yr": 1996.0,
        "modal_era": "1950_1979",
        "n_props": 36
      }
    ]
  }
}
See the full API docs for every request, the price of each and how to get a key for the rest of Australia.
See the build year for any suburb
Build year, in every suburb report. Open Market and read the typical year the homes were built.