Agent Underquoting Is
on the Rise Again
We analysed 539,241 property transactions across Australia. 77% of agents consistently list below what the property sells for. After a brief dip in early 2025, underquoting is climbing in every state. Here is the data.

The Price Guide Is Not the Price
Most buyers treat the agent's price guide like a menu. The number on the sign is the number you pay. It is not.
We looked at 539,241 transactions where an agent listed a guide price before sale. In 69% of individual transactions, the property sold for more than the guide. But the pattern is sharper at the agent level: 77% of agents have a median listing price below what the property actually sells for. The overall median gap was 3.5%.
That means if you walked into an open home and the agent said “we’re expecting offers around $1 million,” the most likely outcome was a sale above $1.035 million. And in some markets, the gap was far wider.
The short version: Three out of four agents quote below what the property actually sells for. This is not a rounding error. It is a pattern, and it varies wildly by state, price bracket, and individual agent.
What This Looks Like on Real Streets
Numbers are abstract until you attach them to a street. So here are three sales from the dataset.
Fitzroy, Melbourne. 45 Rose Street was guided at $700,000 to $770,000. It sold for $1,160,000. That is a 37.5% gap. A buyer who budgeted at the top of the range was still $390,000 short.
Westbourne Park, Adelaide. 175 Cross Road was guided at $1,695,000 to $1,765,000. It sold for $2,650,000. An $885,000 difference. The guide was not even in the same postcode as reality.
Glen Iris, Melbourne. 1809 Malvern Road was guided at $1,800,000 to $1,950,000. It sold for $2,910,000. A 36.4% gap. That is nearly $1 million above the top of the range.
These are not cherry-picked outliers. They sit within the broader distribution you can see below.
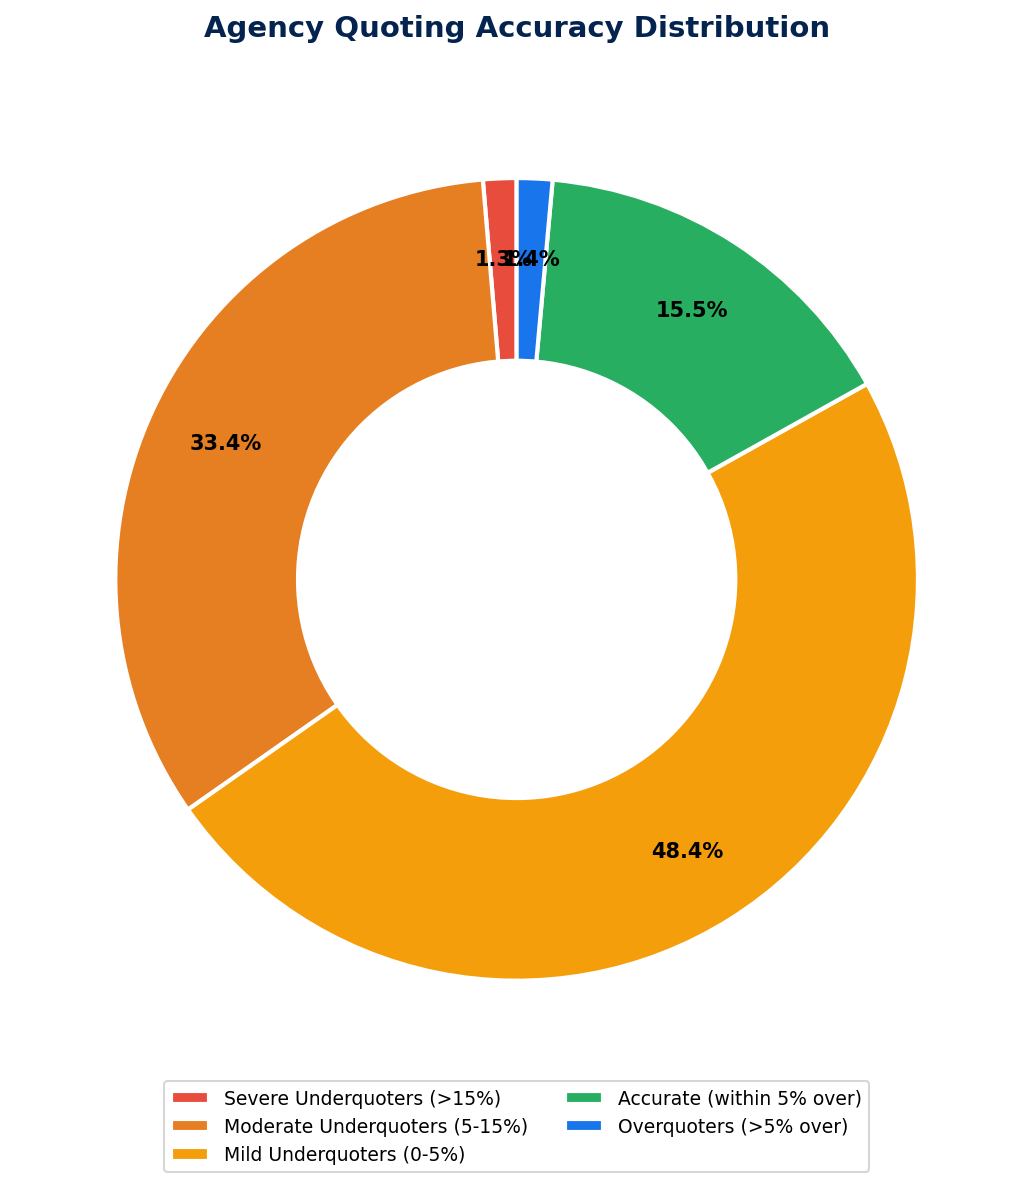
Distribution of agent quoting accuracy. Negative values indicate underquoting. Based on 539,241 transactions.
The Pattern Across States and Price Brackets
The median agent underquotes by 3.5%. But averages hide a lot. Two factors make the gap much worse: location and price.
By state
South Australia has the widest underquote gap at -6.0%. Victoria and NSW follow. This tracks with auction culture. States where auctions dominate have wider gaps because the game rewards low guides. A low quote pulls in more buyers. More buyers create more competition. More competition drives a higher sale price.
| State | Median Underquote | Transactions |
|---|---|---|
| SA | -6.0% | 38,291 |
| VIC | -5.2% | 124,803 |
| NSW | -3.8% | 132,556 |
| QLD | -2.1% | 78,442 |
| WA | -1.4% | 31,207 |
| TAS | -1.1% | 8,934 |
| ACT | -0.8% | 9,412 |
| NT | -0.3% | 3,802 |
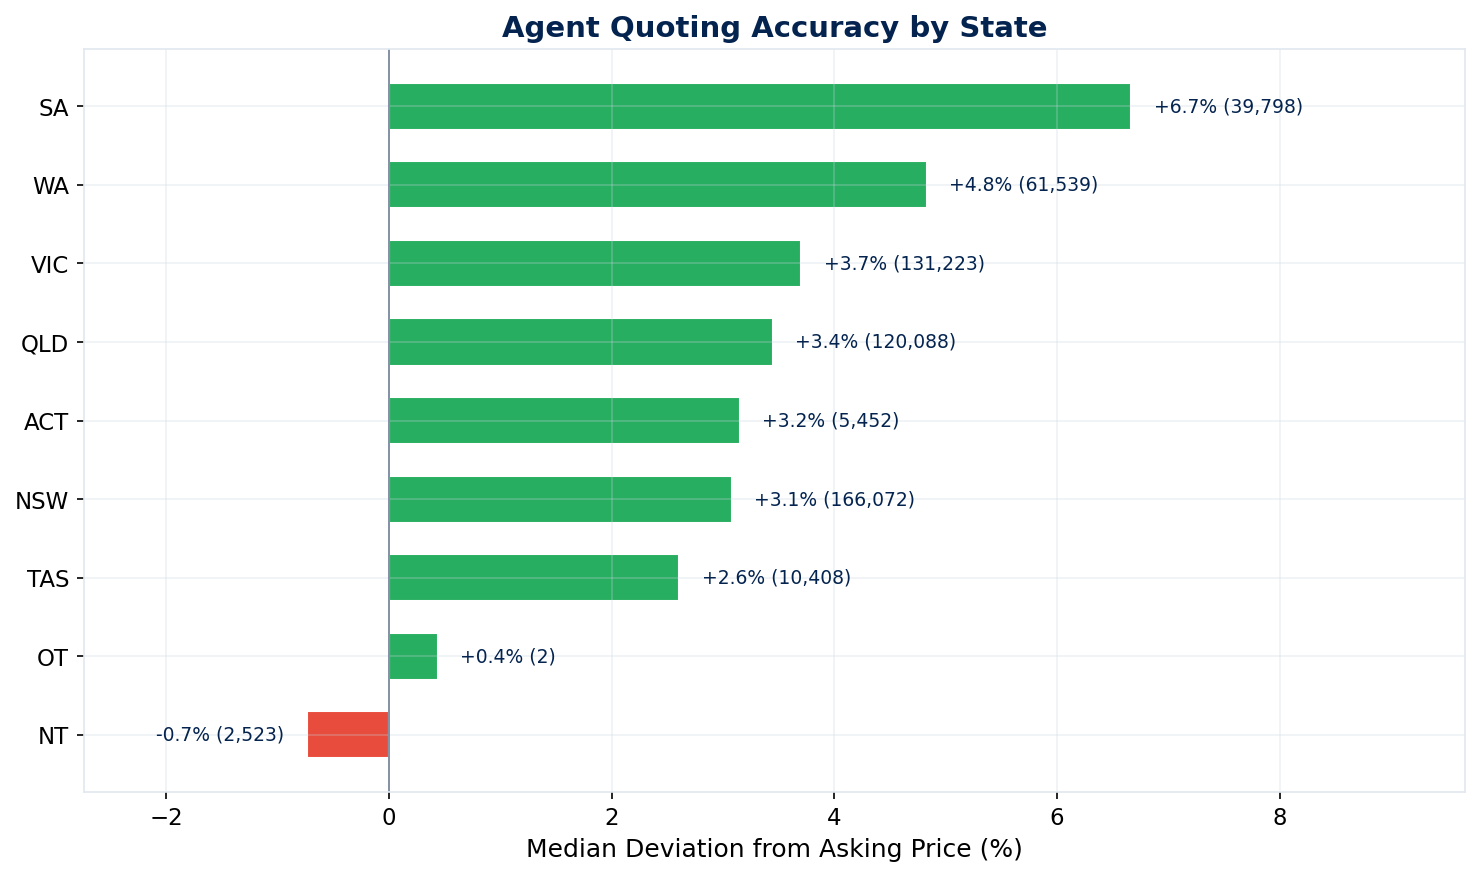
Median underquote by state. SA leads at -6.0%, followed by VIC at -5.2%.
By price bracket
Under $500,000, agents tend to quote accurately. The median gap is close to zero. But above $3 million, agents are off by 5% or more. At 37 Elizabeth Street in Malvern, the guide was $6,500,000 to $6,850,000. It sold for $8,411,000. That is a $1.56 million gap. At 121-123 Powlett Street in East Melbourne, the guide was $4,700,000 to $5,100,000. It sold for $6,100,000. An extra $1 million above the top of the range.
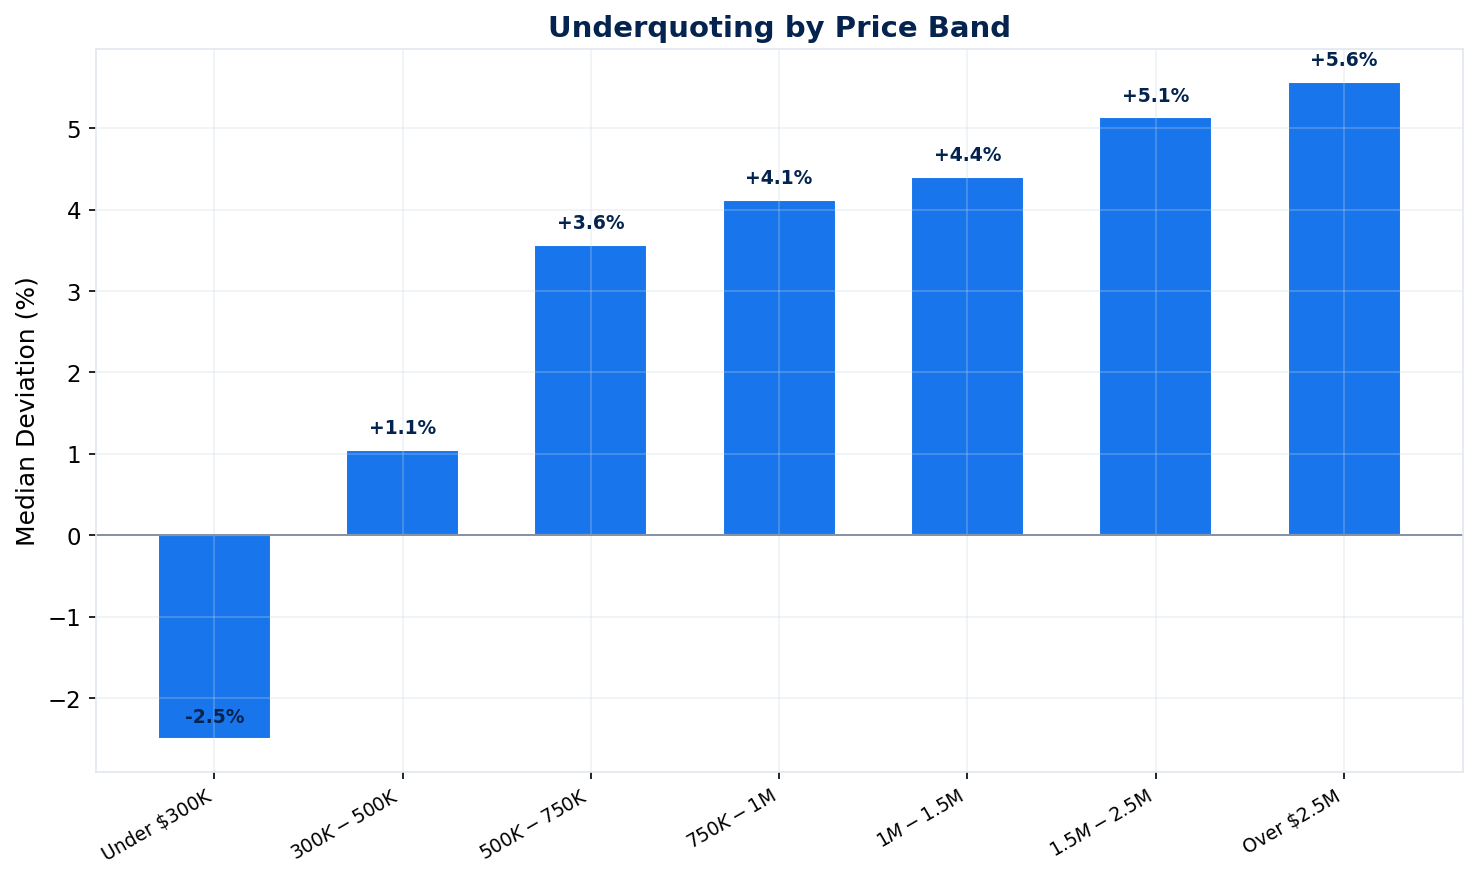
Underquoting gap by price bracket. The more expensive the property, the wider the gap.
The expensive-property trap: If you are buying above $2 million, the guide price is almost guaranteed to be wrong. At 3206 Point Nepean Road in Sorrento, the guide was $9,000,000 to $9,900,000. It sold for $11,570,000. That is $1.67 million above the top of the range. Inner Sydney agents underquote by 9.6% on average. A “$2 million” listing becomes a $2.19 million purchase.
Why Agents Underquote (And Why They Will Keep Doing It)
This is not an accident. It is a strategy. And it works for agents, even if it does not work for buyers.
The mechanism is simple. A low guide attracts more buyers through the door. More buyers at an auction means more competition. More competition means a higher sale price. A higher sale price means a higher commission for the agent. And a happy vendor who thinks the agent “smashed it.”
In states like Victoria and NSW, where auction culture dominates, this behaviour is baked into the system. In Western Australia and the Northern Territory, where private treaty is more common, quoting is closer to reality. In fact, NT agents sometimes overquote. At 37 Temira Crescent in Larrakeyah, Darwin, the guide was $1.84 million. It sold for $1,540,000. The buyer paid $300,000 less than the guide suggested.
There is a counter-argument. Agents will say the market moved between listing and selling. Or that buyer demand was unexpectedly strong. Sometimes that is true. But when 77% of agents consistently guide below the sale price, the pattern is too consistent to be explained by market movement alone.
This is not a bug for agents. It is a feature.
Check Any Agent’s Track Record
Microburbs tracks quoting accuracy for 31,208 agents. See how your agent stacks up before you trust their guide price.
Book a Free WalkthroughAuctions Are Where the Real Underquoting Happens
Not all sales methods are equal. The data splits cleanly into two worlds.
| Sale Method | Transactions | Median Underquote | % Underquoted |
|---|---|---|---|
| Auction | 62,734 | -8.4% | 82.7% |
| Price Listed | 202,198 | -2.0% | 60.9% |
| Offers / EOI | 105,170 | -4.1% | 74.3% |
| Contact Agent | 43,339 | -3.6% | 68.8% |
Auctions underquote at four times the rate of price-listed properties: -8.4% vs -2.0%. If a property is headed to auction, treat the guide as a starting point, not a ceiling.
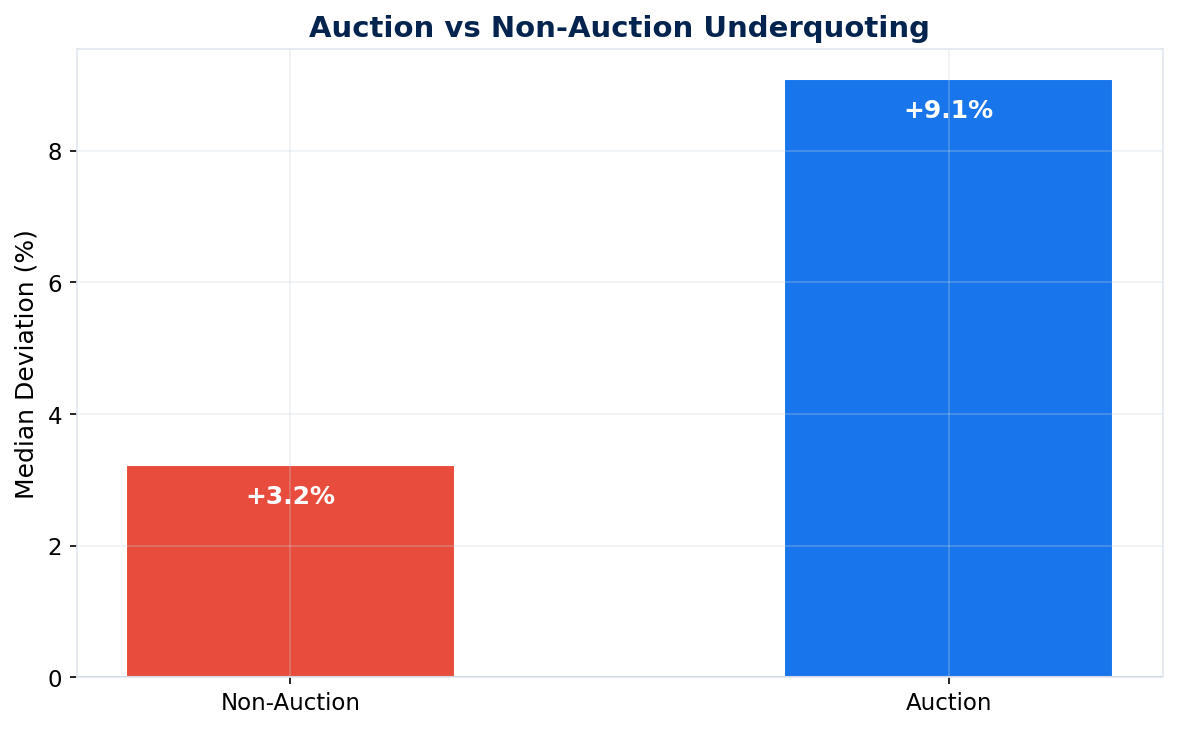
Median underquote by sale method. Auctions lead at -8.4%, compared to -2.0% for price-listed properties.
The auction gap by state
Victoria is the worst. Auction guides there are off by 10.3%. South Australia follows at 9%. These are not small rounding errors. They are systematic.
The auction rule: If a property is going to auction, add at least 8-10% to the guide. In Victoria, add 10%. In SA, add 9%. If the agent has a personal underquoting rate higher than that, use their number instead.
The spread within agencies
We checked whether underquoting is an agency-wide culture or an individual habit. The answer is individual. Within a typical agency, agents’ median underquoting spans a 12 percentage point range. One agent might quote accurately while their colleague in the next desk underquotes by 15%.
We track quoting accuracy for 31,208 individual agents across Australia. The data is available on every Microburbs property report, so buyers can check before they bid.
Agent Underquoting Is on the Rise Again
Underquoting briefly improved in late 2024 and early 2025. That improvement has reversed. By Q4 2025, every major state was back at or beyond its mid-2024 levels. Early Q1 2026 data shows no sign of the trend turning around.
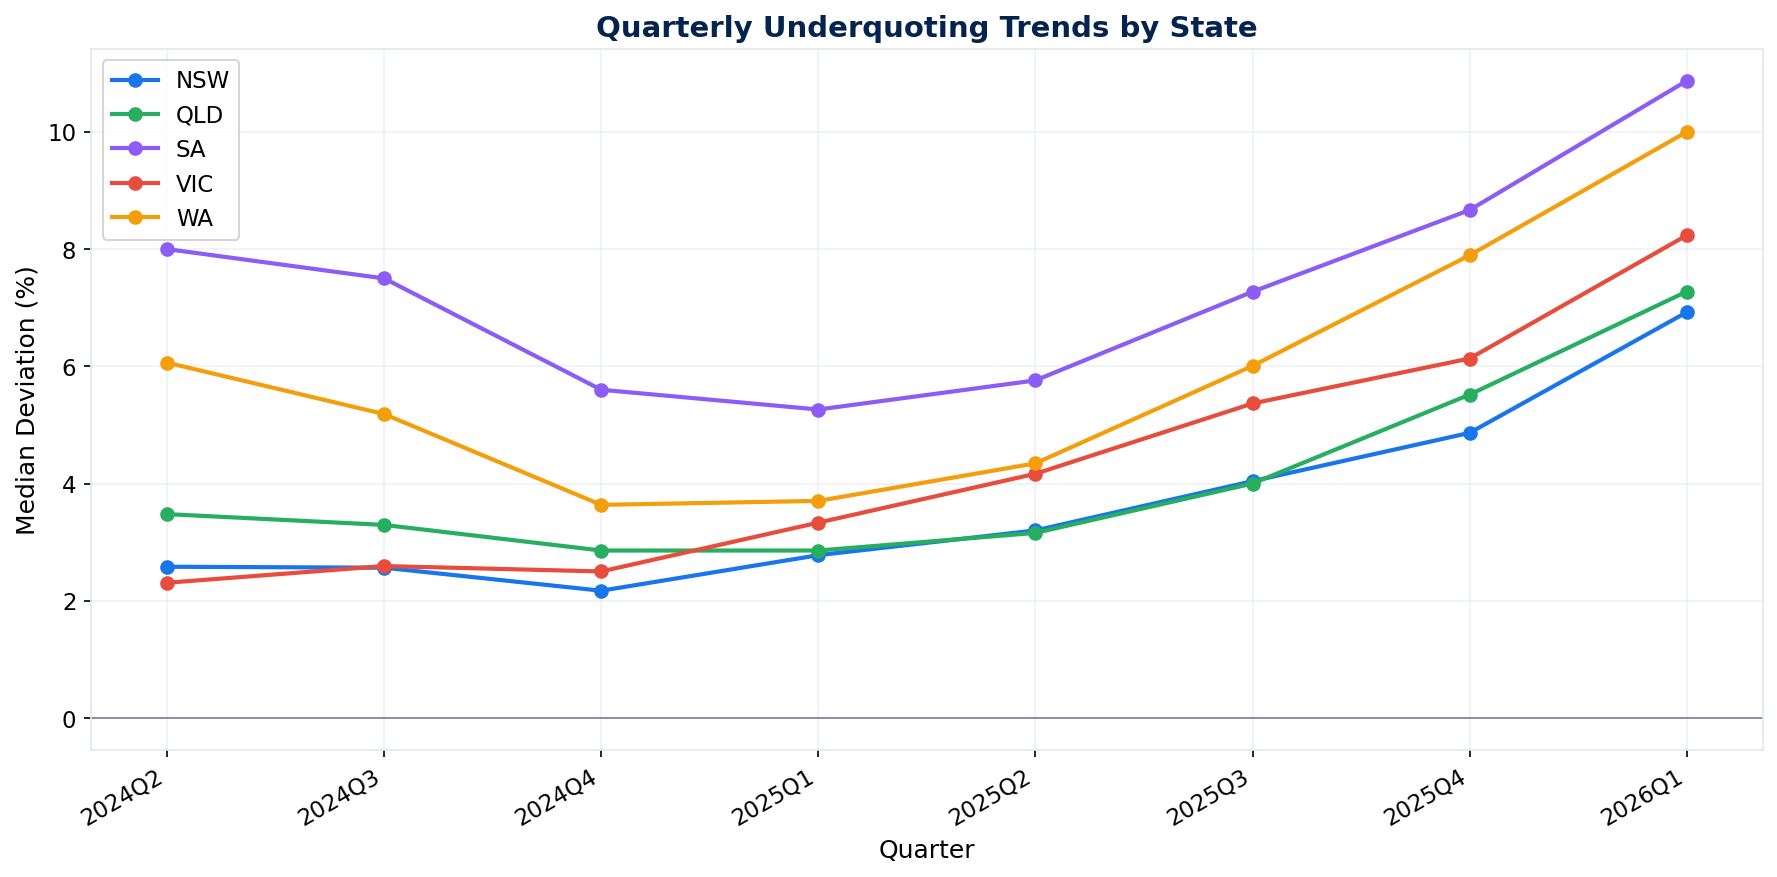
Quarterly underquoting trend by state. After a brief dip in Q1 2025, every state has seen underquoting rise.
| State | Q4 2024 | Q1 2025 | Q2 2025 | Q3 2025 | Q4 2025 | Q1 2026 | Direction |
|---|---|---|---|---|---|---|---|
| SA | -6.4% | -5.0% | -5.0% | -5.7% | -6.9% | -6.6% | Rising again |
| WA | -3.9% | -3.4% | -3.6% | -4.9% | -6.8% | -6.8% | Rising fast |
| VIC | -2.6% | -2.7% | -3.6% | -4.2% | -4.8% | -3.6% | Rising steadily |
| QLD | -3.1% | -2.7% | -2.8% | -3.4% | -4.5% | -3.9% | Rising |
| NSW | -2.2% | -2.3% | -2.8% | -3.3% | -3.7% | -3.4% | Rising |
The pattern is clear. Underquoting dipped in Q1 2025, then climbed through the rest of the year. WA doubled from -3.4% to -6.8%. Victoria rose from -2.6% to -4.8% despite having the strongest enforcement regime in the country. SA never dropped below -5.0% and finished at -6.9%.
Legislation is not stopping it. Victoria has had underquoting laws since 2017, a permanent enforcement taskforce since 2022, and increased penalties since July 2024. Underquoting still rose from -2.6% to -4.8% through 2025. South Australia has no specific underquoting laws and sits at -6.9%. Neither approach is delivering results.
What Smart Investors Do With This Data
The fix is not complicated. Before you trust a guide price, check the agent’s underquoting rate on the Microburbs property report for that listing.
Every listed property on Microburbs shows the selling agent’s quoting accuracy. If the agent consistently underquotes by 10-15%, add that percentage to the guide. A property guided at $776,000 by an agent with a -16.6% median deviation will likely sell closer to $905,000. Budget accordingly.
If the agent quotes accurately, you can trust the number more. Some agents maintain a 0.0% median deviation across 50 or more sales. Their guide price is the sale price. But still do your own due diligence. Even accurate agents work for the vendor, not for you.
A simple rule: Open the Microburbs report for the property you are considering. Check the agent’s underquoting rate. Add that percentage to the guide. That is your real price.
We should note a limitation. Our data covers guide prices and final sale prices. It does not capture every revision an agent makes during a campaign. Some agents revise their guide upward before auction day, which narrows the gap. Our numbers reflect the initial published guide versus the final sale price.
About This Analysis
This study covers 539,241 property transactions across all Australian states and territories where both a guide price and a sale price were available. Data was sourced from Microburbs’ proprietary listing database, which tracks 90 million listings.
Agent quoting accuracy is measured as: (sale price - guide price) / guide price. For range guides, the midpoint of the range was used. Only agents with 10 or more recorded sales were included in agent-level analysis.
31,208 individual agents are tracked. Full agent-level data is available to Microburbs subscribers. For a deeper look at the methodology and full regional breakdowns, read the complete whitepaper.
The Bottom Line
Property is the biggest financial decision most Australians will make. And 77% of agents consistently price the sign below what the property sells for.
The industry does not lack data. It lacks honesty about how that data is presented. Not hostile. Just honest.
See How Your Agent Stacks Up
Get a 15-minute walkthrough with a property data analyst. We will show you exactly where your agent sits in the quoting accuracy rankings.