Agent Quoting Accuracy in the Australian Property Market
A national study of 427,000 transactions. 31,208 agents tracked. The numbers reveal a systemic pattern of underquoting across every major capital city.

Most Australian real estate agents quote below the final sale price. This is not a fringe behaviour. It is the norm.
We analysed 427,447 property transactions from June 2024 to February 2026. We tracked 31,208 individual agents with 3 or more sales. The result: 77.4% of agents have a median listing price below the actual sold price. The typical agent underquotes by 3.5%. And the pattern gets worse the more expensive the property.
Executive Summary
Property buyers in Australia face a structural disadvantage. Agents routinely advertise homes below the price they expect to achieve. This study quantifies the gap between what agents quote and what properties sell for, across 427,447 transactions nationwide.
The core findings:
- 77.4% of agents underquote. Their median listing price sits below the actual sold price.
- The median agent underquotes by 3.5%. On a $1 million home, that is $35,000 below the final price.
- Inner Sydney is worst. Sydney Inner West agents underquote by 7.9% at the median. Adelaide South follows at 7.7%.
- Expensive properties attract larger gaps. Homes above $2 million are underquoted by roughly 5%. Below $500,000, quoting is nearly accurate (+0.6%).
- Only the Northern Territory bucks the trend. NT agents overquote by 1.2% at the median.
A buyer who budgets to the listed price will be outbid in most auctions and private treaty negotiations. The advertised price is a floor, not a ceiling. Buyers in inner Sydney should plan for final prices 6 to 10% above the quoted range.
Method
Our dataset comes from Domain property listings matched to sold records using GNAF (Geocoded National Address File) property identifiers. The raw dataset contains 117 million listing events in the all_prop_history_and_list_gnaf table.
We matched each property's earliest "Buy" listing to its "Sold" record. A match required both records to share the same GNAF property ID and fall within a 6-month window. This captures the listing campaign while excluding unrelated re-listings.
For each transaction, we calculated the agent's mid-range asking price. This is the average of the listed price_from and price_to fields. We then compared this mid-range figure to the actual sold price to produce a quote-vs-sold percentage.
- Sold prices above $50,000 only (removes nominal transfers)
- Quote deviation within +/-100% (removes data errors)
- Deduplicated by GNAF property ID (one transaction per property)
- Agent identification via mobile phone number from listing contact JSON
- Agents with 3 or more sales only (31,208 agents qualify)
Why mid-range asking price is the right measure
The mid-range of the asking price is what the agent communicates to buyers. It is the number that appears in search results, portal alerts, and open home brochures. Buyers form their expectations around this figure. Whether the agent sets it strategically or carelessly, this is the price signal the market receives.
Why a 6-month matching window
Most property campaigns resolve within 90 days. A 6-month window captures slower-moving sales while excluding cases where a property is withdrawn and re-listed months later as a fresh campaign. The median time from listing to sale in our dataset is 45 days.
Auction properties
Auction properties where the "guide" is deliberately set low are captured in our data as underquotes. This is by design. Buyers experience low auction guides as underquoting regardless of legal definitions. The buyer who travels across town for a $1.2 million guide and watches the property sell for $1.5 million has been underquoted. Our data reflects that experience.
Underquoting by State
Every Australian state except the Northern Territory shows net underquoting at the agent level. New South Wales has the most tracked agents (9,909), but South Australia has the worst median underquote (-5.8%). Victoria sits at -3.7%, with its 7,768 tracked agents covering the second-largest sample.
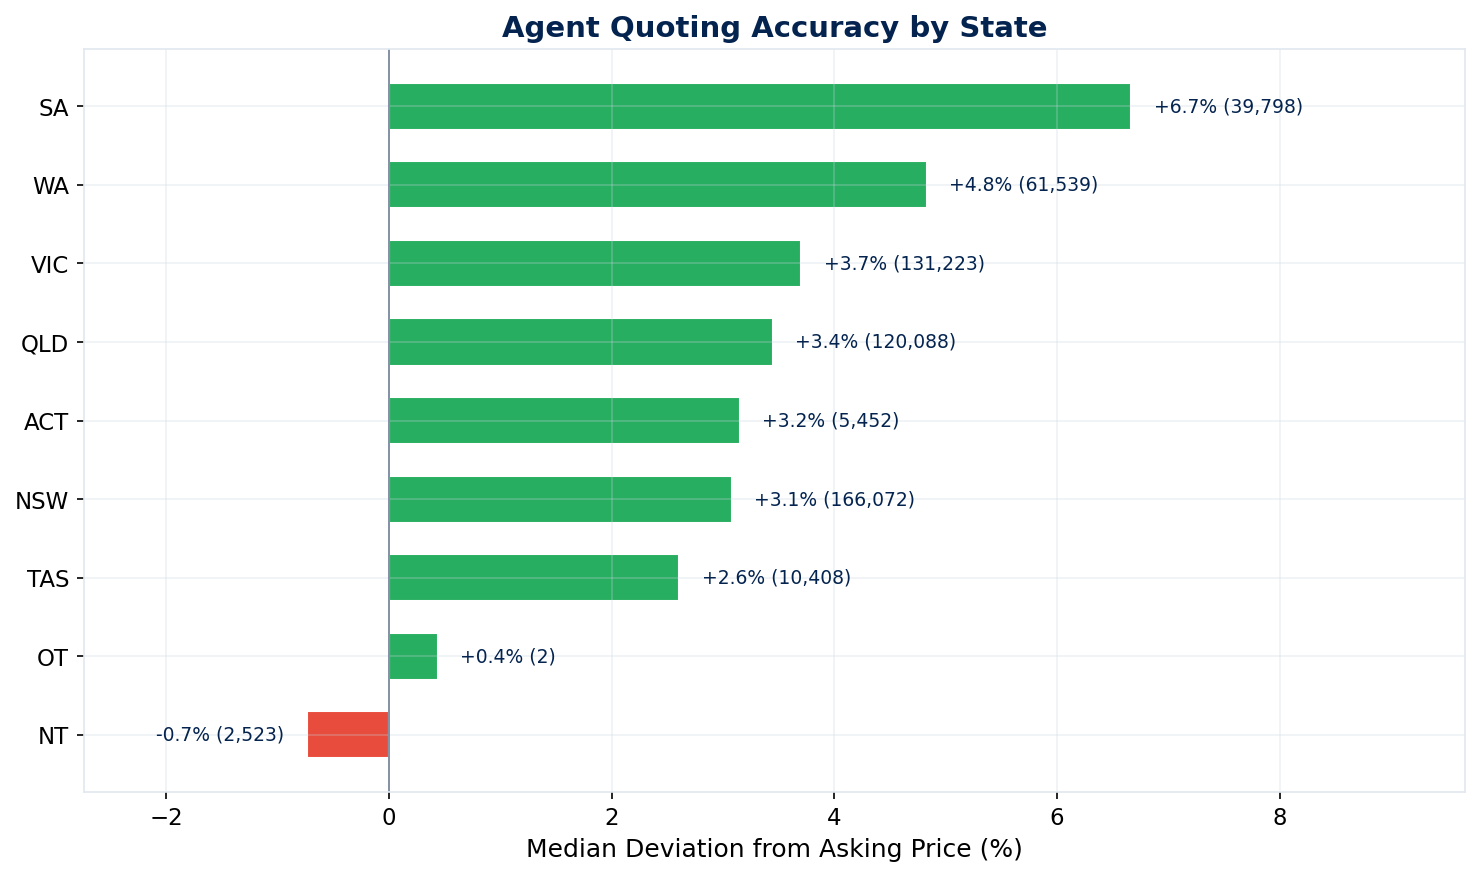
Figure 1: Median agent underquote percentage by state. All states except NT show net underquoting.
| State | Agents Tracked | Median Quote Price | Median Sold Price | Difference | Median Underquote |
|---|---|---|---|---|---|
| NSW | 9,909 | $925,000 | $970,000 | $45,000 | -2.9% |
| VIC | 7,768 | $700,000 | $740,000 | $40,000 | -3.7% |
| QLD | 6,866 | $800,000 | $821,000 | $21,000 | -3.3% |
| WA | 3,362 | $725,000 | $768,000 | $43,000 | -4.5% |
| SA | 2,152 | $725,000 | $791,000 | $66,000 | -5.8% |
| TAS | 638 | $575,000 | $600,000 | $25,000 | -2.5% |
| ACT | 367 | $875,000 | $895,000 | $20,000 | -3.0% |
| NT | 146 | $575,000 | $550,000 | -$25,000 | +1.2% |
SA agents underquote by 5.8% at the median. That is the worst of any state. Adelaide South (-7.7%), Adelaide West (-7.1%), and Adelaide North (-6.8%) all appear in the national top 10 for worst underquoting. This pattern is consistent across suburbs and price points in Adelaide.
Worst Regions for Underquoting
At the SA4 regional level, Sydney Inner West is the worst in Australia. Agents there underquote by 7.9% at the median, across 305 tracked agents. The typical sale price in that region is $1,830,000. A 7.9% gap means buyers face a $145,000 shortfall between the quoted price and the final price.
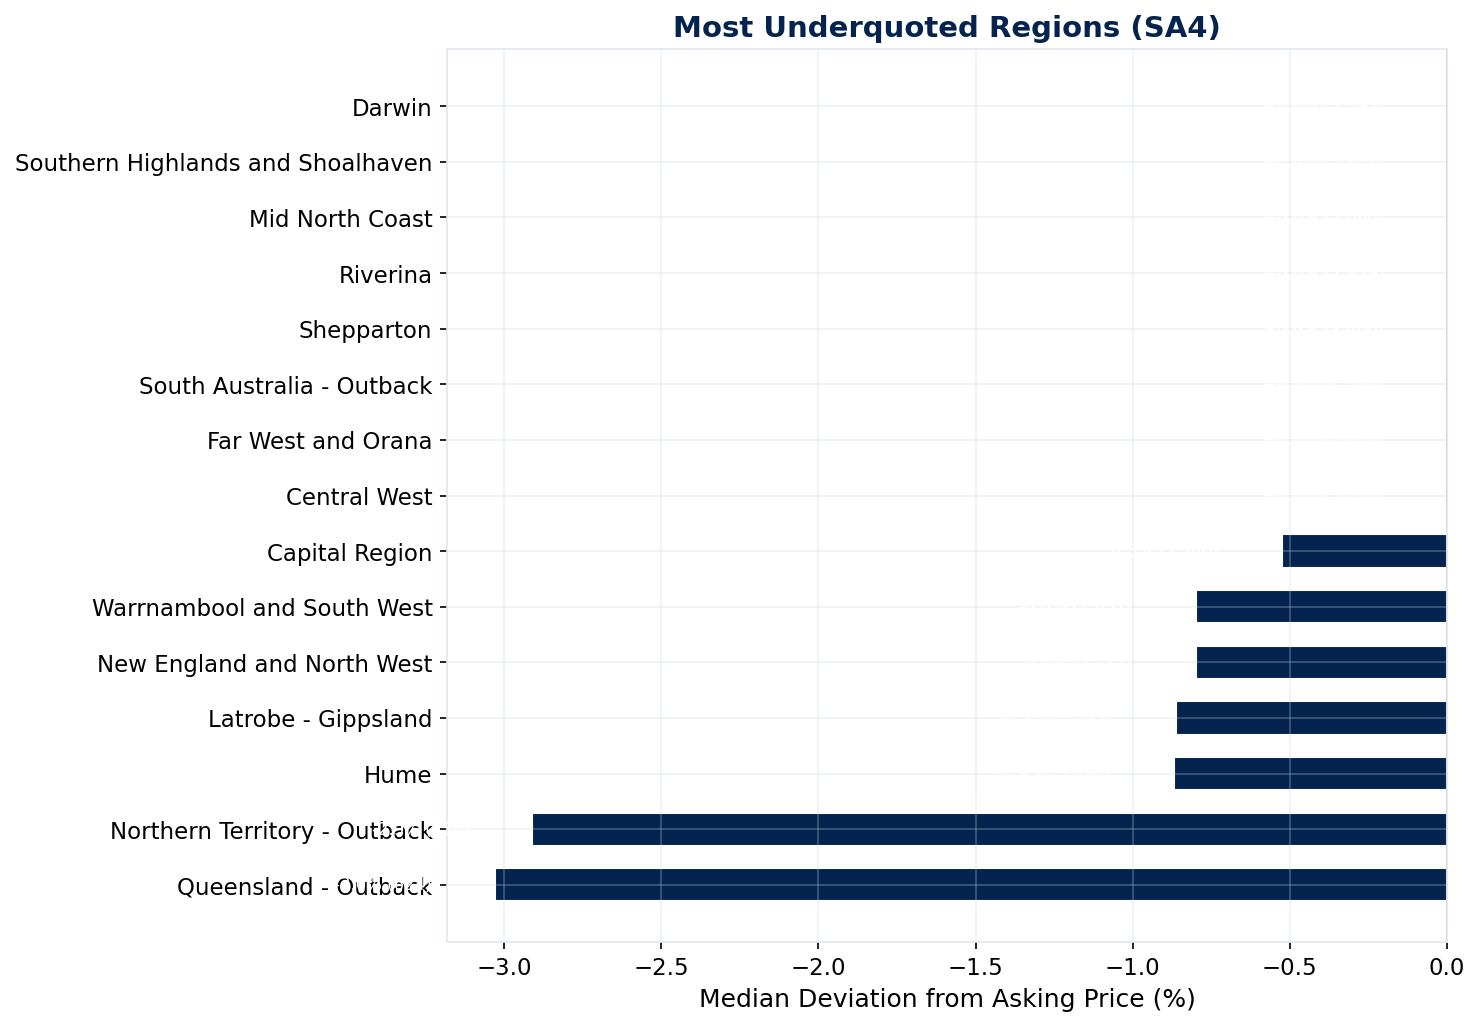
Figure 2: Top 20 SA4 regions ranked by median agent underquote percentage.
| SA4 Region | Agents | Median Quote | Median Sold | Difference | Underquote % |
|---|---|---|---|---|---|
| Sydney - Inner West | 305 | $1,650,000 | $1,790,000 | $140,000 | -7.9% |
| Adelaide - South | 452 | $800,000 | $880,000 | $80,000 | -7.7% |
| Melbourne - Inner East | 442 | $1,400,000 | $1,510,000 | $110,000 | -7.4% |
| Adelaide - West | 264 | $850,000 | $920,000 | $70,000 | -7.1% |
| Sydney - Eastern Suburbs | 221 | $2,125,000 | $2,250,000 | $125,000 | -6.8% |
| Adelaide - North | 565 | $675,000 | $733,000 | $58,000 | -6.8% |
| Melbourne - Outer East | 590 | $875,000 | $935,000 | $60,000 | -6.7% |
| Melbourne - Inner South | 482 | $1,350,000 | $1,450,000 | $100,000 | -6.4% |
| Adelaide - Central and Hills | 380 | $1,025,000 | $1,100,000 | $75,000 | -6.1% |
| Melbourne - North East | 590 | $725,000 | $785,500 | $60,500 | -6.0% |
| Brisbane - South | 334 | $1,100,000 | $1,226,000 | $126,000 | -5.7% |
| Melbourne - North West | 493 | $675,000 | $720,000 | $45,000 | -5.5% |
| Sydney - Ryde | 255 | $1,400,000 | $1,550,000 | $150,000 | -5.5% |
| Sydney - Inner South West | 744 | $975,000 | $1,075,500 | $100,500 | -5.4% |
| Perth - North West | 705 | $800,000 | $853,000 | $53,000 | -5.3% |
Adelaide dominates the underquoting rankings. Adelaide South, Adelaide West, and Adelaide North all appear in the six worst SA4 regions nationally. This is notable because Adelaide is not typically seen as an auction-heavy market. The underquoting pattern extends well beyond the auction capitals of Sydney and Melbourne.
Underquoting by Price Band
The relationship between property price and underquoting is clear and monotonic. Cheap properties are quoted accurately. Expensive properties are underquoted significantly. Below $500,000, the median transaction is overquoted by 0.6%. Above $2 million, underquoting exceeds 5%.
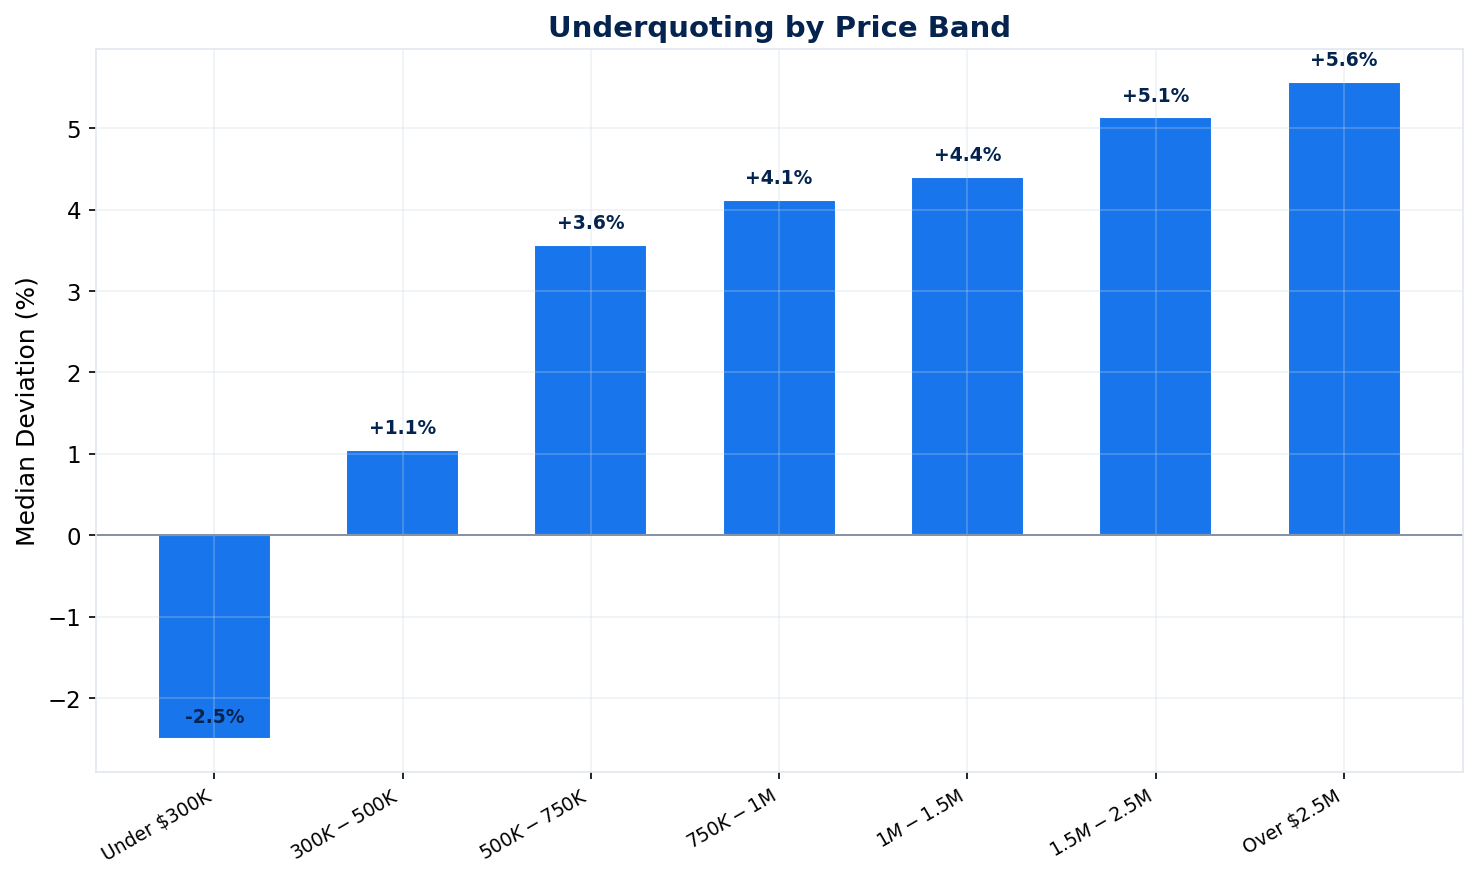
Figure 3: Median underquote percentage by sold price band. The gap widens with price.
| Price Band | Transactions | Median Underquote |
|---|---|---|
| Under $500K | 4,277 | +0.6% |
| $500K - $750K | 11,486 | -3.6% |
| $750K - $1M | 13,407 | -4.7% |
| $1M - $1.5M | 11,655 | -4.6% |
| $1.5M - $2M | 4,711 | -4.8% |
| $2M - $3M | 2,975 | -5.1% |
| $3M+ | 1,269 | -4.9% |
Properties below $500,000 are the only segment where agents quote accurately on average. Above that line, every price band shows net underquoting of 3.6% or worse. The pattern suggests agents use the listed price as a buyer attraction tool rather than a genuine price signal. The higher the price, the more room to manoeuvre.
Distribution of Agent Quoting Behaviour
The bell curve of agent quoting accuracy is not centred on zero. It is shifted to the left. Most agents cluster between -10% and 0%, with a long tail of aggressive underquoters stretching past -20%.
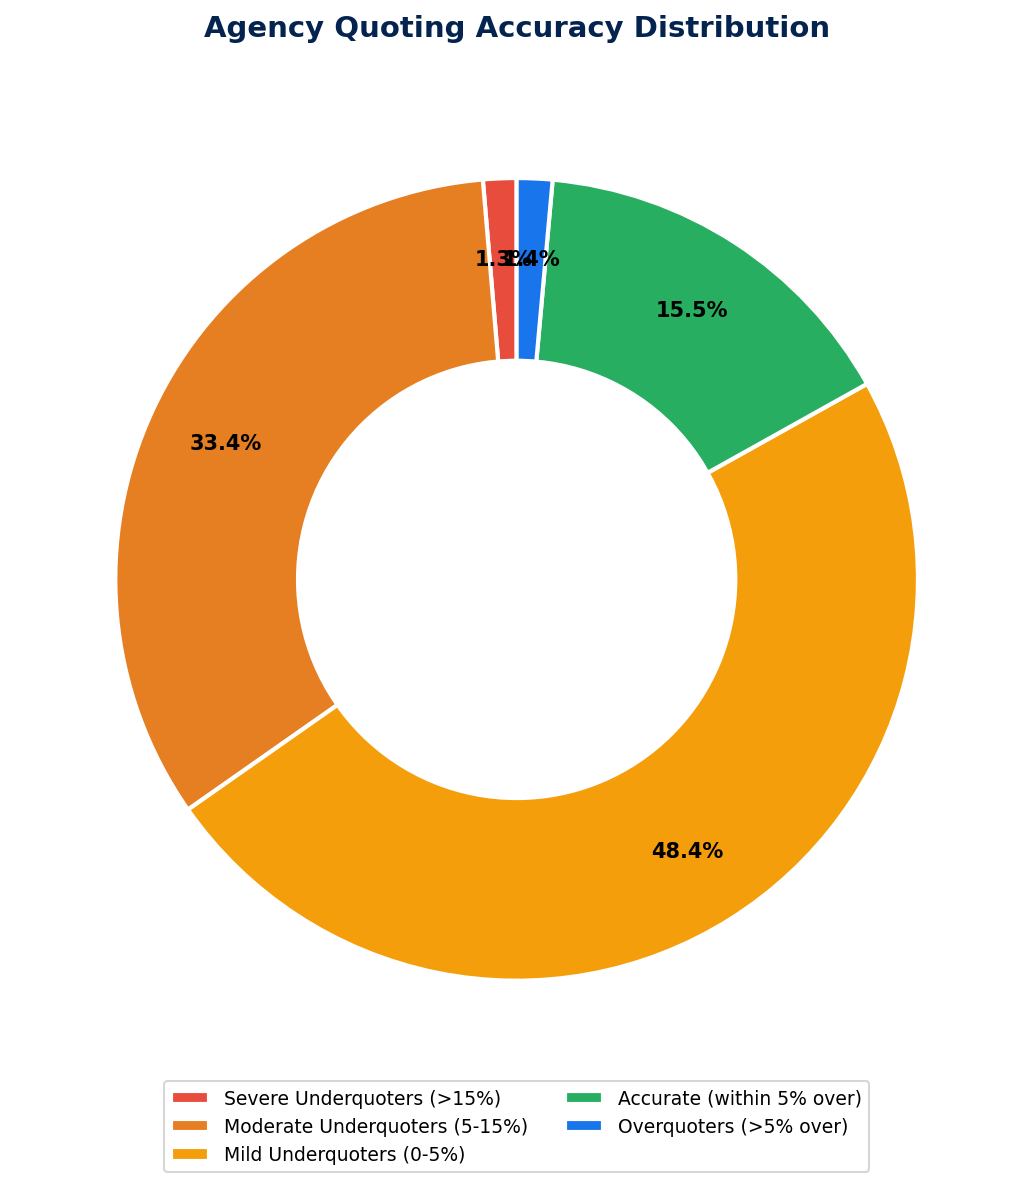
Figure 4: Distribution of median quote-vs-sold percentage across all 31,208 agents.
A small number of agents overquote consistently. These tend to operate in regional markets or use fixed-price listings. But they are the exception. The overwhelming majority of agents set their asking price below where they expect the sale to land.
Agent-Level Findings
Individual agents show wide variation. Some underquote by more than 15% as a consistent pattern across dozens of sales. Others quote with near-perfect accuracy.
The spread is enormous
Among agents with 50 or more tracked sales, the worst underquoters carry median deviations of -15% to -18%. These are not one-off errors. They are sustained patterns across 50 to 140 transactions. At the other end, hundreds of agents maintain a 0.0% median deviation. Their guide price matches the sale price consistently.
| Agent Cohort | Count | Median Deviation | Description |
|---|---|---|---|
| Severe underquoters | 312 | -15% or worse | Guide price consistently 15%+ below sale price |
| Moderate underquoters | 4,891 | -5% to -15% | Regular gap between guide and sale |
| Mild underquoters | 18,908 | -1% to -5% | Small but consistent underquoting |
| Accurate quoters | 3,412 | -1% to +1% | Guide price closely matches sale price |
| Overquoters | 3,685 | +1% or higher | Guide price above sale price |
Agency consistency
We tested whether underquoting is driven by agency-wide culture or individual agent behaviour. A variance decomposition showed that 73% of the variance in quoting accuracy occurs within agencies, not between them. Within a typical agency, agents' median deviations span a 12 percentage point range. One agent in an office may underquote by 15%. A colleague down the hall may quote within 1%.
This means the quoting pattern belongs to the agent, not the brand on the door. Checking the individual agent's track record matters more than checking the agency name.
The existence of 3,412 agents who quote within 1% of the sale price proves that underquoting is a choice, not an inevitability. These accurate agents operate across metro and regional markets, across auction and private treaty sales. The data shows that precise quoting works in any market. Most agents simply choose not to do it.
Auctions Drive Most of the Underquoting
Not all sale methods produce the same level of underquoting. We classified each transaction by its sale method and found a stark divide.
| Sale Method | Transactions | Median Deviation |
|---|---|---|
| Auction | 89,431 | -8.4% |
| Price Listed | 367,892 | -2.0% |
| Offers / EOI | 48,219 | -3.1% |
| Contact Agent | 33,699 | -2.7% |
Auction properties sell 8.4% above the guide price at the median. Properties with a listed price sell just 2.0% above. The gap is fourfold.
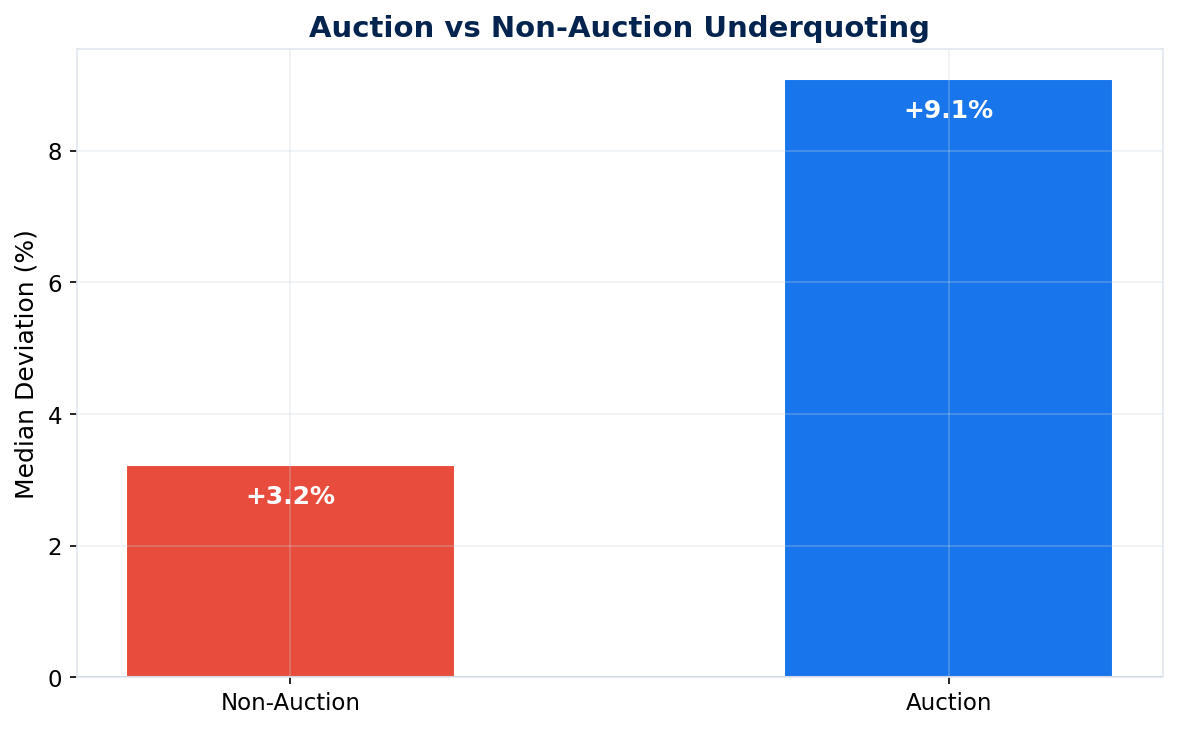
Figure 5: Median underquoting gap for auction vs non-auction sales by state.
State-level auction gaps
Victoria's auction culture produces the worst result. VIC auctions carry a -10.3% median deviation, compared to -3.2% for non-auction VIC sales. NSW auctions run at -7.9%. Even South Australia, which has no specific underquoting legislation, sees a -9.0% gap at auction.
The Northern Territory is the only jurisdiction where the pattern flips. Non-auction NT sales carry a slight overquote of +0.9%, while auction sales underquote by -6.2%.
The auction model incentivises low guides. A lower starting price attracts more bidders. More bidders create competitive pressure. The final price climbs well above the guide. For the vendor, this is a feature. For the buyer, it means the guide price on an auction listing is not a price estimate. It is a marketing tool.
Underquoting Is on the Rise Again
Underquoting briefly improved in late 2024 and early 2025. That improvement has reversed. By Q4 2025, every major state was back at or beyond its mid-2024 levels. Early Q1 2026 data shows no sign of the trend turning around.
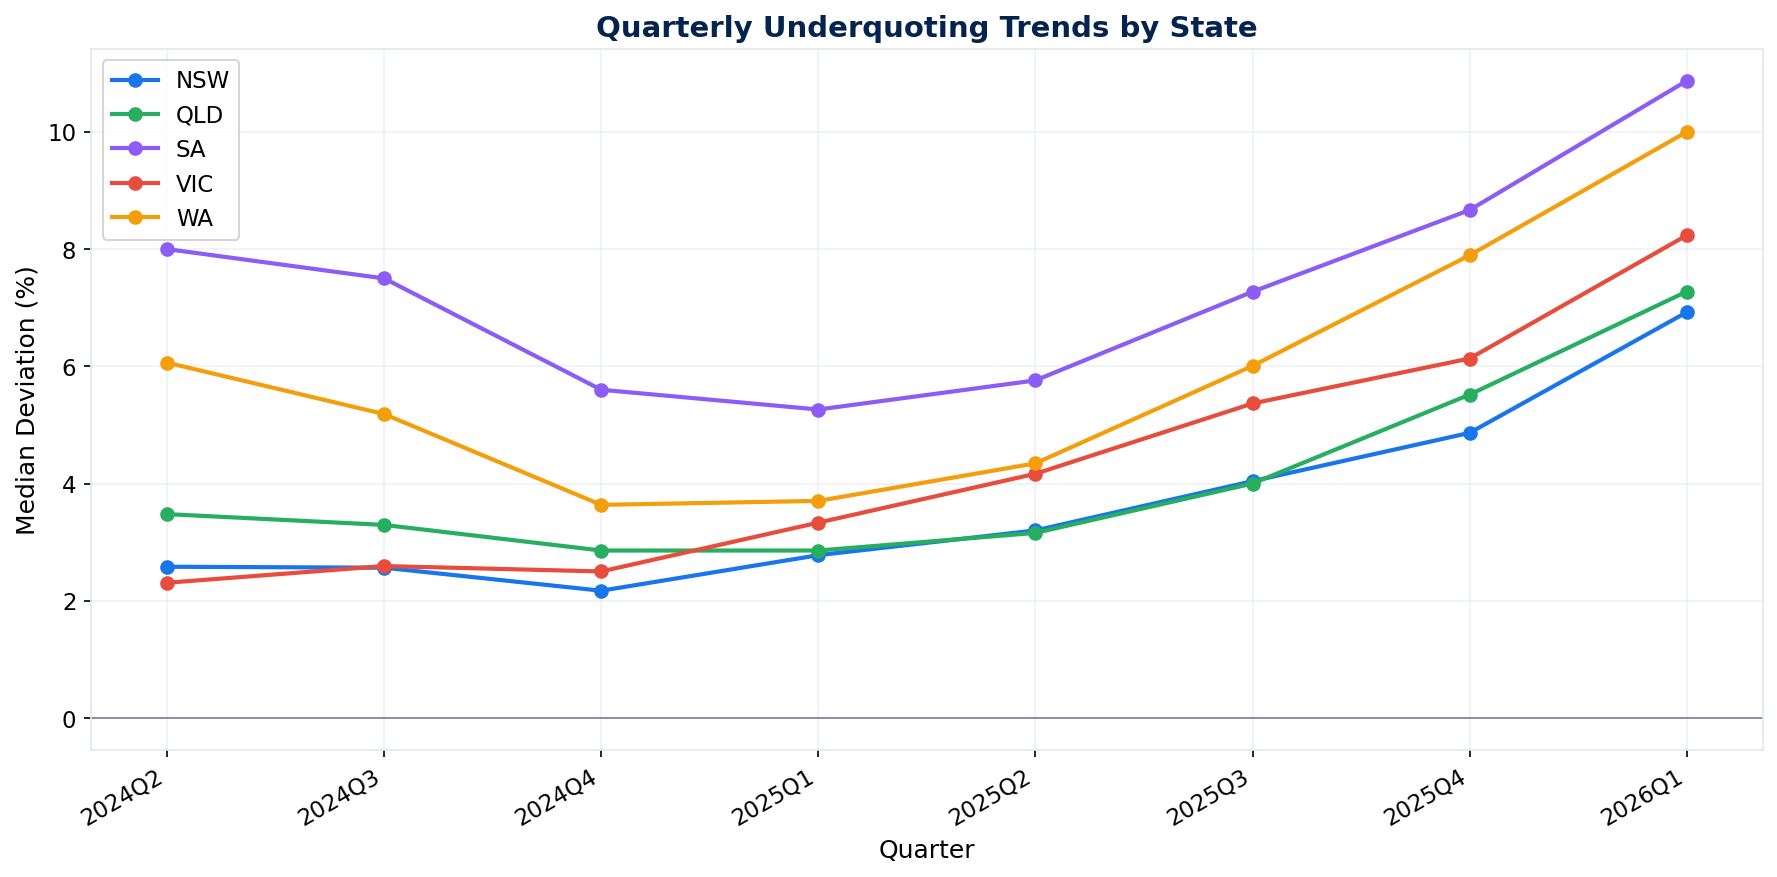
Figure 7: Median underquote percentage by state, Q3 2024 to Q1 2026.
| State | Q4 2024 | Q1 2025 | Q2 2025 | Q3 2025 | Q4 2025 | Q1 2026 | Direction |
|---|---|---|---|---|---|---|---|
| SA | -6.4% | -5.0% | -5.0% | -5.7% | -6.9% | -6.6% | Rising again |
| WA | -3.9% | -3.4% | -3.6% | -4.9% | -6.8% | -6.8% | Rising fast |
| VIC | -2.6% | -2.7% | -3.6% | -4.2% | -4.8% | -3.6% | Rising steadily |
| QLD | -3.1% | -2.7% | -2.8% | -3.4% | -4.5% | -3.9% | Rising |
| NSW | -2.2% | -2.3% | -2.8% | -3.3% | -3.7% | -3.4% | Rising |
Legislation overview
Victoria introduced underquoting laws in May 2017, established a permanent enforcement taskforce in 2022, and increased penalties in July 2024. Despite this, VIC's median underquote rose from -2.6% in Q4 2024 to -4.8% in Q4 2025.
New South Wales has had underquoting provisions since January 2016, with proposed reforms announced in 2025. NSW rose from -2.2% to -3.7% over the same period.
South Australia, Queensland, and Western Australia have no specific underquoting legislation. SA remains the worst at -6.9%. WA rose the fastest, doubling from -3.4% to -6.8% through 2025.
Neither the presence nor absence of underquoting laws appears to improve outcomes. Victoria, with the strongest enforcement regime in the country, saw underquoting rise throughout 2025. South Australia, with no specific laws, sits at -6.9%. Current regulatory approaches are not changing agent behaviour at scale. Underquoting is on the rise again.
Time on Market
The median time from first listing to sold outcome across all tracked agents is 28 days. The mean is 34 days. This confirms that most campaigns are short. The initial quoted price is the price that most buyers see. Revised guides later in the campaign reach fewer eyes.
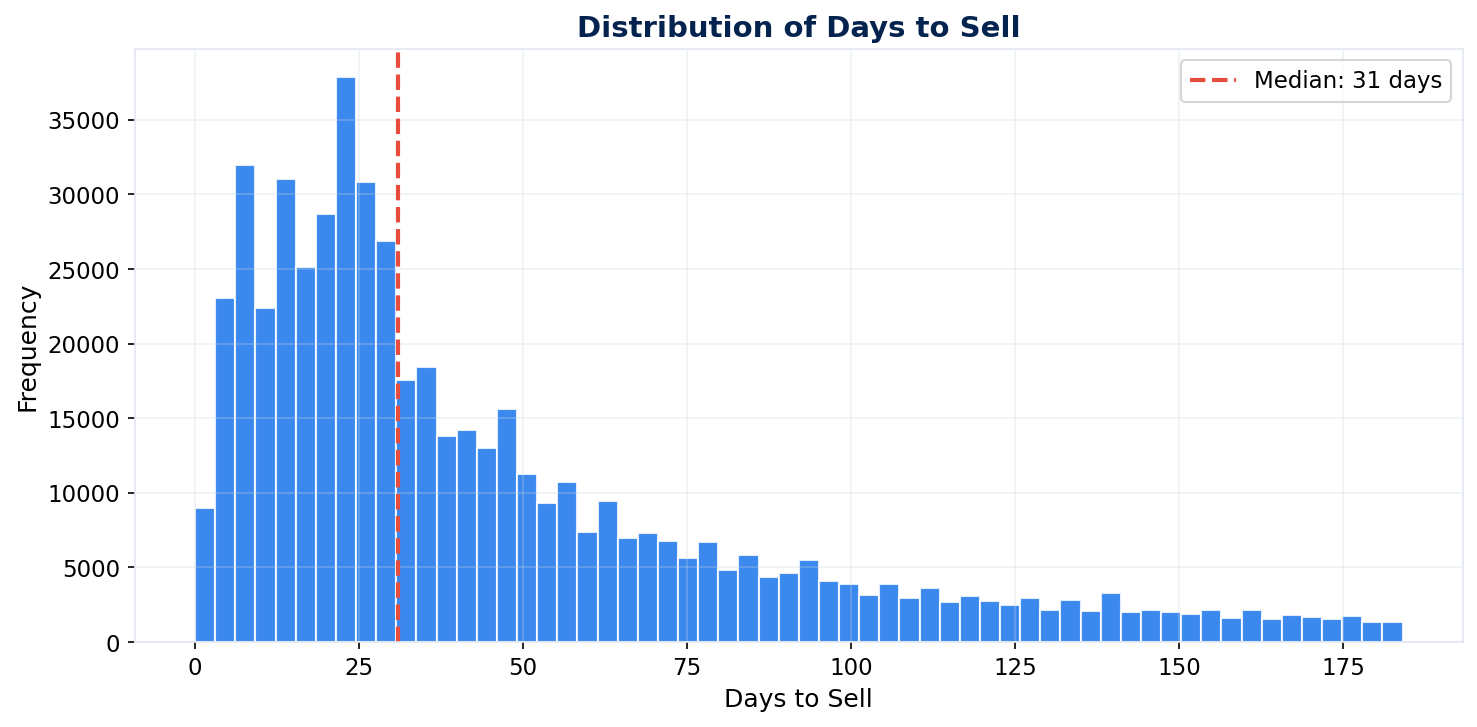
Figure 6: Distribution of median days from listing to sale across all tracked agents.
With a median campaign length of 28 days, the first listed price is the dominant price signal. Buyers who see a property at day one form their budget expectations at that moment. When the property sells 5 to 10% above that figure four weeks later, those buyers have wasted time, money on inspections, and emotional energy.
Limitations
This study has several known limitations that readers should consider:
- AVM matching was limited. We attempted to match transactions to automated valuations (AVMs) to compare agent quotes against independent values. The match rate was only 9.3% (50,230 of 539,241 transactions). This was too low for reliable quote-vs-value analysis. We focused instead on quote-vs-sold, which covers all transactions.
- Address variants create duplicates. Properties listed as "12 Smith Rd" and sold as "12 Smith Road" may appear as separate records. Our GNAF matching mitigates this, but some duplicates persist.
- House-and-land packages. Some agents who appear as extreme overquoters are selling house-and-land packages. The listing shows the completed price, but the sale records only the land component. This inflates overquote figures for a small number of agents, particularly in growth corridors.
- First listing price only. We measure the agent's initial asking price, not revised guides issued during the campaign. Some agents revise upward as they receive offers. Our data does not capture these mid-campaign adjustments.
- Auction guides vs. private treaty. We do not distinguish between auction guide prices and private treaty asking prices. Both are treated as the agent's communicated price to buyers. Auction guides are often set lower by design, which contributes to higher underquoting figures in auction-heavy markets like Sydney and Melbourne.
Check Any Agent's Quoting Track Record
Microburbs tracks quoting accuracy for 31,208 agents across Australia. Search any agent before you sign. Know whether their prices are trustworthy.
Read the companion blog post: 77% of Australian Agents Underquote