
Recent sales and current listings for St Kilda (Vic.). Hover a row to locate the property on the map.
444
Recent sales (3 yrs)
177
Currently for sale
$900
Avg weekly rent (houses)
$508k
Median sale (3 yrs)
| Address | Type | Bd | Ba | Sale price |
|---|---|---|---|---|
| Unit 3, 45 Clyde Street | Unit | 1 | 1 | $450,000 |
| Unit 12, 31 Burnett Street | Unit | 2 | 1 | $590,000 |
| Unit 1307, 3-5 St Kilda Road | Unit | 1 | 1 | $495,000 |
| Unit G3, 40-44 Pakington Street | Unit | 2 | 1 | $490,000 |
| Unit 5, 31 Charnwood Road | Unit | 2 | 1 | $580,000 |
| Unit 21, 19 Robe Street | Unit | 2 | 1 | $640,000 |
| 25 Gurner Street | House | 3 | 1 | $1,300,000 |
Environmental, infrastructure and social risks for St Kilda (Vic.), with the matched capital-growth association where we have a measured study. 8 flagged · 17 tracked.
Amenities, environment, and liveability in St Kilda (Vic.). 6 km from CBD · 0 amenities.
Population, housing tenure, and census indicators
Each row is a price driver in St Kilda (Vic.). Tap to expand. Map on the left shows Microburb-level detail — toggle a row to switch the layer.
VIC 3182 · Data as of 20 Oct 2026
Toggle map layers (multi-select). Click any row for detail.

Median sale prices and 12 month growth
Key market indicators and their impact on capital growth
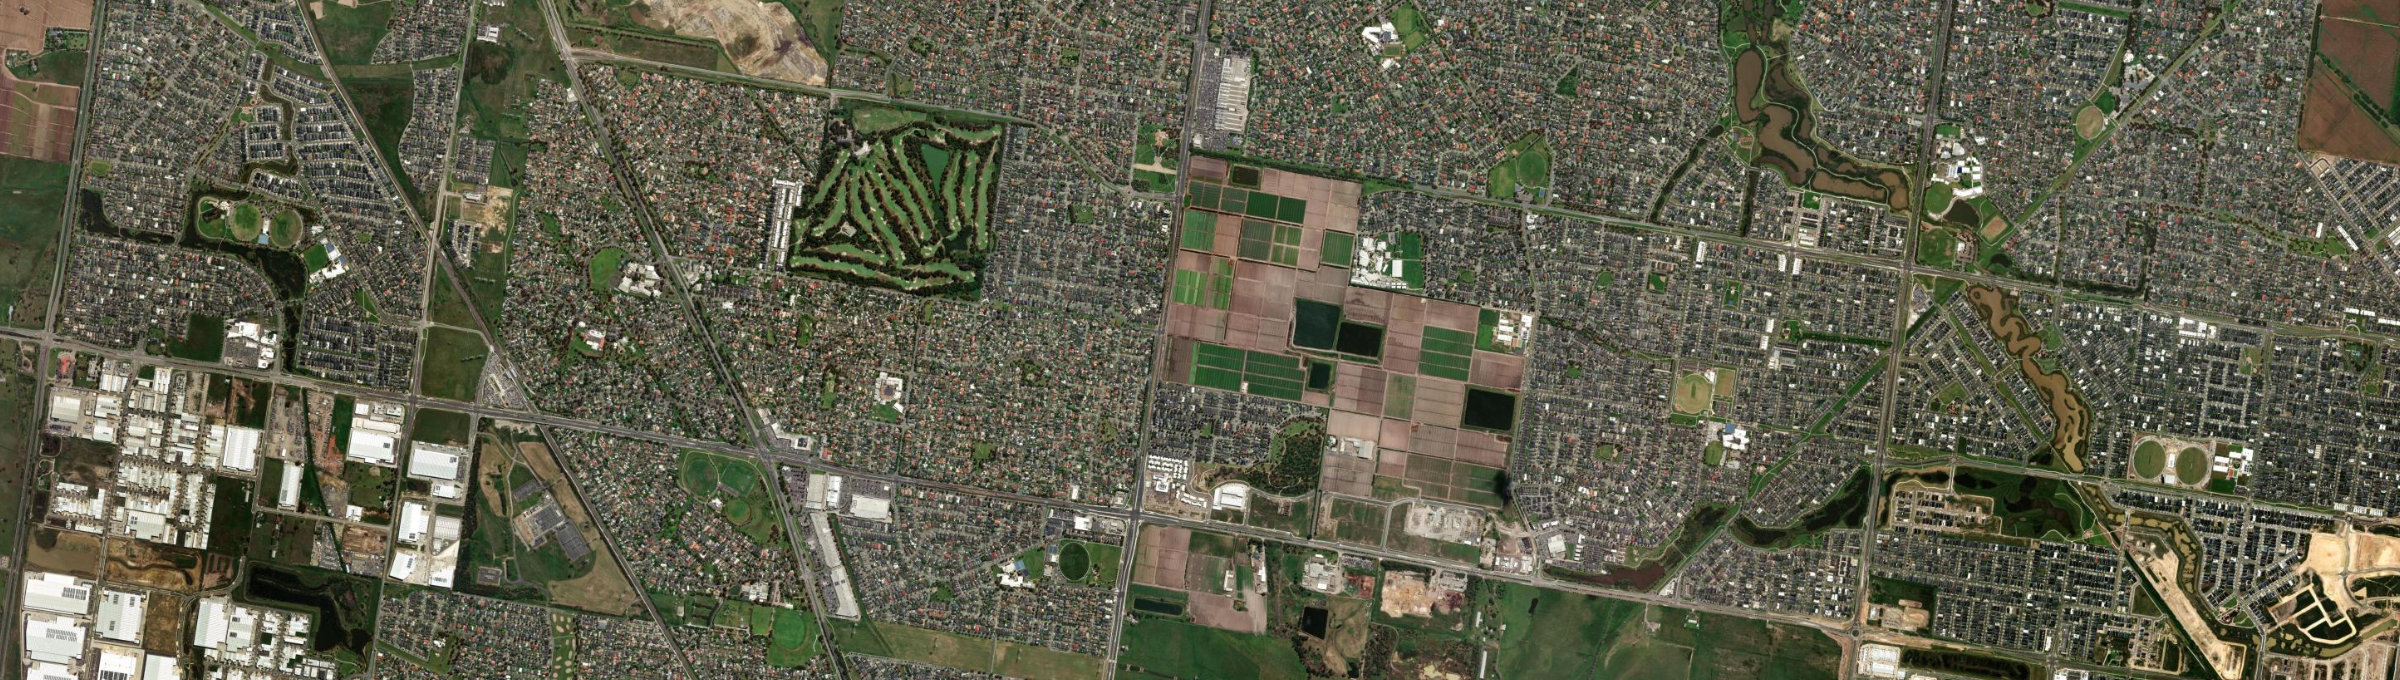
Aerial view
Data as of 12 Nov 2026
Our forecasts identify suburbs that will outperform the national median (30.7% over the same 4 years) with 85% accuracy
Past growth comparison over 1, 3, 5, and 10 years
341 streets listed (341 with 2-8yr forecast, model cutoff 12 Nov 2026) in Cranbourne North, VIC · Melbourne · Growth 2013 to 2026
| Street | Current Price | Past Growth/yr | 4yr Forecast/yr | 8yr Forecast/yr | Confidence | Houses | Units | Rent/wk | Sales Turnover | Rental Turnover | Renters |
|---|---|---|---|---|---|---|---|---|---|---|---|
| Sabel Drive | $701k | — | High | 85 | 0 | $575/wk | 10.3yr👎 | 3yr👎 | 35% | ||
| Alisma Boulevard | $765k | — | High | 117 | 0 | $604/wk | 11.2yr👎 | 3.6yr | 49%👎 | ||
| Courtenay Avenue | $747k | +5%/yr👎 | High | 127 | 7 | $645/wk | 15.9yr👍 | — | 50%👎 | ||
| Endeavour Drive | $666k | +5.4%/yr👎 | High | 123 | 21 | $652/wk | 14.2yr | 3.9yr | 41%👎 | ||
| Lawless Drive | $765k | +5.2%/yr👎 | High | 115 | 0 | $593/wk | 15yr👍 | 5.8yr👍 | 45%👎 |
Price and size by bedroom count in Cranbourne North
| Beds | House Price | Unit Price | Sales (3 yrs) | Median Baths | Median Land |
|---|---|---|---|---|---|
| 1 bed | — | — | 1 | 1 | — |
| 2 bed | $528k | $518k | 15 | 1 | 485 sqm |
| 3 bed | $728k | $600k | 86 | 2 | 544 sqm |
| 4 bed | $835k | $680k | 83 | 2 | 512 sqm |
| 5 bed | $1.0M |
Last 4 weeks of smart median data
| Week | House Price | Chg | Unit Price | Chg | Median Rent/wk | Chg |
|---|---|---|---|---|---|---|
| 19 Oct 2026 | $800k | +0.00% | $586k | +0.00% | $575 | +0.00% |
| 26 Oct 2026 | $800k | +0.00% | $586k | +0.00% | $578 | ▲ +0.52% |
| 02 Nov 2026 | $800k | +0.00% | $586k | +0.00% | $580 | ▲ +0.35% |
| 09 Nov 2026 | $795k |
| — |
| 13 |
| 2 |
| 521 sqm |
| 6 bed | — | — | 1 | 4 | 600 sqm |
| ▼ -0.62% |
| $586k |
| +0.00% |
| $575 |
| ▼ -0.86% |