The property questions every other tool goes quiet on
CoreLogic is now Cotality. HtAG and Stash are everywhere. We compared all of them, feature by feature, and we were honest about where they win. Every claim here is checkable.
 Luke Metcalfe · Microburbs Research · June 2026
Australian investors have more property tools than ever. Cotality (the rebrand of CoreLogic), Domain with Pricefinder, PropTrack from realestate.com.au, HtAG Analytics, Stash Property, SuburbsFinder and DSR Data. All sell suburb statistics and some form of valuation.
Most of them stop at the suburb. A suburb is 10,000 homes averaged into one number. The decisions that make or lose you money happen at a single street and a single property. That is the gap this page is about.
We built this comparison so you can see exactly what you get with each platform in June 2026. Where we have published proof, we link to it. Where a competitor does something better than us, we say so.
After the Budget, how exposed is this suburb to an investor sell-off?
Negative gearing is back in the headlines, and the suburbs most at risk are the ones packed with geared investors. When the policy turns, those owners sell first, and prices fall fastest where they cluster.
Every other tool on this page is silent on it. We map investor concentration and negative-gearing exposure down to the property, so you can see the risk before you buy, not after.
$65,000That is what a flood zone quietly subtracts from a single home, the kind of street detail a suburb median erases. Investor exposure works the same way. The risk sits on particular streets, not the whole postcode, and a single public housing property within 10 metres still costs about 4.2% a year in capital growth.
Microburbs against the three tools you already pay for
Honest, side by side. What they give you, and what we add.
They: the lender-grade name, built for banks and valuers, suburb-level, locked in for 12 months from about $250 a month.
We: built for investors and buyers-agents. Street-level forecasts, a valuation that explains itself, free to start, no lock-in.
They: a clean suburb growth score and a volatility reading, with strong training content. Excellent for a first shortlist.
We: take it to the street and the property. Per-block crime, neighbours, hazards, investor concentration, and a 15-year published backtest.
They: off-market listings, AI buyer-matching and branded briefs. Good for sourcing and managing a buyer pipeline.
We: the research depth underneath the brief. They source the home. We tell you what is actually wrong, and right, about it.
The questions only Microburbs answers at property level
Each one needs data the suburb-level tools do not hold.
1. After the Budget, is this suburb full of investors who will sell first?
New for 2026The suburbs with the most geared investors are the ones most exposed when negative-gearing rules tighten. We measure investor concentration and negative-gearing exposure for every property and suburb. No other platform on this page surfaces it. This is the single most asked question of 2026, and the standard tools cannot answer it.
See it on a live report →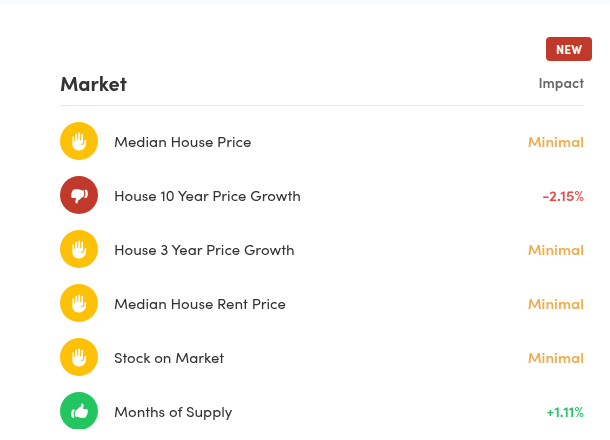
2. How much will this specific street grow?
Street forecastsCompetitors forecast at city or suburb level. We forecast at street level across 353,000 streets. In Castlecrag (Sydney), one street is forecast to grow far faster than the suburb average over the next four years, while another 200 metres away is forecast to lag it. Same suburb. Completely different outcome.
See it on a live report →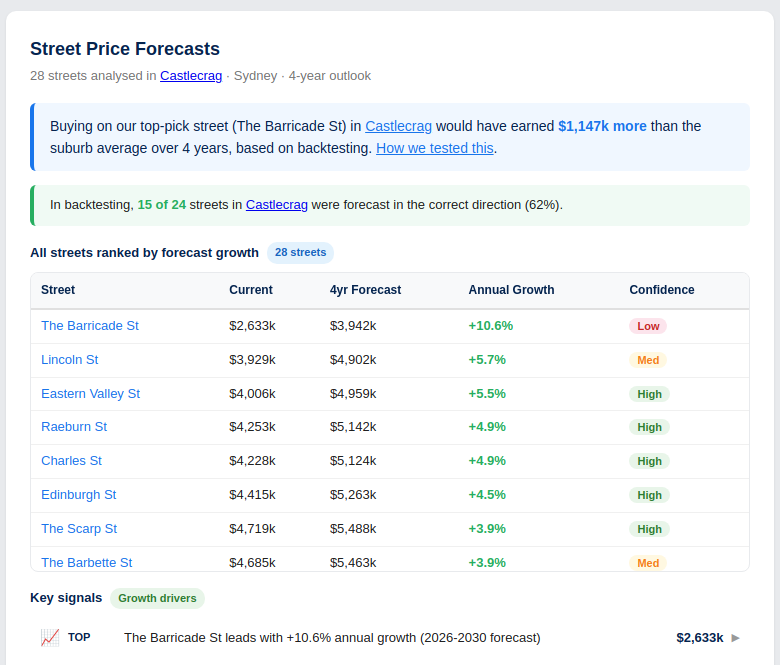
3. What is this property worth, and why?
Explainable valuationEvery rival gives you a number. MicroVal tells you what is driving it. Pool adds $42,000. Flood zone subtracts $65,000. Train station 800 metres away costs $18,000. You see the reasoning, not just the result. Cotality, Domain and PropTrack all hand you a figure with no breakdown.
See it on a live report →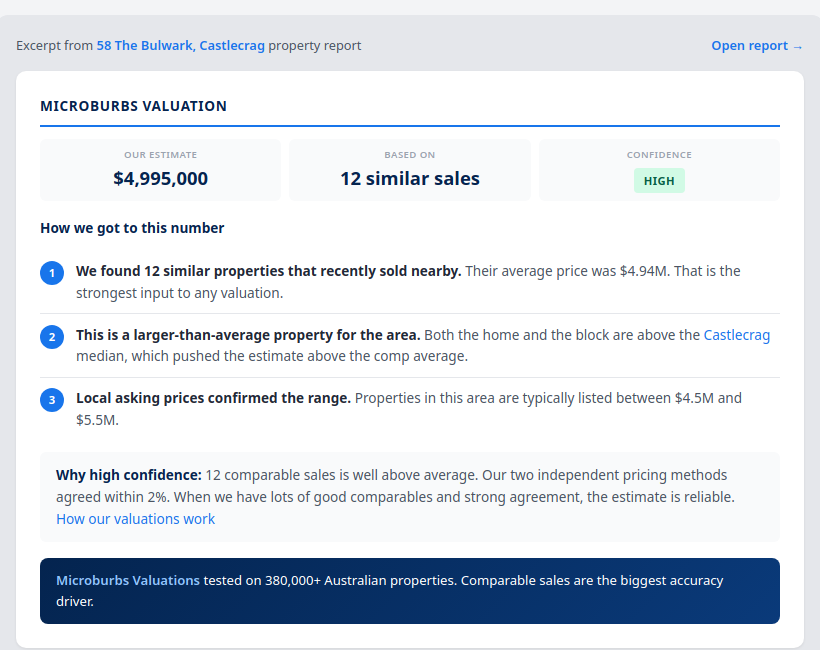
4. Is this street safe, or just suburb-average safe?
Block-level crimeCrime varies up to 286 times within a single suburb. Competitors show one number for Chatswood (Sydney). We show every block of 20 to 60 homes. That is the difference between "moderate crime" and knowing which three streets to avoid.
See it on a live report →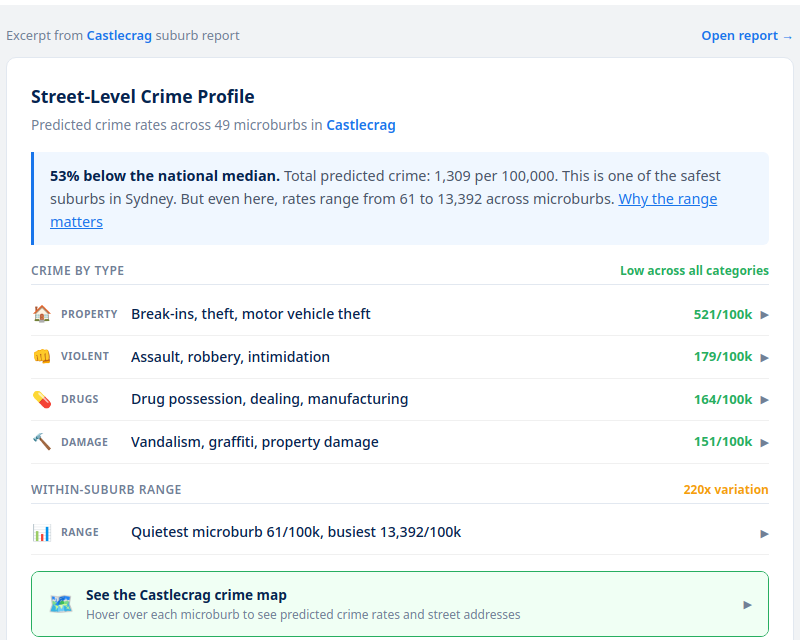
5. Who lives next door, and is there public housing nearby?
Neighbours mapA single public housing property within 10 metres costs about 4.2% per year in capital growth. We map every neighbour within 200 metres as owner, renter or public housing, and we mark all 138,778 social housing properties nationally. Suburb percentages hide the one street that matters.
See it on a live report →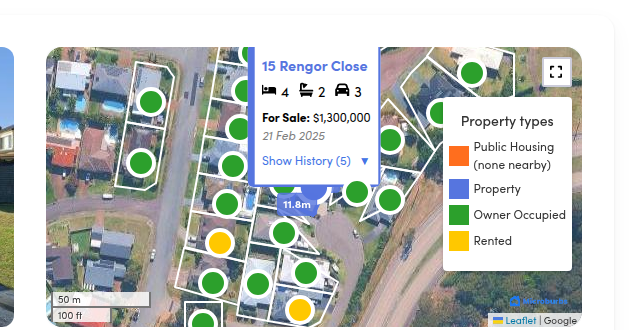
6. Has this forecasting system ever been proven?
15-year backtestWe ran our suburb forecasting system backwards through 15 years of data and published the results. Every year. Every suburb. HtAG shows a confidence score but no public backtest. We have not found another product that publishes one at all.
See it on a live report →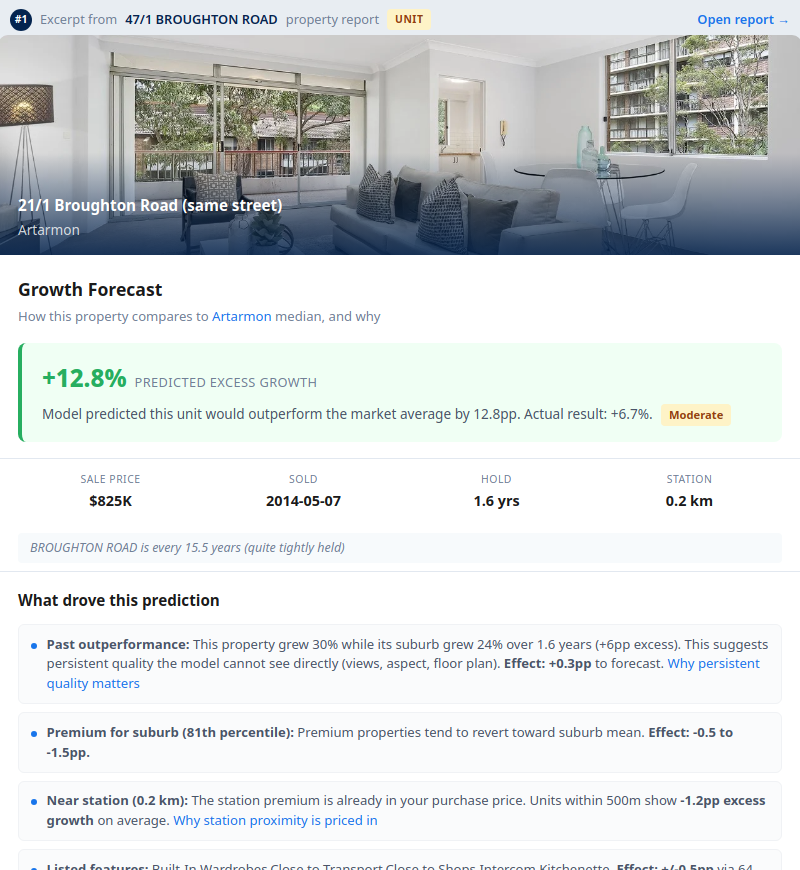
7. What are the real comparables, not just beds and baths?
50+ feature CMATraditional comparisons match on 3 or 4 features. Ours matches on more than 50: pool, solar, flood risk, train distance, school quality, renovation status, bushfire zone, public housing proximity and more. That changes the price.
See it on a live report →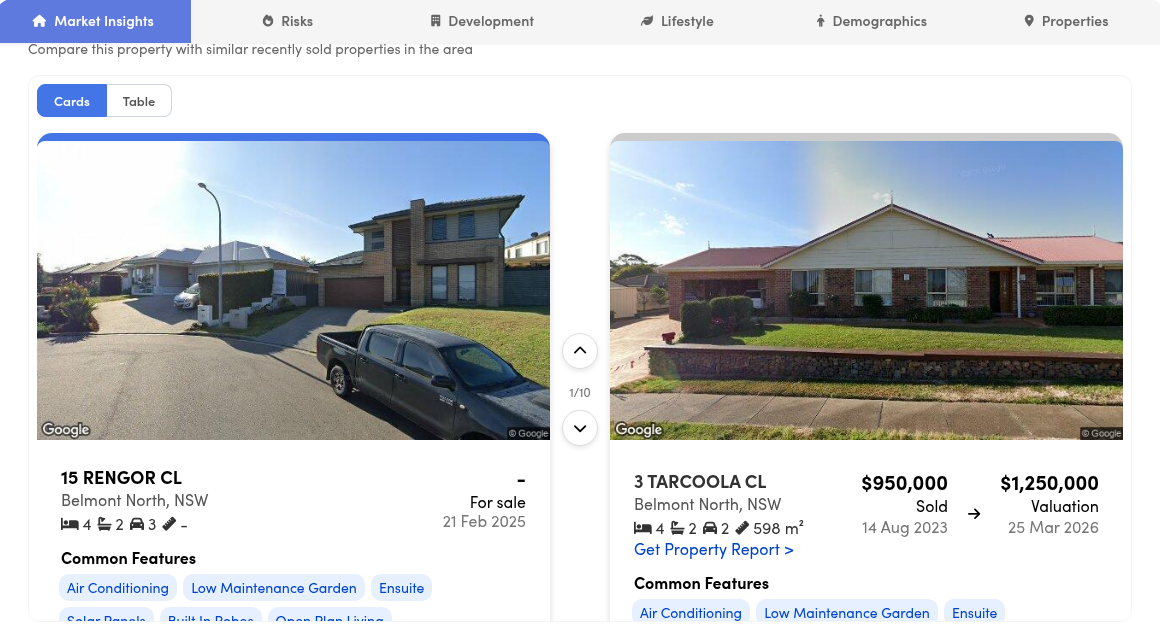
8. How much can I rent this property out for?
Property rental estimateCompetitors show suburb median rent. That tells you nothing about floor 10 versus floor 50 of the same tower. Our rental estimates run property by property. In one Chatswood (Sydney) tower, the gap between floors is $1,600 a week. A suburb median hides that completely.
See it on a live report →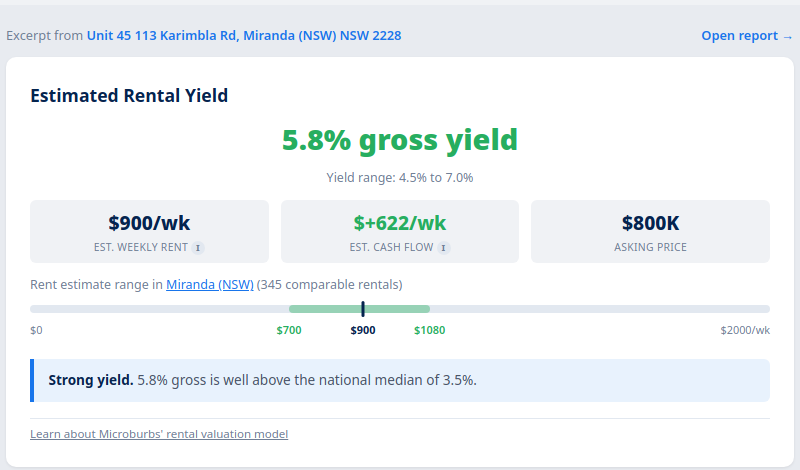
9. What is the hidden cost of owning this one? strata, insurance, mortgage stress
New for 2026The ongoing costs decide your real return. For units we estimate the strata levy and flag special-levy risk. We show the likely landlord insurance premium, and the mortgage-stress level of the surrounding blocks. These are new for 2026 and no competitor on this page carries them at property level.
See it on a live report →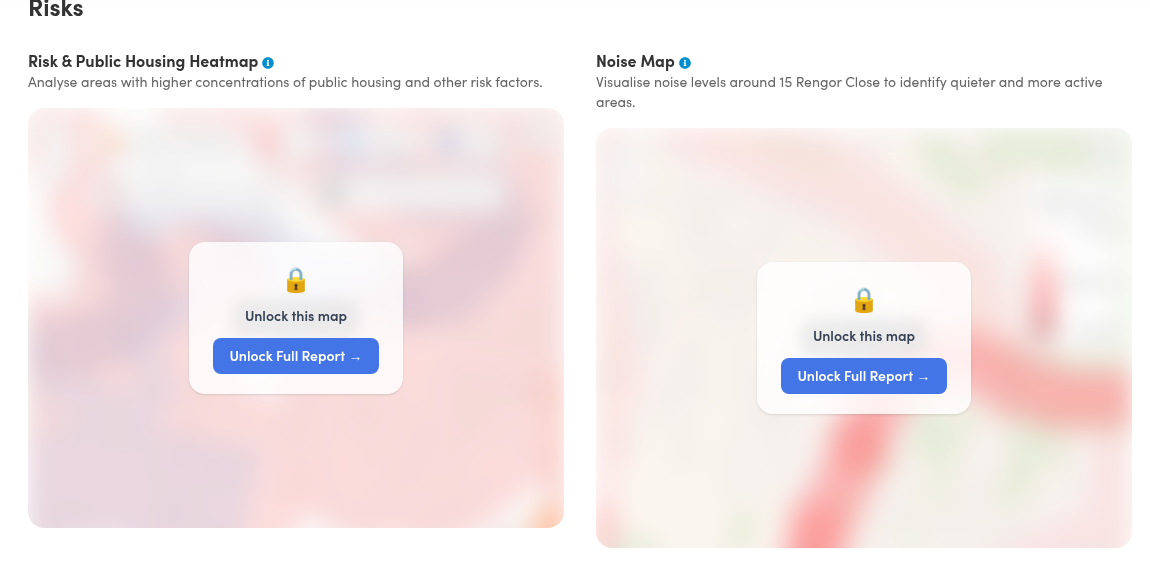
10. What is being built nearby that could change values?
Development and supplyA 200-unit tower approved next door changes supply, views and prices. We track every development application with maps and dates, and we read satellite imagery for construction already underway. Competitors do not show this at property level.
See it on a live report →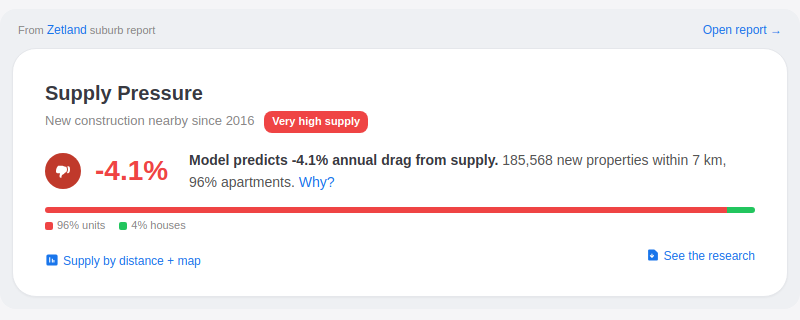
11. What are ALL the hazards on this block?
Expanded for 2026Flood, bushfire, mine subsidence, acid sulfate soil, contamination, aircraft noise and heritage listing, all read for the exact address. Most rivals show flood and bushfire at suburb level, if at all. We map ten registers at the property.
See it on a live report →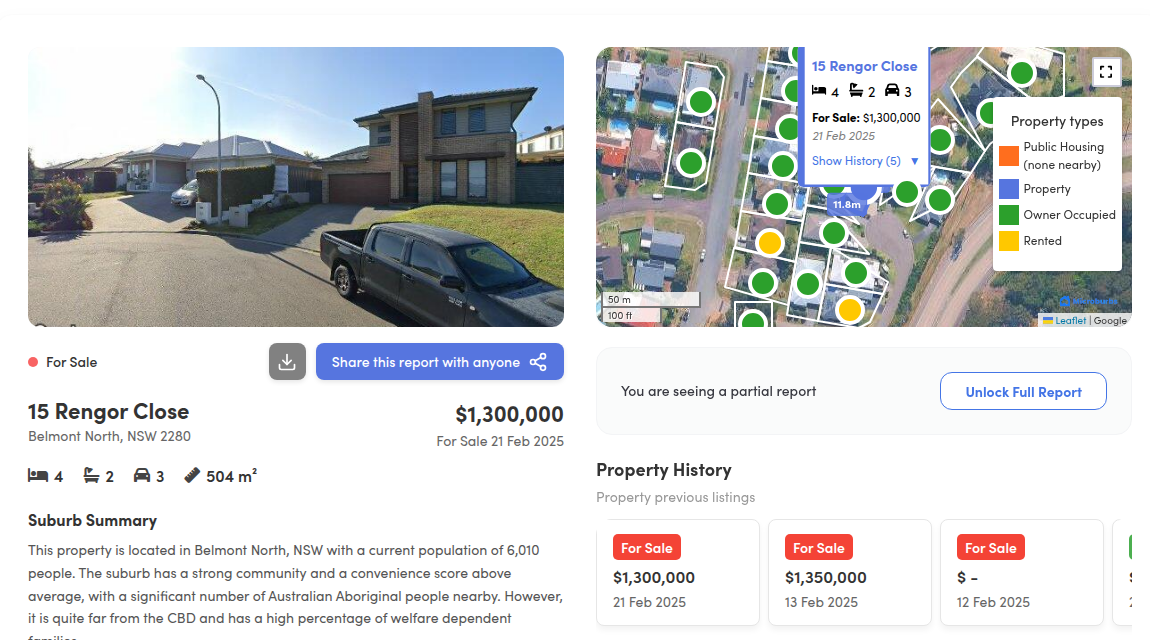
12. What is the land actually worth here?
New for 2026Two homes at the same price can sit on very different land. We split land value from total value and show the land-to-value ratio for the property, the signal that matters most for knock-down rebuilds and long-run growth. Cotality holds land data for valuers. We put it in front of the investor.
See it on a live report →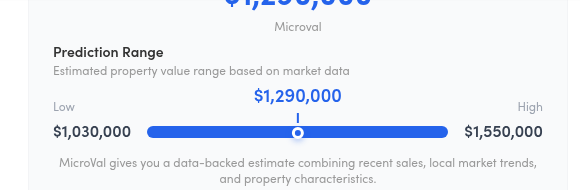
Where the competitors do something better
No tool wins on everything. Here is what each does well, and the honest trade-off.
One correction worth making
Stash publishes a useful directory of property data providers. It lists Microburbs as "suburb level".
We forecast 353,000 individual streets, predict crime for every block of 20 to 60 homes, and value land for individual addresses. That is property and street level, not suburb level.
We would welcome a correction. It is an easy mistake to make, because almost everyone else in the category really does stop at the suburb.
The Granularity Gap
Each dart lands where that platform's data stops. Only Microburbs hits the bullseye.

The full detail
Every feature, every platform, verified June 2026. Scroll across to see all eight competitors.
| Feature | Microburbs | Cotality (CoreLogic) | Domain (Pricefinder) | PropTrack (REA) | HtAG | Stash | SuburbsFinder | DSR Data |
|---|---|---|---|---|---|---|---|---|
| Property valuation (automated)Per-property price estimate | ✓MicroVal | ✓Lender-grade | ✓ | ✓realEstimate | ✗ | ~3rd party | ✗ | ✗ |
| Rental valuationPer-property weekly rent | ✓ | ~ | ✓ | ✗ | ✗ | ✗ | ~Yield only | ✗ |
| Valuation explains WHYShows what drives the figure up or down | ✓Feature drivers | ✗ | ✗ | ✗ | ✗ | ✗ | ✗ | ✗ |
| Street-level growth forecastForecast for each street, not the suburb | ✓353k streets | ✗ | ✗ | ✗ | ✗ | ✗ | ✗ | ✗ |
| Suburb growth forecastForward price prediction per suburb | ✓House and unit | ~City/state | ~City | ~City | ✓RCS score | ~Median trend | ~Projection | ~DSR score |
| Forecast volatility or confidence scoreA read on how reliable the outlook is | ~Confidence range + backtest | ✗ | ✗ | ✗ | ✓Volatility score | ✗ | ✗ | ~Within DSR |
| Published 15-year forecast backtestTransparent accuracy test, every suburb | ✓15 years | ~Valuation accuracy only | ✗ | ~Valuation specs only | ✗ | ✗ | ✗ | ✗ |
| Crime at block levelCrime for each block of 20 to 60 homes | ✓Per block | ~Suburb only | ✗ | ✗ | ✗ | ✗ | ✗ | ✗ |
| Investor concentration and Budget exposureNegative-gearing sell-off risk | ✓Property and suburb | ✗ | ✗ | ✗ | ✗ | ✗ | ✗ | ✗ |
| Mortgage stressFinancial pressure on surrounding owners | ✓Per block | ✗ | ✗ | ✗ | ✗ | ✗ | ✗ | ✗ |
| Land value and land-to-value ratioHow much of the price is land | ✓Per property | ~For valuers | ✗ | ✗ | ✗ | ✗ | ✗ | ✗ |
| Strata levy and special-levy riskOngoing cost estimate for units | ✓Units | ✗ | ✗ | ✗ | ✗ | ✗ | ✗ | ✗ |
| Supply pressure and construction activityWhat is being built nearby right now | ✓Satellite-read | ✗ | ✗ | ✗ | ~In score | ✗ | ~In score | ~In DSR |
| Comparison on 50+ featuresPool, solar, flood, trains, schools | ✓50+ features | ~Beds/baths/land | ~Beds/baths/land | ~Beds/baths/land | ✗ | ✗ | ✗ | ✗ |
| Natural hazard overlaysBushfire, flood, subsidence, noise, heritage | ✓10 registers | ✓ | ✓Perils | ✗ | ✗ | ~Zoning | ✓Flood/bushfire | ✗ |
| Public housing proximityDistance to social housing, per address | ✓Mapped | ✗ | ✗ | ✗ | ✗ | ✗ | ✗ | ✗ |
| Neighbours tenure mapOwner, renter or public housing at 200m | ✓ | ✗ | ✗ | ✗ | ✗ | ✗ | ✗ | ✗ |
| Off-market and pre-market listingsStock before it hits the portals | ✗ | ✗ | ~On-market | ~On-market | ✗ | ✓Off-market | ✗ | ✗ |
| AI buyer-matching or assistantMatch a brief to stock automatically | ~Research API | ✗ | ✗ | ~Listing AI | ~AI access | ✓Matching | ✗ | ✗ |
| Open research and whitepapersPublished methodology you can read | ✓15+ papers | ~Market reports | ~Market reports | ~Market reports | ~Articles | ~Blog | ~Guides | ~Blog |
| Finest data granularitySmallest unit for analysis | ✓Block of 20 homes | ~Suburb | ~Suburb | ~Suburb | ~Suburb/LGA | ~Property listing | ~Suburb | ~Suburb |
| Free tierUse it before you pay | ✓ | ✗ | ✗ | ✓Limited | ✗ | ✗ | ~Trial | ~No-data tier |
| Starting priceLowest paid plan, June 2026 | $77/moFree plan, no lock-in | ~$250/mo12-month lock-in | ~$175/moPricefinder | Free (limited)Via realestate.com.au | ~$250/moBilled quarterly | ~$249/moNo lock-in | ~$99/moBasic plan | ~$270/moPro plan |
Why this matters for investors
Scenario: the Budget puts negative gearing back in play
Other platforms: show you the suburb median and a growth score. Nothing about how many owners around this property are geared investors who would sell first if the rules change.
Microburbs: shows investor concentration and negative-gearing exposure for the property and the suburb, so you can avoid the blocks most likely to flood with stock.
Scenario: you want to check if a street is safe
Other platforms: show you suburb-level crime. A suburb of 10,000 homes is averaged into one number. The quiet end and the trouble spot get the same score.
Microburbs: crime for every block of 20 to 60 homes. You see exactly which streets have incidents and which do not.
Scenario: you want the true cost of a unit, not just the price
Other platforms: give you the asking price and a suburb median rent. The strata levy, the special-levy risk and the insurance cost are left for you to find out later.
Microburbs: estimates the strata levy, flags special-levy risk, and shows the likely insurance premium, so the real yield is clear before you offer.
See it on a live report
Every feature above appears inside our live suburb and property reports. Search any address and judge it yourself.
How we compiled this comparison
We reviewed each competitor's public website, product documentation, published research and pricing as of June 2026. For a feature marked with a cross, we verified it is not available in any publicly accessible product tier. For a tilde, we describe the specific limitation. Pricing is the lowest paid plan we could confirm and may change.
CoreLogic now trades as Cotality, and RP Data is its main product. We use the current brand name. Dashdot closed in May 2026 and is no longer listed. Stash Property publishes a provider directory that lists Microburbs as suburb level, which we have addressed above.
If any competitor believes a feature has been misrepresented, we welcome corrections at [email protected]. We will update this page with verified changes.
See the difference for yourself
Search any Australian suburb or property and see data no other platform provides. Start free. No card. No 12-month lock-in.
Search SuburbsSearch Properties