
What we found
- $1.2 million between two streets. Mundy Street, Mentone, Melbourne came to about $2.2 million a house, and Bundora Parade about $1 million (July 2026).
- Your house can miss the suburb's rise. In Mermaid Beach, Gold Coast, the typical price rose 3.8 times from 2014 to 2024. The same houses rose 2.4 times.
- The suburb figure misses both. Mentone's typical house came to $1.3 million, far from either street.
- Land can cost a ninth as much. A square metre at Woy Woy, NSW was about $1,774, against $16,507 at Redfern, Sydney (June 2026).
- Cheaper towns too. In Lithgow, NSW, houses on the Great Western Highway came to about $481,000, and on Maple Crescent, 2.6 km away, about $575,000 (August 2026).
Our research: Street by street, not suburb by suburb
The story: why is one street worth more than the next?
Mentone sits on Port Phillip Bay in Melbourne's south east. Mundy Street runs down to the beach. A typical house there came to about $2.2 million in July 2026, across 48 houses.
Bundora Parade is about 3 km inland, near the warehouses. A typical house there came to about $1 million, across 18 houses.
Mentone's typical house came to $1.3 million. That one figure misses both streets by a long way. It is the same in cheaper towns too.
In Lithgow, NSW, houses on the Great Western Highway came to about $481,000 in August 2026. On Maple Crescent, by a park 2.6 km away, the same sort of house came to about $575,000.
Why didn't my house grow as much as my suburb?
Our reel: much of your suburb's growth never reached your house.
In Mermaid Beach, Gold Coast, the typical house price rose 3.8 times from 2014 to 2024. Both measures started at about $890,000 in 2014.
The same houses, bought and sold again, rose only 2.4 times. By 2024 the typical price read $3.35 million and the same houses $2.13 million. We measured that on 1,153 resales.
The gap is bigger and newer homes replacing what stood there. If your neighbours all rebuild, your own house has not changed. Every suburb report shows its repeat sales, so you see what the same homes did.
Which streets carry a suburb's crime?
Our reel: Sydney's five worst suburbs for crime, street by street.
Sydney's worst suburb for crime is not out west. It is Haymarket, where the tourists walk every day. Haymarket recorded 359 offences a year for every 1,000 residents, against 51 for Sydney as a whole (NSW Bureau of Crime Statistics and Research, July 2025 to June 2026, the city centre left out).
The rest of the five are Penrith, Potts Point, Woolloomooloo and Surry Hills, each four to five times Sydney's rate. Inside them, crime sits on a few blocks. In Potts Point, 12 street blocks out of 115 carried 38% of the crime, mostly near the pubs and bars by Kings Cross station.
Every suburb report has a street-by-street crime map, so you see your own block, not just the suburb.
What is being built near my street?
Our reel: most of Sydney's new homes aren't houses.
Sydney added about 86,000 new apartments and 83,000 new houses from August 2021 to April 2026. Those are new addresses on the national address register.
Other cities build very differently. Melbourne added about four new houses for every apartment. Perth added about eight.
Every suburb report shows the mix of houses, townhouses and apartments in that suburb.
What is the land under my home worth?
Our reel: Central to Woy Woy, land value per square metre, station by station.
We rode the train from Central to Woy Woy on the NSW Central Coast. The ride took 64 minutes. These are dear suburbs, so the house medians run over $1 million.
Land at Redfern, Sydney was worth about $16,507 a square metre in June 2026. At Woy Woy it was about $1,774, roughly a ninth.
A typical Redfern block is about 139 square metres. A typical Woy Woy block is about 569. For buyers under $800,000, Woy Woy's typical unit was $774,000 in June 2026.
Microburbs has a value per square metre for every block. Two homes at one price can sit on very different land.
How we made this reel
- Every house valued on its own address. We price each home, then group them by street and by street block.
- Every sale and resale, street by street. Homes sold twice show what the same house really gained over the years.
What it means for you
- Look up the street, not the suburb. An agent quoting the suburb figure may be quoting the wrong street.
- Compare the land, not just the house. Two homes at one price can sit on very different land.
- Check what the same homes did. A suburb's rise can come from new homes, not from houses like yours.
Where to see it on Microburbs
- Street Profile, in the Market section. Every suburb report lists each street with its own price and forecast.
- Repeat sales, in the same report. See what the same homes sold for, again and again.
See every street in Sandy Bay →
Get the data
The data behind this reel, for any suburb, is live in our API: every street with its own price and forecast. Sandy Bay, Hobart has 140 of them. Mawhera Avenue comes to about $528,000 and Coolabah Road to about $727,000, against a suburb figure of about $981,000.
Try it now, free. This request is free for our sample suburbs, one in each state and territory, with no sign up and no card:
curl "https://api.microburbs.com.au/v1/suburbs/Sandy%20Bay/street-forecasts" \
  -H "Authorization: Bearer test"
What it sent back on 11 November 2026, cut to one street of 140 and two years of its history:
{
  "data": {
    "area_name": "Sandy Bay",
    "area_level": "suburb",
    "metric": "street_price_forecasts",
    "total": 140,
    "streets": [
      {
        "street": "SANDY BAY",
        "current_price": 1420000.0,
        "n_sales": 758,
        "target_2y": 1733370.6923481321,
        "annual_2y": 10.5,
        "target_4y": 2017619.8929769623,
        "annual_4y": 9.2,
        "target_8y": 2468121.255527026,
        "annual_8y": 7.2,
        "history": [
          {
            "year": 2008,
            "price": 771941.3227275382,
            "suburb_med": 462228.0
          },
          {
            "year": 2009,
            "price": 826686.1207831424,
            "suburb_med": 445683.0
          }
        ]
      }
    ]
  }
}
See the full API docs for every request, the price of each and how to get a key for the rest of Australia.
Check prices and forecasts street by street in your suburb
Street Profile, in the Market section. Every suburb report lists each street with its own price and forecast.
More reels
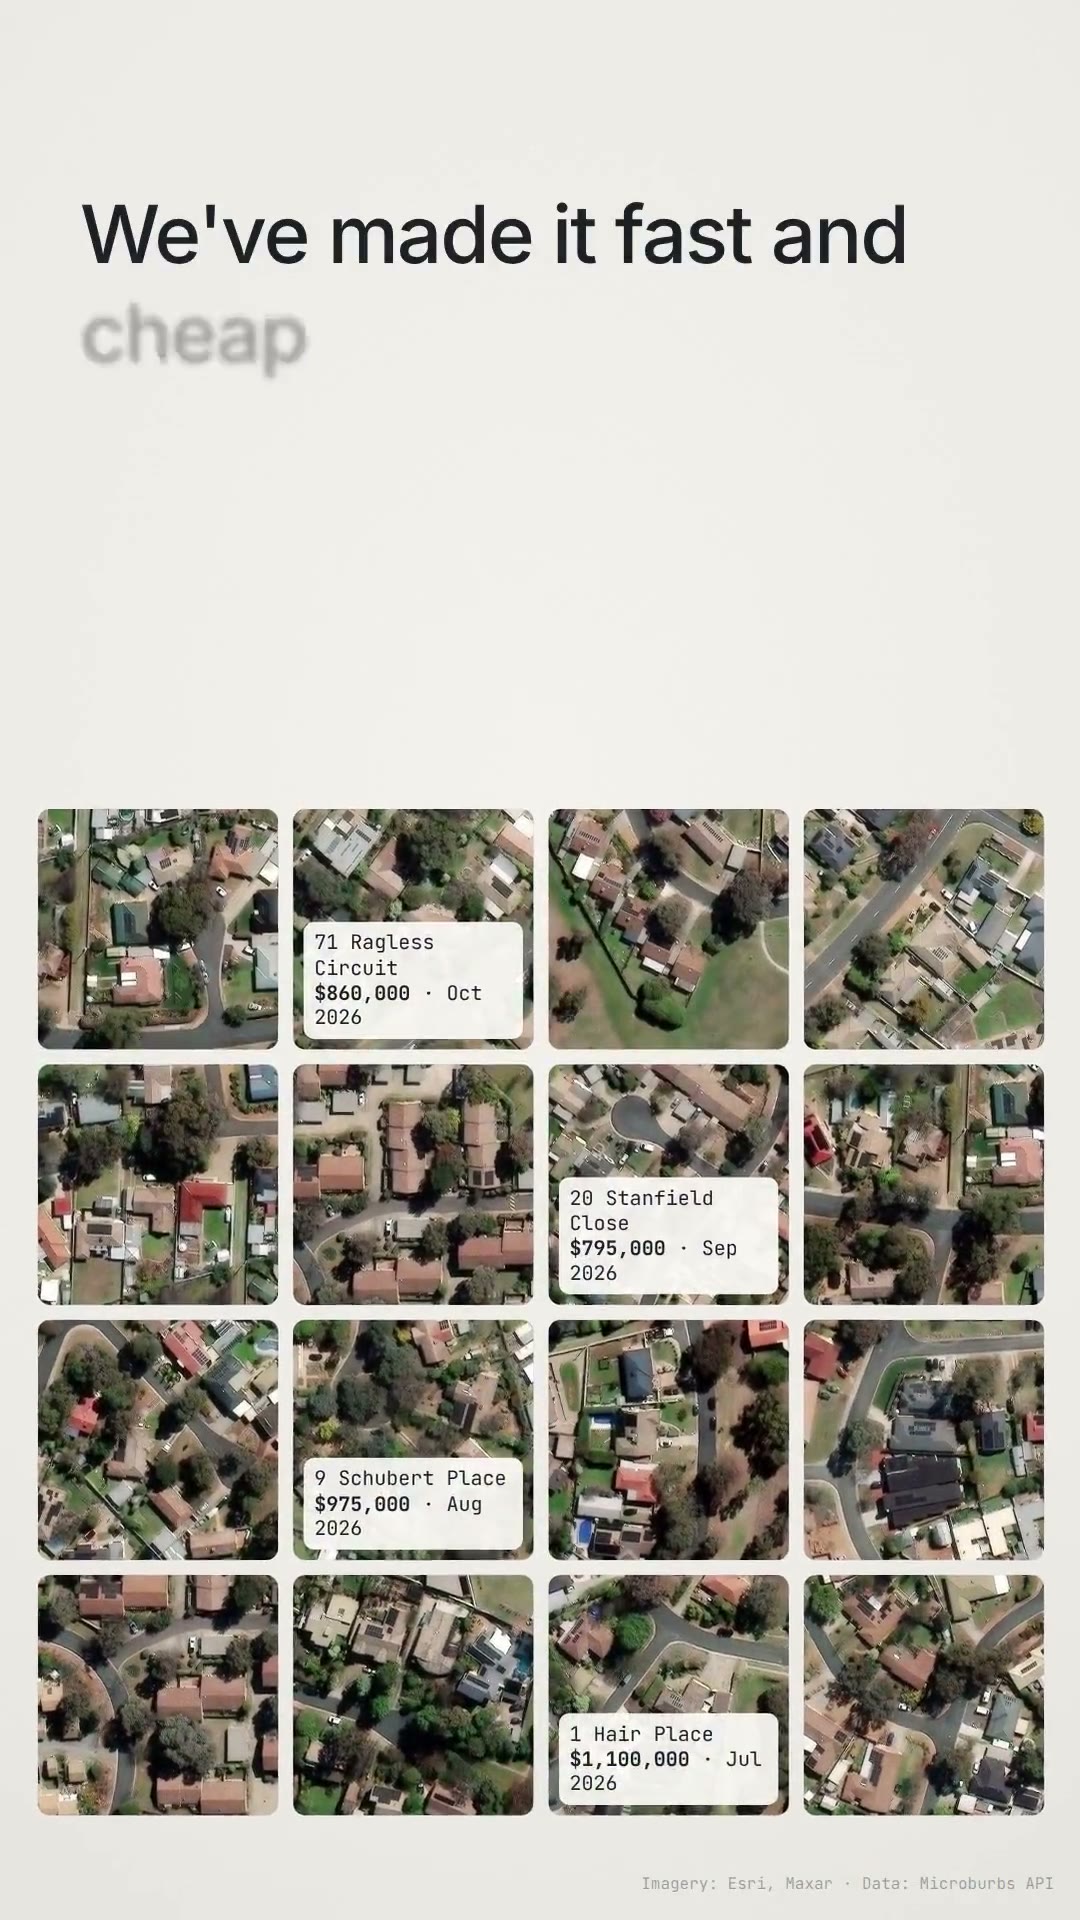 Australian property data by address: every block in the country, and who lives on it
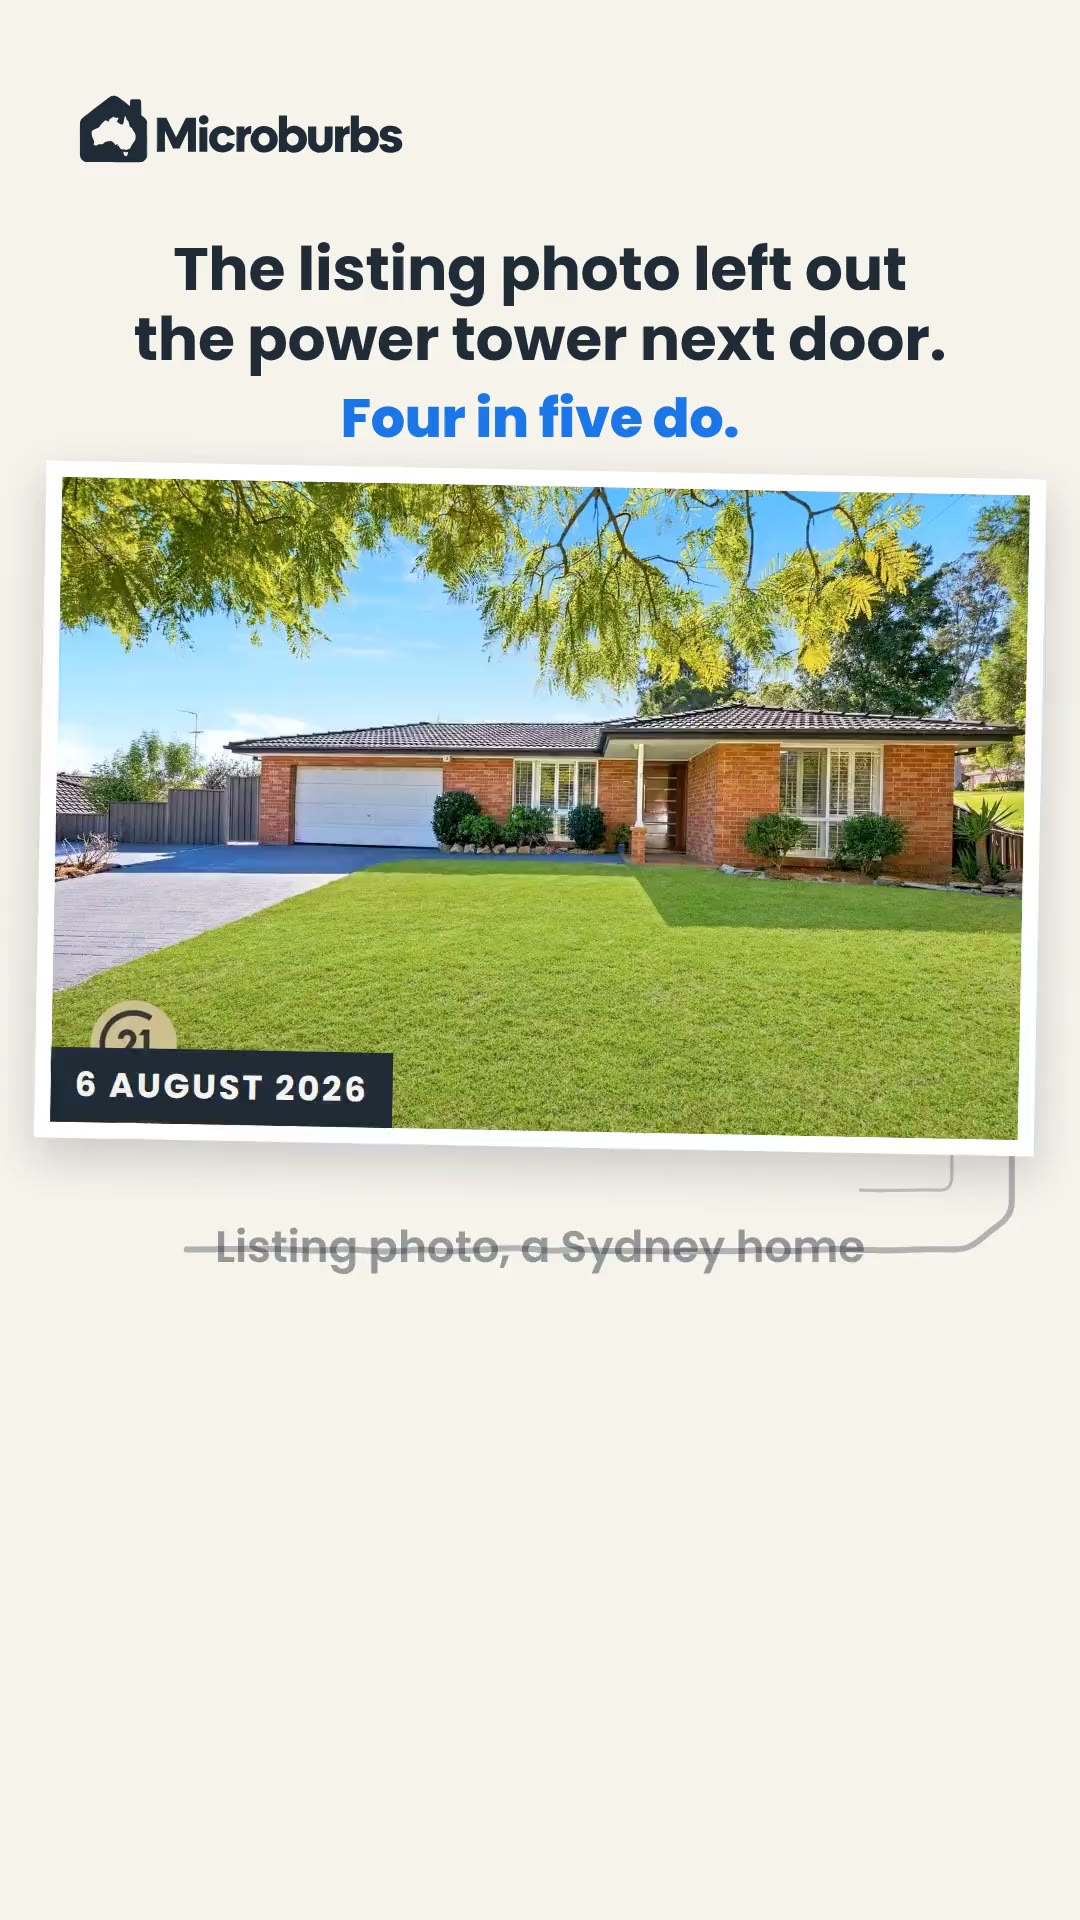 What to check before buying a house: what the listing photos leave out
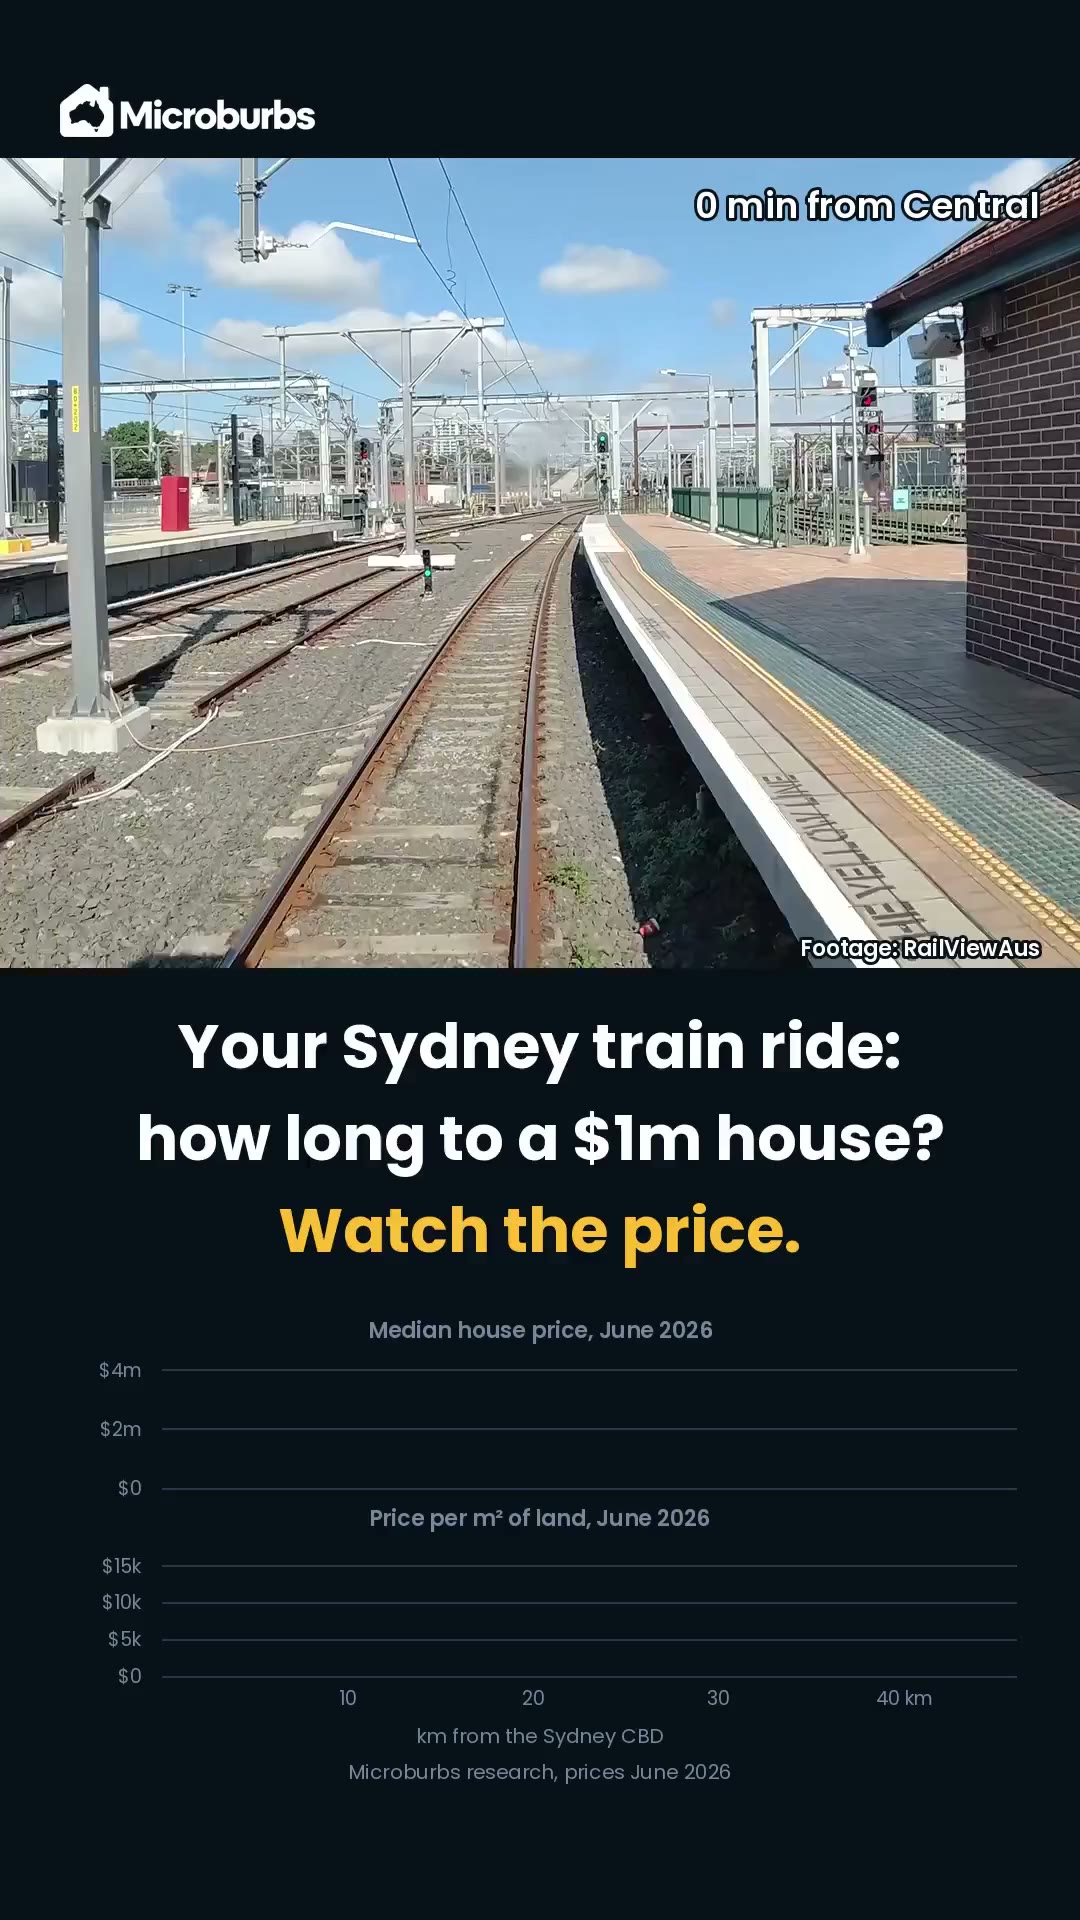 How far from Sydney is a $1 million house? Ride the train north and watch the price
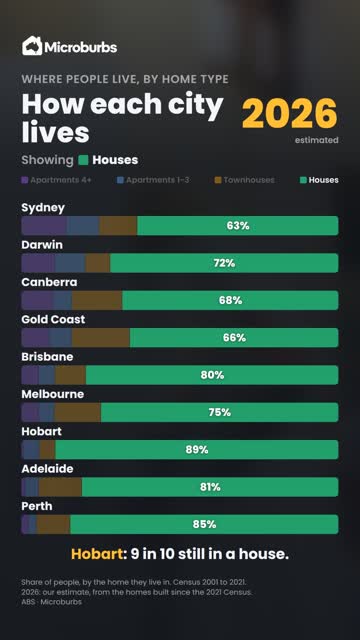 Houses or apartments: which Australian city lives in what, 2001 to 2026