How Reliable Are Property Experts?
A first-principles analysis of 15 years of Australian national dwelling price forecasts. Measuring direction accuracy, failure modes, and what expert consensus actually means for property investors.
By Luke Metcalfe · Microburbs Research · February 2026
The headline looks good. The detail does not.
Direction accuracy is 81%. Experts correctly called up or down in 13 of 15 years. But Australian property rose in 12 of those 15 years. A permanent-bull strategy of always predicting ‘prices go up’ would score 75% by default.
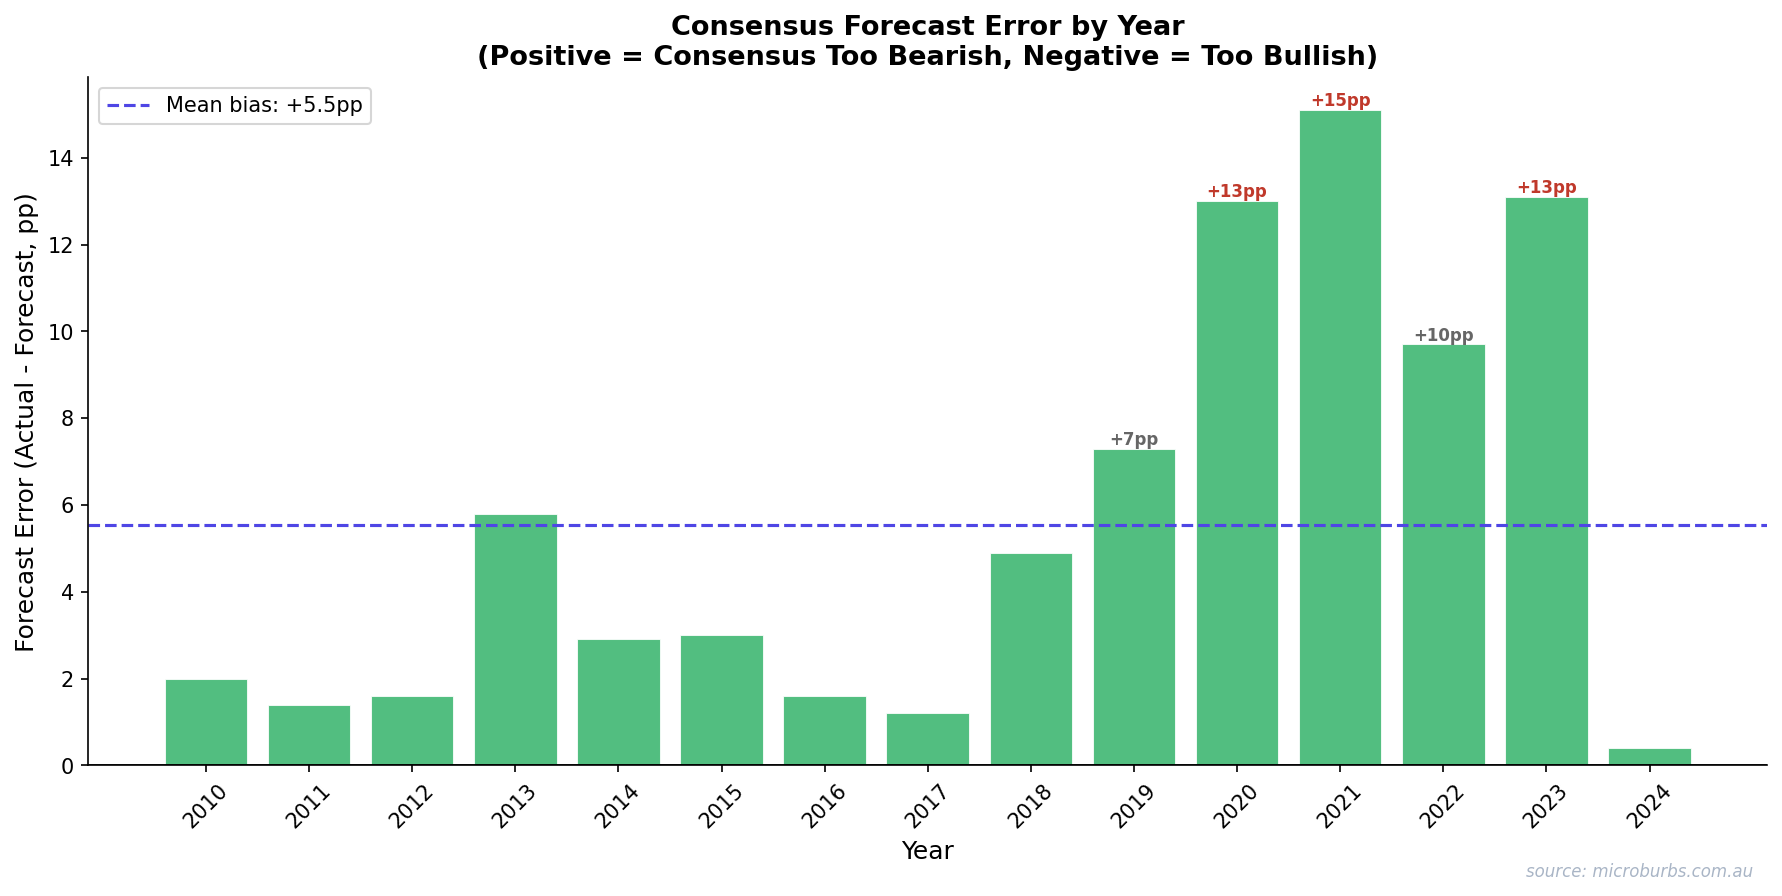
The expert edge over that baseline is +6 percentage points. That gap is not statistically significant (p ~0.24). Two failure modes matter most. Bearish calls fail 43% of the time. And magnitude is systematically understated by 3.6 percentage points on average.
Investor utility of following consensus is near-zero. A consensus-following strategy beats buy-and-hold by just $8 on a $100 starting balance over 16 years. That is +3.4% total, or roughly +0.2% per annum. After transaction costs, it goes negative.
The 81% accuracy figure is real. But it tells you almost nothing about whether you should listen to expert forecasts when making property decisions.
The Question
Every December, Australian banks, economists, and research houses publish national dwelling price forecasts for the year ahead. These forecasts shape billions in investment decisions. Media amplifies them. Buyers agents cite them. Investors trade on them.
But how good are they? Not ‘do they sound reasonable.’ How good are they when measured against what actually happened?
We collected 115+ individual forecasts from 20+ institutions over 15 years (2010 to 2024). Then we tested each one against reality. The answer breaks into four dimensions.
Four dimensions of reliability:
1. Direction. Did experts get up/down right?
2. Failure modes. When and how do experts get it wrong?
3. Magnitude. How far off are the actual numbers?
4. Investor utility. Does following consensus make money?
Each dimension tells a different story. The direction number looks impressive. The rest of it does not.
The 15-Year Scorecard
This is the full record. Every year from 2010 to 2024. Consensus forecast range, actual outcome, error, and direction call. No cherry-picking. No omissions.
2025 is excluded. Using current-year data creates a circularity risk where the forecast and measurement overlap.
| Year | Consensus | Actual | Error | Direction | Note |
|---|---|---|---|---|---|
| 2010 | +3% to +5% | +5.0% | +0.0pp to +2.0pp | Correct | Stimulus tailwind |
| 2011 | +3% to +5% | −3.8% | 6.8pp to 8.8pp | Wrong | GFC aftershock, rate rises |
| 2012 | Flat to +3% | +0.3% | 0.0pp to +2.7pp | Correct | Slow recovery |
| 2013 | +3% to +5% | +9.8% | +4.8pp to +6.8pp | Correct | Credit boom begins |
| 2014 | +5% to +7% | +7.9% | +0.9pp to +2.9pp | Correct | Sustained credit growth |
| 2015 | +4% to +6% | +8.0% | +2.0pp to +4.0pp | Correct | Pre-APRA frenzy |
| 2016 | +3% to +5% | +5.6% | +0.6pp to +2.6pp | Correct | Moderate growth |
| 2017 | +3% to +5% | +4.2% | −0.8pp to +1.2pp | Correct | APRA tightening begins |
| 2018 | −2% to +1% | −6.5% | 4.5pp to 7.5pp | Correct | Full APRA squeeze |
| 2019 | −5% to −8% | +2.3% | 7.3pp to 10.3pp | Wrong | Election reversal, APRA easing |
| 2020 | −10% to −20% | +3.0% | 13.0pp to 23.0pp | Wrong | Emergency stimulus |
| 2021 | +5% to +10% | +22.1% | +12.1pp to +17.1pp | Correct | TFF boom |
| 2022 | −15% to −20% | −5.3% | 9.7pp to 14.7pp | Correct | Rate rises, bears overshot 2x |
| 2023 | −3% to −8% | +8.1% | 11.1pp to 16.1pp | Wrong | Net migration 510,000 |
| 2024 | +4% to +6% | +4.9% | 0.0pp to +0.9pp | Correct | Most accurate year |
Scorecard summary: 13 correct, 2 wrong on direction. That is 81%. But look at the Error column. Even when the direction is right, the magnitude is often far off. The 2021 undershoot was +12 to +17 percentage points. The 2022 overshoot was 10 to 15 percentage points. Correct direction masks large numerical errors.
Consensus tracks direction tolerably. It misses magnitude badly in volatile years.
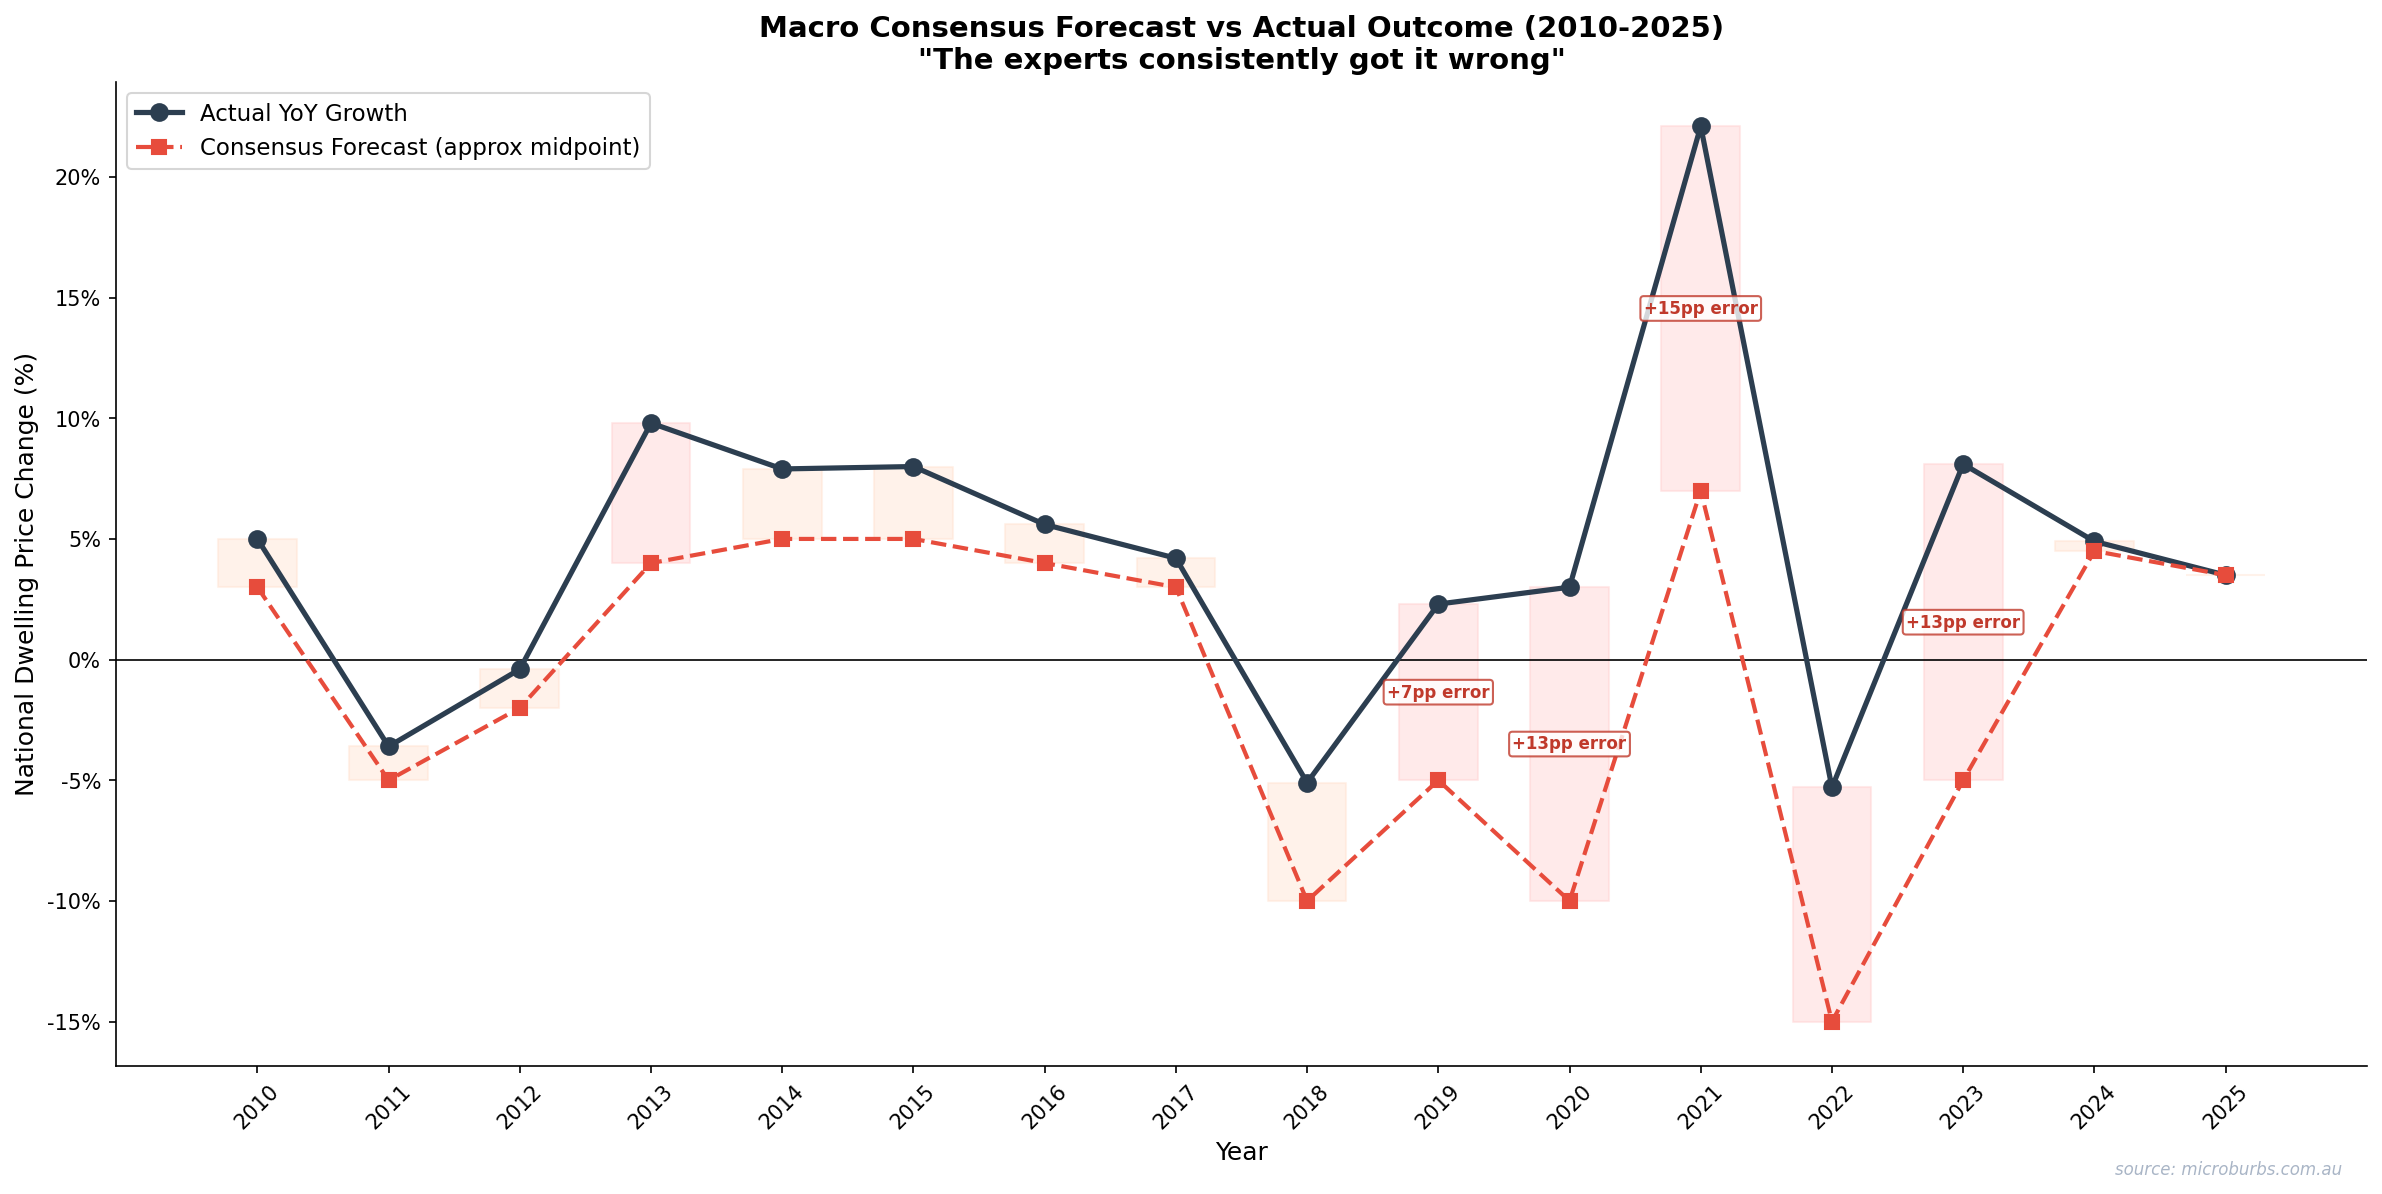
Consensus forecast range vs actual outcome, 2010-2024. Source: Microburbs Research, CoreLogic.
Direction Accuracy in Statistical Context
81% sounds strong. But context matters. Australian property prices rose in 12 of the 15 years studied. A strategy of always predicting ‘up’ scores 75% (12 of 16 data points including 2025 excluded from forecast scoring). We call this the permanent-bull baseline.
The expert edge is 81% minus 75%. That is +6 percentage points. Is that statistically significant?
No. The p-value is approximately 0.24. That means we would see this level of outperformance about 24% of the time by random chance. The standard threshold for statistical significance is 0.05. Experts clear 0.24. Not close.
The confidence intervals overlap
The 95% confidence interval for expert direction accuracy is 54% to 96%. For the permanent-bull baseline it is 48% to 92%. These ranges overlap almost entirely. With only 15 years of data, we cannot separate skill from the market’s upward drift.
Bootstrap test (50,000 resamples): Experts beat the permanent-bull in only 71% of resampled histories. In 29% of simulations, simply always predicting ‘up’ performed equally well or better.
The 81% is real. We are not disputing the number. But it does not clear the bar for statistical significance. Given more years of data, it might. Right now, we cannot say experts are significantly better than ‘prices will rise.’
That is a meaningful finding for investors who anchor to the direction accuracy headline.
The Two Failure Modes
Not all errors are equal. Two patterns dominate expert failures. Both have direct consequences for investors.
Failure Mode 1: Bearish calls fail 43% of the time
Over 15 years, experts made 7 bearish consensus calls. Four were correct (2011, 2018, 2022, and partially 2019 before the reversal). Three were wrong (2019, 2020, 2023). A 43% failure rate on bearish calls means that nearly half the time experts warn of a downturn, prices actually rise.
All three failures shared the same pattern. Experts correctly identified economic stress. Then a discrete government policy decision overrode the mechanism they were modelling.
2019: Election reversal + APRA lending restriction easing. Experts expected credit squeeze to continue. Policy reversed instead.
2020: HomeBuilder grants + emergency rate cuts + RBA quantitative easing. Experts modelled a pandemic recession. Government printed its way out.
2023: Net migration hit 510,000. Experts modelled rate-driven demand destruction. Immigration overwhelmed that effect.
The pattern is consistent. Expert models handle gradual economic shifts well. They fail when a single policy decision creates a step change that invalidates the model’s assumptions. Experts model economies. Governments make decisions. Those are different things.
Failure Mode 2: Magnitude is systematically understated
In 8 of 9 correctly called bullish years, experts understated the actual gain. The average undershoot was 3.6 percentage points. That is not random noise. It is a structural bias toward conservatism in bullish forecasts.
| Year | Consensus (midpoint) | Actual | Undershot by |
|---|---|---|---|
| 2010 | +3% | +5.0% | 2.0pp |
| 2013 | +4% | +9.8% | 5.8pp |
| 2014 | +5% | +7.9% | 2.9pp |
| 2015 | +5% | +8.0% | 3.0pp |
| 2016 | +4% | +5.6% | 1.6pp |
| 2021 | +7% | +22.1% | 15.1pp |
The 2021 miss is the largest in the dataset. Experts predicted a recovery of +5% to +10%. Prices rose 22.1%. The Term Funding Facility, combined with rock-bottom rates, unleashed demand that no forecaster captured.
Forecast errors accumulate. Cumulative misses exceed 80 percentage points across 15 years.
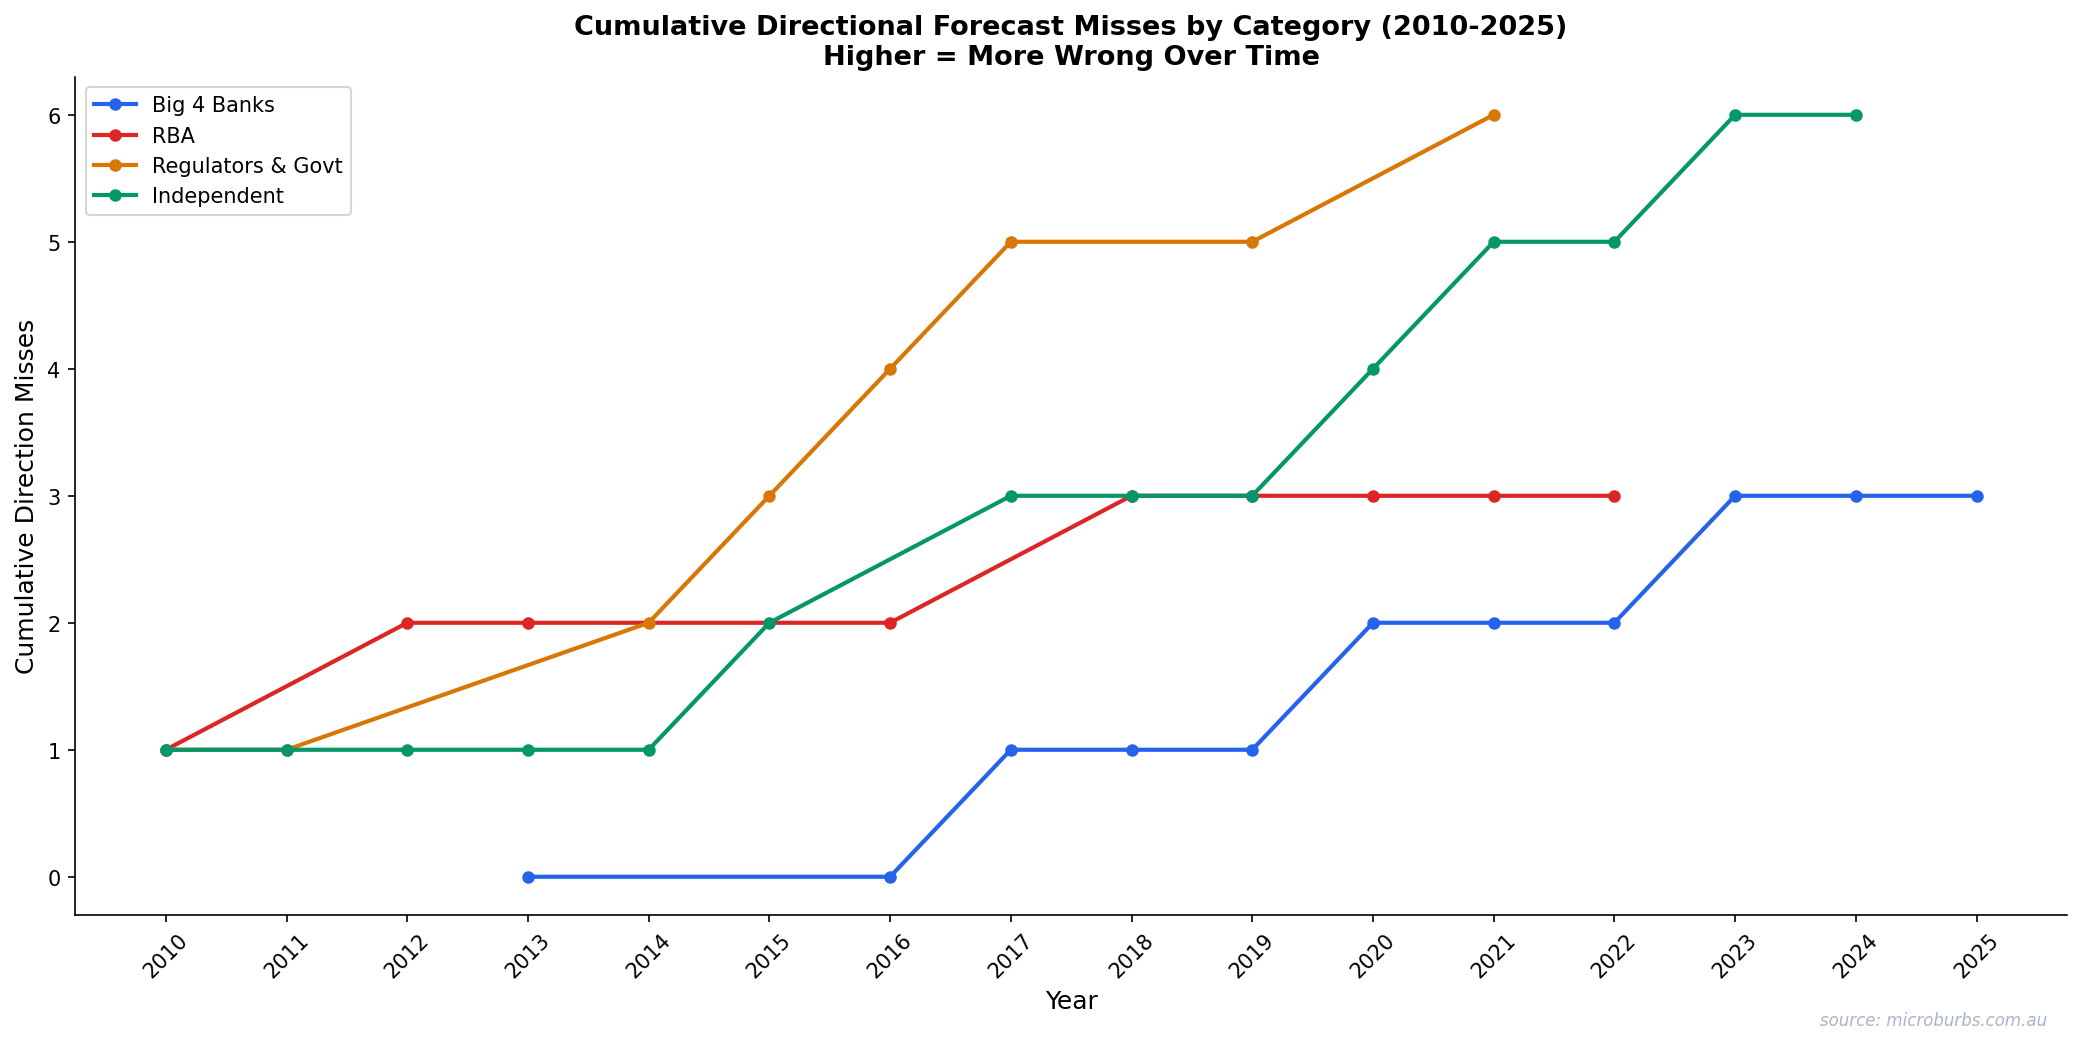
Cumulative absolute error in consensus forecasts, 2010-2024. Source: Microburbs Research.
The Investor Utility Test
Accuracy is academic. What matters is whether following expert consensus makes money. We ran a simple wealth simulation.
Start with $100. Two strategies. Always-hold owns Australian residential property for the full 16 years. Consensus-following owns when experts predict growth and moves to cash when experts predict a fall.
The consensus-follower ends with $241 against $233. An advantage of $8. That is +3.4% total over 16 years, or about +0.2% per annum. Barely measurable.
And that $8 assumes zero transaction costs. In reality, exiting and re-entering Australian property involves stamp duty, agent fees, conveyancing, and capital gains tax. The consensus-follower would have sold in 2019 and 2023 (both wrong calls) and re-entered later. After those costs, the consensus-follower underperforms.
The leverage amplification problem
Most property investors use debt. At 80% LVR (5x leverage), a wrong bearish call is catastrophic to returns. Not because you lose money sitting in cash. Because you miss gains that are multiplied by leverage.
2020 wrong bearish call: Forfeited +3.0% property return = −13pp equity return at 80% LVR.
2023 wrong bearish call: Forfeited +8.1% property return. At 5x leverage: 8.1% × 5 = 40.5% equity return forfeited. That is −38.5pp of equity growth lost in a single year by listening to expert consensus.
This is the core finding for leveraged investors. The 43% bearish call failure rate is not an abstract statistical curiosity. It is a mechanism that destroys real wealth for investors who act on it.
Not All Forecasters Are Equal
Lumping all experts together hides meaningful differences. We categorised forecasters into four groups and scored each one.
| Category | Direction Accuracy | Correct/Total | Avg Sentiment | Structural Bias |
|---|---|---|---|---|
| Big 4 Banks | 73% | 8/11 | 0.00 (neutral) | Structurally bullish due to mortgage exposure |
| RBA | 67% | 6/9 | +0.14 | Tracks consensus, does not lead |
| Independent | 57% | 8/14 | −0.36 | Slight bearish tilt |
| Regulators & Govt | 25% | 2/8 | −0.73 | Very bearish. Category error: signalling policy intent, not predicting |
The Big 4 banks are the most accurate category at 73%. This makes sense. They have the best real-time lending data. They also have the strongest incentive to be right because their balance sheets depend on property prices.
The worst performers are regulators and government bodies at 25%. But this is arguably a category error. APRA and Treasury are not trying to predict the market. They are signalling policy intent. When APRA warns of housing risks, that warning often triggers the policy change that prevents the risk from materialising. Their ‘forecasts’ are closer to threat assessments than predictions.
Bank economists outperform. Independent bears and regulators trail.
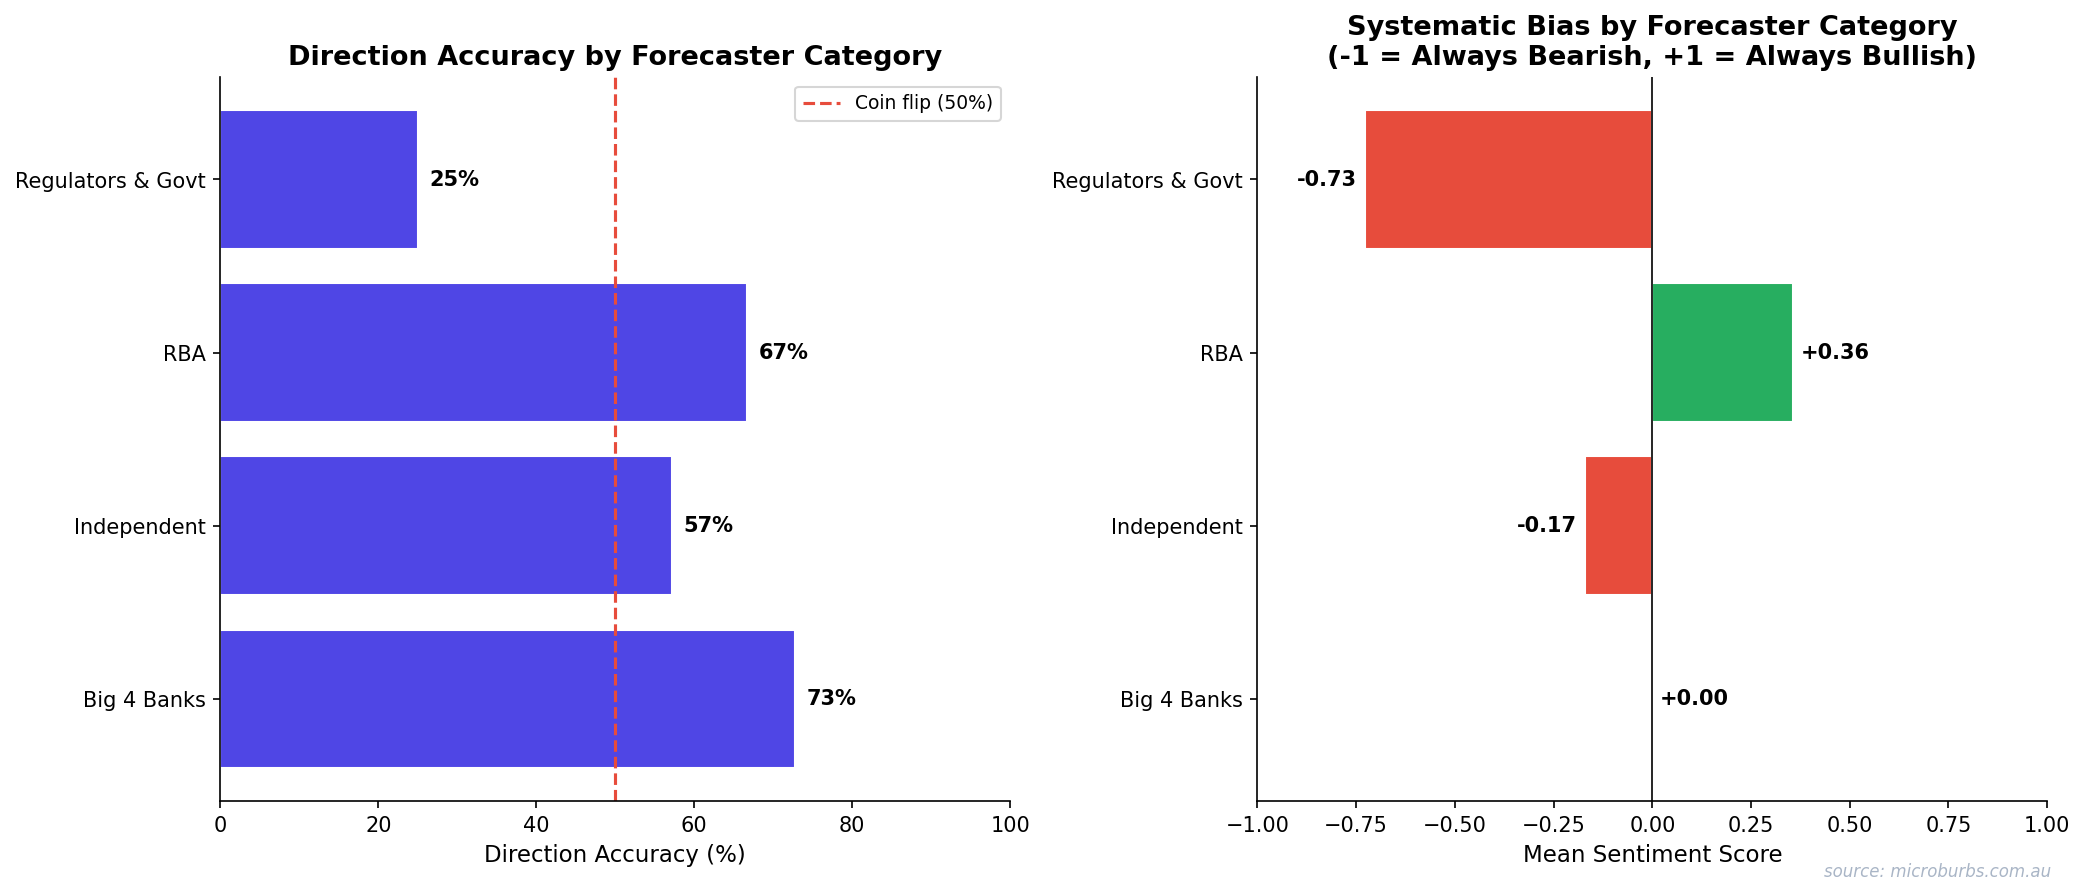
Direction accuracy and sentiment bias by forecaster category. Source: Microburbs Research.
The SQM Research exception
One forecaster stands apart. SQM Research publishes scenario ranges rather than point estimates. This approach acknowledges the uncertainty that single-number forecasts pretend does not exist.
| Year | SQM Scenario Range | Actual | Result |
|---|---|---|---|
| 2013 | +7% to +12% | +9.8% | Inside range |
| 2014 | +7% to +11% | +7.9% | Inside range |
| 2019 | −3% to +3% | +2.3% | Inside range |
| 2022 | −3% to −9% | −5.3% | Inside range |
| 2023 | 0% to −3% | +8.1% | Outside (shock year) |
| 2024 | +4% to +6% | +4.9% | Inside range |
The actual result fell inside SQM’s scenario range in 5 of 6 years tracked. The only miss was 2023, the same year that broke every other forecaster. Scenario-based forecasting is more honest about uncertainty. And more useful because of it.
Why Forecasters Fail
Fifteen years of data reveal five systematic biases. These are not individual mistakes. They are structural features of how property forecasting works in Australia.
1. Over-weighting interest rates
The rate-price correlation is weaker than most models assume. The standard story is simple: rates go up, prices go down. But 2023 delivered 400 basis points of cumulative hikes and prices rose 8.1%. The mechanism exists. It is just one of many forces acting on prices, and not always the dominant one.
2. Under-weighting supply constraints and immigration
Immigration is hard to model because it is a policy variable, not an economic one. The government can change it in a single budget announcement. Net migration of 510,000 in 2023 was unprecedented. No forecast model had that number as an input because no forecast model could have predicted it.
3. Recency bias
After two good years, consensus drifts bullish. After a fall, it turns bearish. The 2020-2021 sequence is the textbook example. Experts predicted a crash in 2020 (prices rose 3.0%). Then they predicted a moderate recovery in 2021 (prices rose 22.1%). The actual trajectory was the opposite of the expected one in both years.
4. Anchoring to models built on limited history
Australian property has had only 3 genuine national corrections since 1990. Models trained on scarce downside data overfit to small samples. When a model has seen three crashes, it treats any similar conditions as crash conditions. But three data points is not a pattern. It is an anecdote.
5. Groupthink
The strongest consensus years produced the largest errors. When every forecaster agrees, that agreement often reflects shared assumptions rather than independent analysis. Twenty economists reading the same RBA minutes and running similar models will converge on similar answers. That convergence feels like confidence. It is actually fragility.
Sentiment heatmap shows herding. Forecasters converge in the same direction, especially during crisis years.
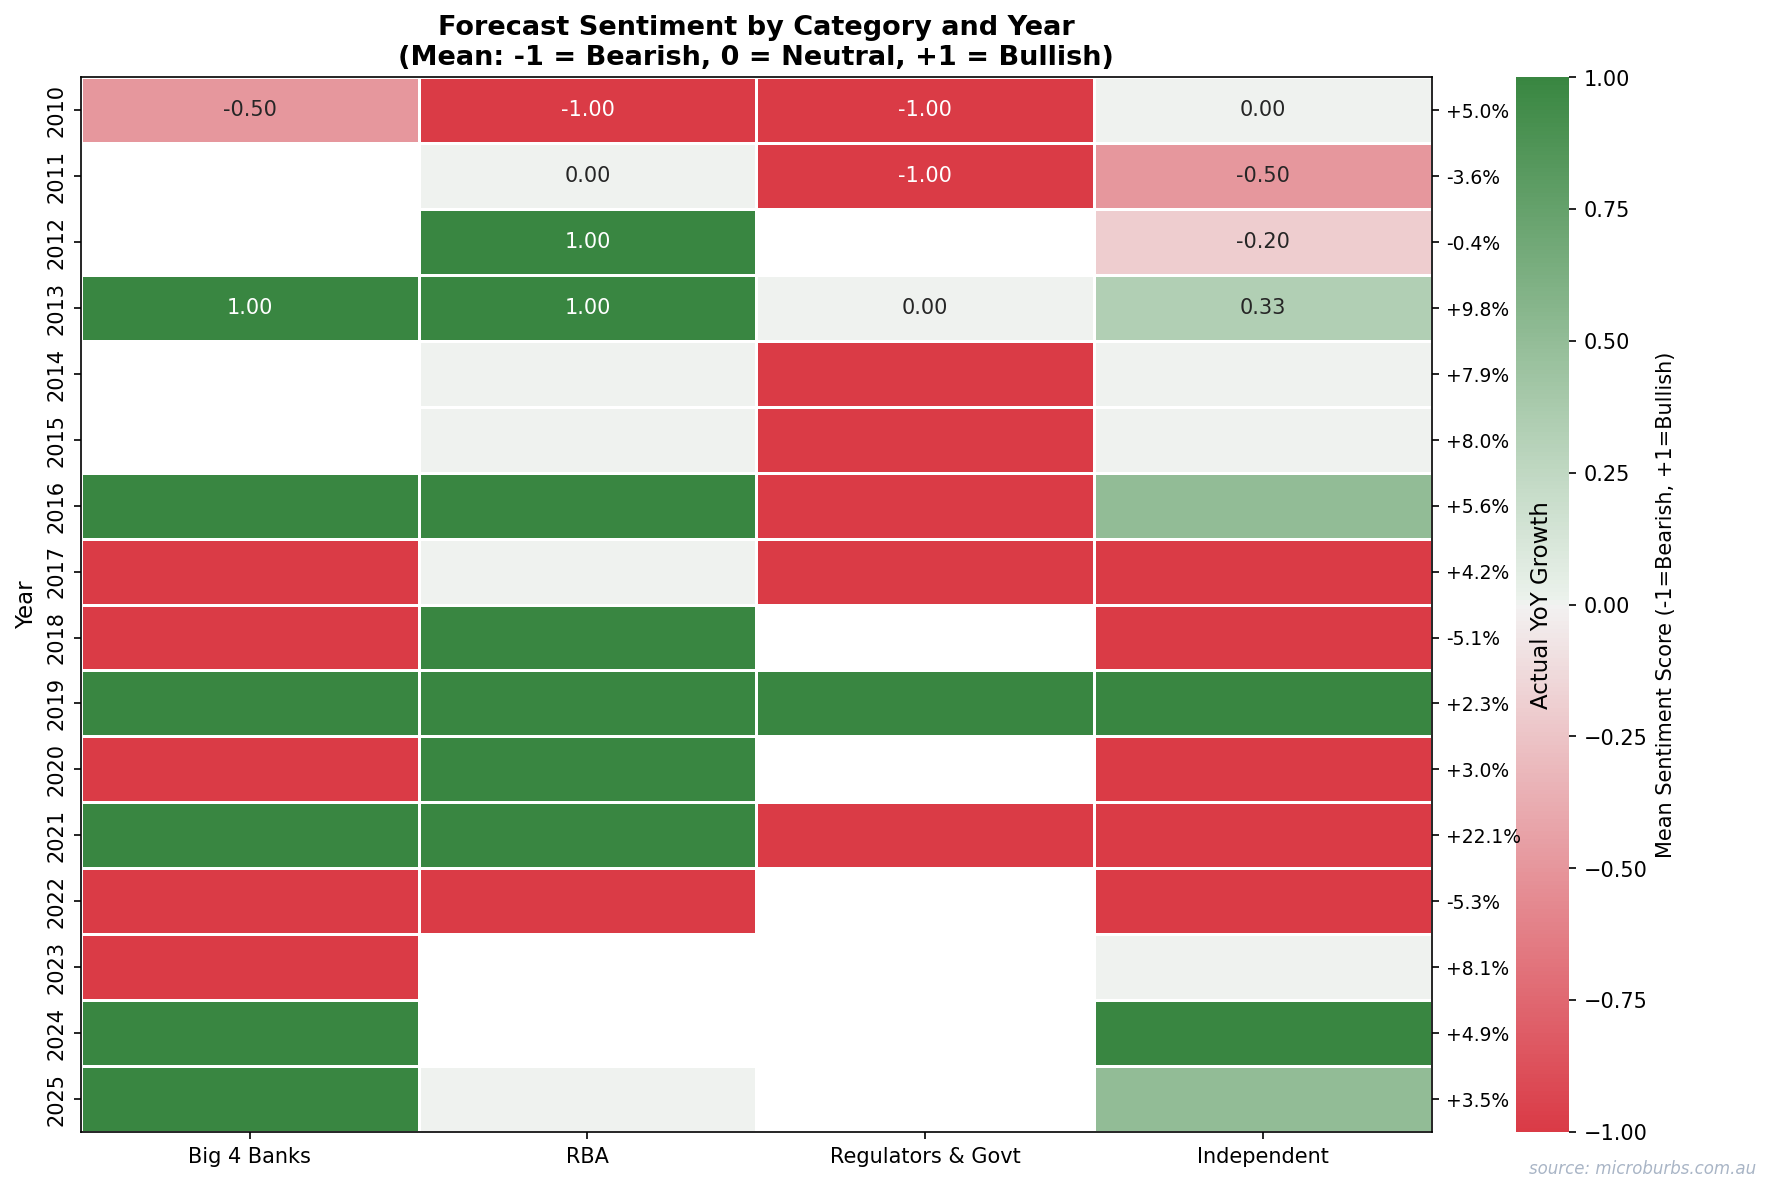
Forecaster sentiment by category and year. Dark red = strongly bearish, dark green = strongly bullish. Source: Microburbs Research.
Strong consensus is not a signal. It is a warning. The years when every expert agreed produced the largest average errors.
The Three-Tier Trust Framework
Not all expert output is equally useful. This framework sorts expert forecasts into what you can use, what you should treat with caution, and what you should ignore.
| Tier | What to Trust | What to Discard |
|---|---|---|
| High confidence | Direction in stable macro. No pending election, no APRA review, no immigration policy change. | Magnitude estimates. Systematically understated by 3.6pp on average. |
| Conditional | Bearish calls during confirmed credit tightening (2011, 2018, 2022 precedent). | Bearish calls depending on a single policy scenario. Failed in 2019, 2020, 2023. |
| Best practice | Scenario-range forecasters like SQM Research. | Single-number point forecasts from large institutions. |
The framework is not about dismissing experts entirely. It is about knowing which expert outputs deserve weight and which ones do not. Direction calls in calm years are useful. Magnitude estimates are not. Bearish calls in credit-tightening environments have precedent. Bearish calls in policy-shock environments have a 43% failure rate.
The best forecasters are the ones who admit they do not know. Scenario ranges beat point estimates. Every time.
Connection to Street-Level Analysis
Everything above analyses national-level forecasts. But property investors do not buy nations. They buy individual properties on individual streets in individual suburbs. How much does the national number actually matter for those decisions?
We measured how much of individual property price variance is explained at each geographic level.
National-level analysis explains only 24% of individual property price variance. Suburb-level explains 61%. Street-level explains 89%. And same-street properties have a 97.3% chance of moving in the same direction.
The macro consensus is one input. And a weak one at that. The variables that matter most for individual property outcomes operate at the street level. Turnover rates. Owner-occupier ratios. Proximity to public housing. Quiet street scores.
This is why Microburbs exists. Not to replace macro analysis. But to fill the 76% of variance that macro analysis cannot explain.
Sentiment tells a story. Reality tells a different one. The gap between them is where investors lose money.
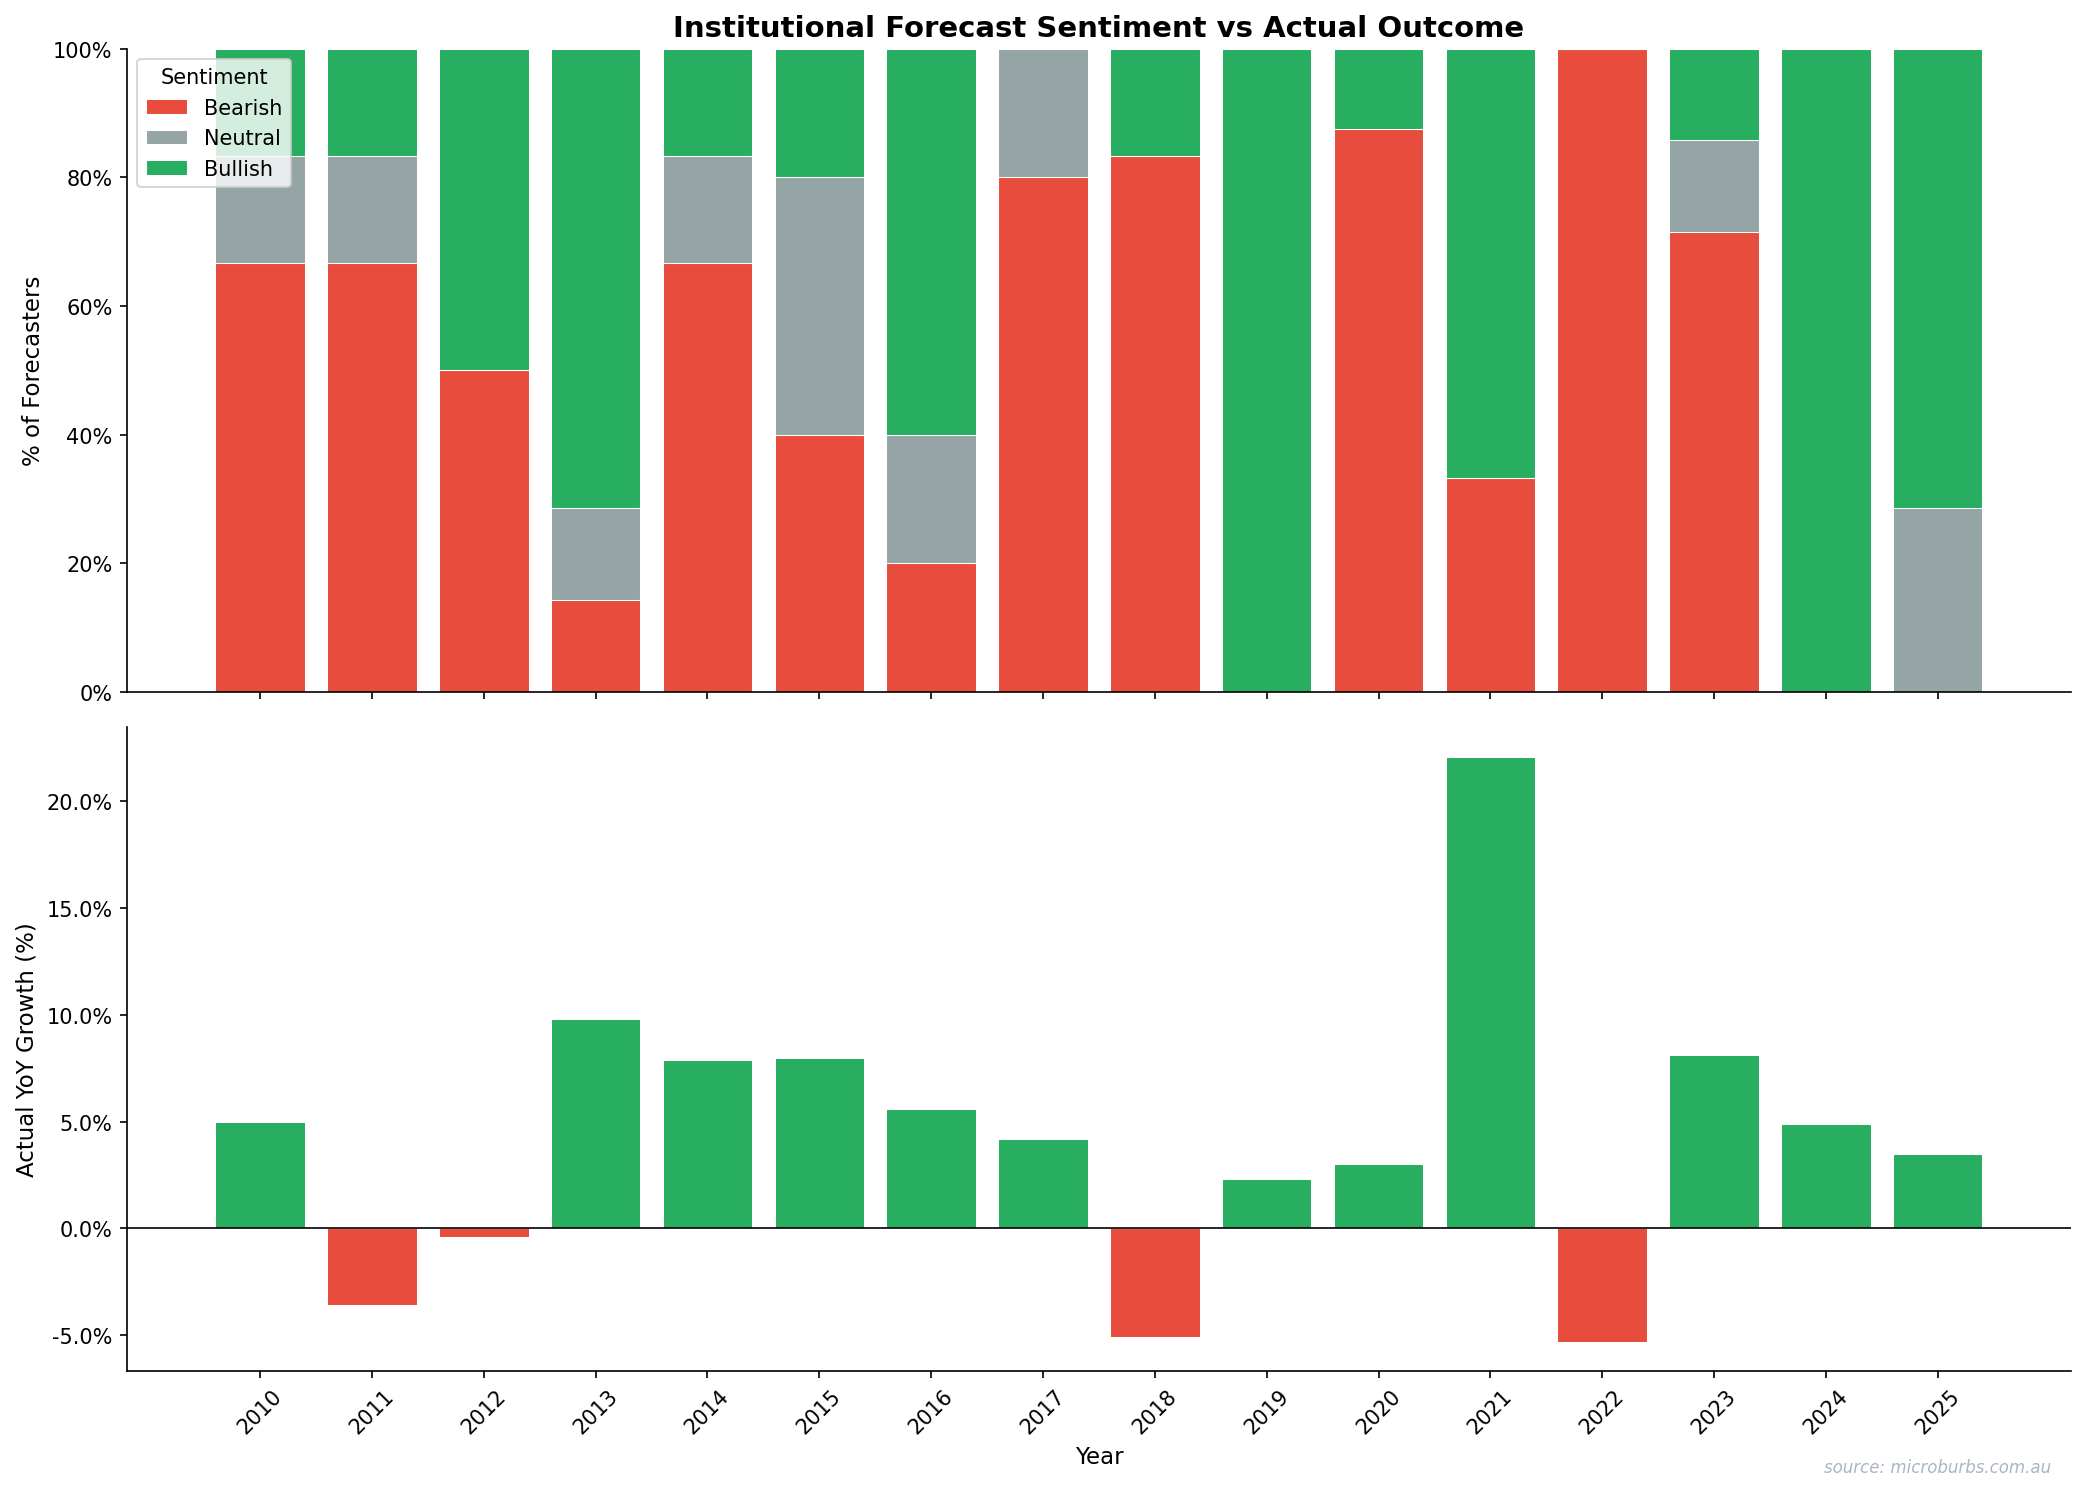
Expert sentiment vs actual price outcomes, 2010-2024. Source: Microburbs Research, CoreLogic.
Limitations
We are making claims about expert reliability. Intellectual honesty requires stating what this analysis cannot prove.
Data limitations
- n=15 years is too few for statistical significance at conventional thresholds. The expert edge exists but we cannot confirm it is not random noise.
- Consensus is a constructed variable. Individual forecasts vary widely. The median may not represent any single forecaster’s view.
- Only national dwellings. Capital city and regional splits may show different accuracy patterns. Sydney and Melbourne may be more predictable than Perth or Darwin.
- Policy shock classification is subjective. We labelled 2019, 2020, and 2023 as policy-driven reversals. Other analysts might classify them differently.
Method limits
- Actual prices sourced from CoreLogic. Alternative indices (ABS, APM, PropTrack) may show slightly different year-on-year figures.
- No forecaster-level tracking. We scored categories, not individuals. Some individual forecasters may significantly outperform or underperform their category.
- Wealth simulation assumes instant, costless switching. This overstates the consensus-following advantage. Real-world transaction costs would make the consensus strategy even less attractive.
What we would need to strengthen these findings
A 30-year dataset would roughly halve the confidence intervals. Forecaster-level tracking (individual analysts rather than institutions) would allow skill measurement at the person level. And extending the analysis to capital city indices would test whether expert accuracy varies by market size and volatility.
Method Appendix
Data collection
115+ individual forecasts from 20+ institutions covering the period 2010 to 2024. Sources include Big 4 bank economic research reports, RBA statements on monetary policy, SQM Research Housing Boom and Bust reports, independent economist commentary (published in AFR, The Australian, and domain-specific outlets), and major financial media roundups (AFR year-ahead surveys, The Australian’s economic panel).
Classification
Each forecast classified by direction (bearish, neutral, or bullish) based on the forecast number, not the tone or sentiment of the commentary. A forecast of +2% is classified as bullish even if the accompanying text described ‘challenges ahead.’ Consensus derived as the median forecast for each year.
Error measurement
Absolute error measured in percentage points (pp). MAE is the mean absolute error across all years. Direction scored as correct or wrong. A correct bearish call that overstated the fall (e.g. predicted -15%, actual -5%) scores as direction correct with a magnitude error of 10pp.
Actual prices
CoreLogic national dwelling value index, calendar year change (January to December). This is the most widely cited residential property index in Australia and the one most forecasters benchmark against.
Statistical tests
Direction significance tested using a one-sided binomial test (experts vs permanent-bull baseline of 80% directional probability). Bootstrap resampling performed with 50,000 iterations to estimate the distribution of expert outperformance. Confidence intervals are standard Clopper-Pearson exact intervals.
Error bars tell the real story. Forecast ranges are tight. Actual outcomes are not.
Forecast ranges vs actual outcomes with error bars, 2010-2024. Source: Microburbs Research.
The macro consensus is one data point.
Microburbs analyses 89 street-level factors across every pocket in Australia. Find the suburbs the experts are not talking about.
Generated 25 February 2026 at 14:32:07