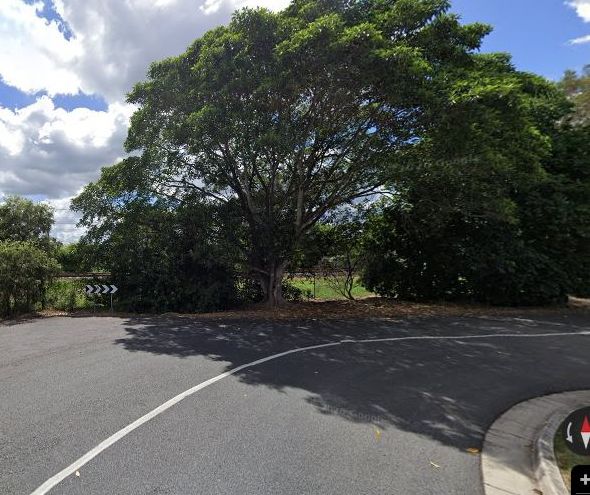
 Imagery: Google Street View
Microburbs estimates 22 Tongue St, East Ipswich QLD is worth about $589,068, with a likely range from $382,894 to $795,242, as at June 2026. It is listed for sale at $675,000.
The whole suburb in one page: medians, growth, supply and demand in the East Ipswich suburb report. Hunting more broadly? The AI Property Finder scans every listing in the country against your brief.
22 Tongue St and its neighbours from the air, the earliest aerial we hold next to the most recent. The gold line is this property's boundary and the white lines are today's lots, drawn on both, so any subdivision or new build between 2014 and 2026 stands out.
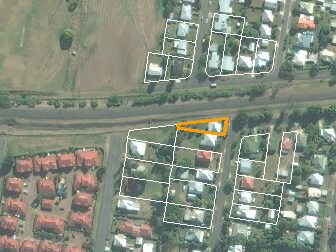
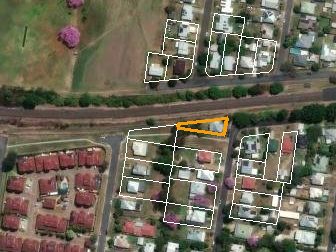
Imagery: Esri World Imagery Wayback. Boundaries: Microburbs cadastre, June 2026.
New roofs, pools, subdivisions and roads around a home show up here before they show up in the price. The full report maps what is being built nearby.
Listed in East Ipswich now. How each one compares to 22 Tongue St sits in the full report.
22 Tongue St sits on Tongue St in East Ipswich. The street's daily anchors are close: Ipswich East State School (0.43), ALDI (0.95), East Ipswich (0.5). Distances are measured from the property itself, not the suburb centre, as at June 2026.
Streets price differently within the same suburb. The full report scores this street's exact pocket.
Checks run on the address itself, not the suburb, June 2026.
The complete risk panel, with maps, is in the full report.
The $675,000 asking price sits about $85,932 above the $589,068 estimate. The gap is what the vendor hopes the house earns over the local evidence. Anchor on the estimate and make the agent justify the rest.
Before any offer, run the checks an offer deserves. The full report covers the risk panel, the title and the zoning for this address.
The typical Tongue St price, the East Ipswich median and the wider region, with this home's own sales, to June 2026.
From 2016 to 2026 the typical Tongue St price ran ahead of East Ipswich overall, by about 50 percentage points over the period. East Ipswich itself ran ahead of its wider region over the same years, by about 18 percentage points. The dots are this home's own recorded sales, with the current asking price marked. Why the Tongue St line matters: two streets in the same postcode can diverge 15 to 20 percentage points a year, and our top 10% of street picks beat the market by about 3% a year. The street research.
Thumbs up reads well, thumbs down is flagged. 8 read well here and 3 are flagged.
The median house here sells around $738,000 and rents for about $522 a week. Supply is tight at about 1 month of stock. Very few sales here make a loss. The flags worth asking about: house 10 year price growth, house 3 year price growth, percentage of renters.
The research behind these gauges. House 10 Year Price Growth: our suburb picks beat their own city by about 7.4% a year across a 12 year track record House 3 Year Price Growth: our suburb picks beat their own city by about 7.4% a year across a 12 year track record Percentage of Public Housing: a single public-housing neighbour within 10 metres costs about 4.2% a year of growth Percentage of Renters: owner-occupier suburbs grew about 221 percentage points more than renter suburbs over the 31 years to 2026
Every claim here traces to a published Microburbs study. The headline findings:
Real pages from the report, shown for the open sample. Yours would show every one of these for 22 Tongue St, East Ipswich QLD.
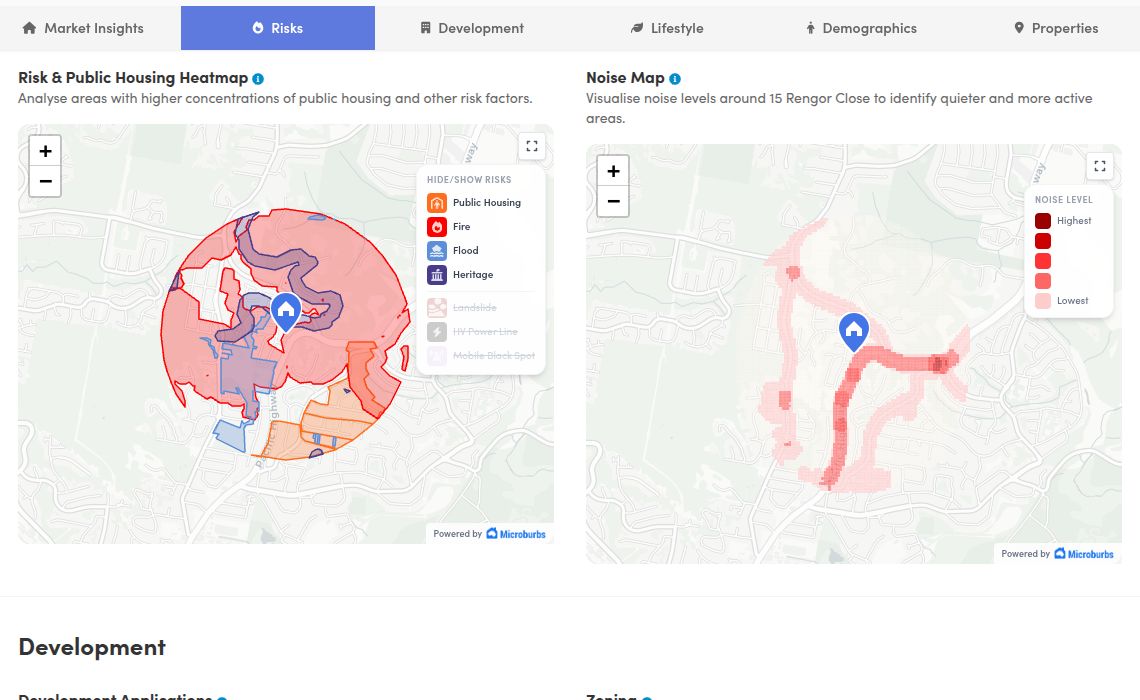 Shown for 15 Rengor Close, the open sample
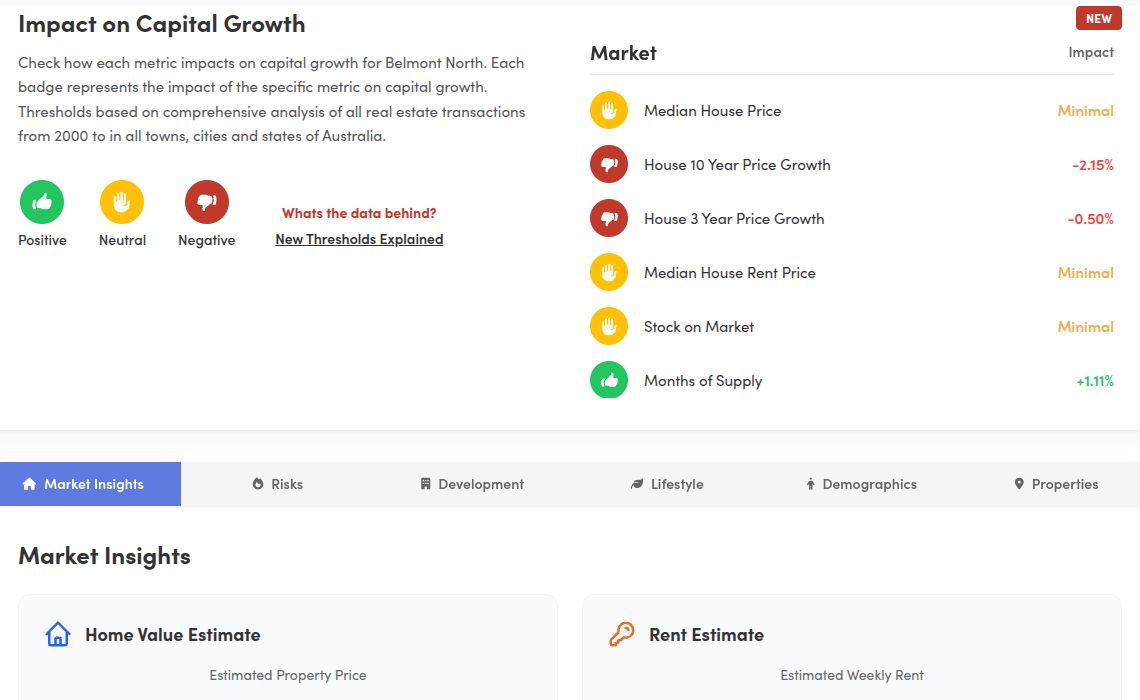 Shown for 15 Rengor Close, the open sample
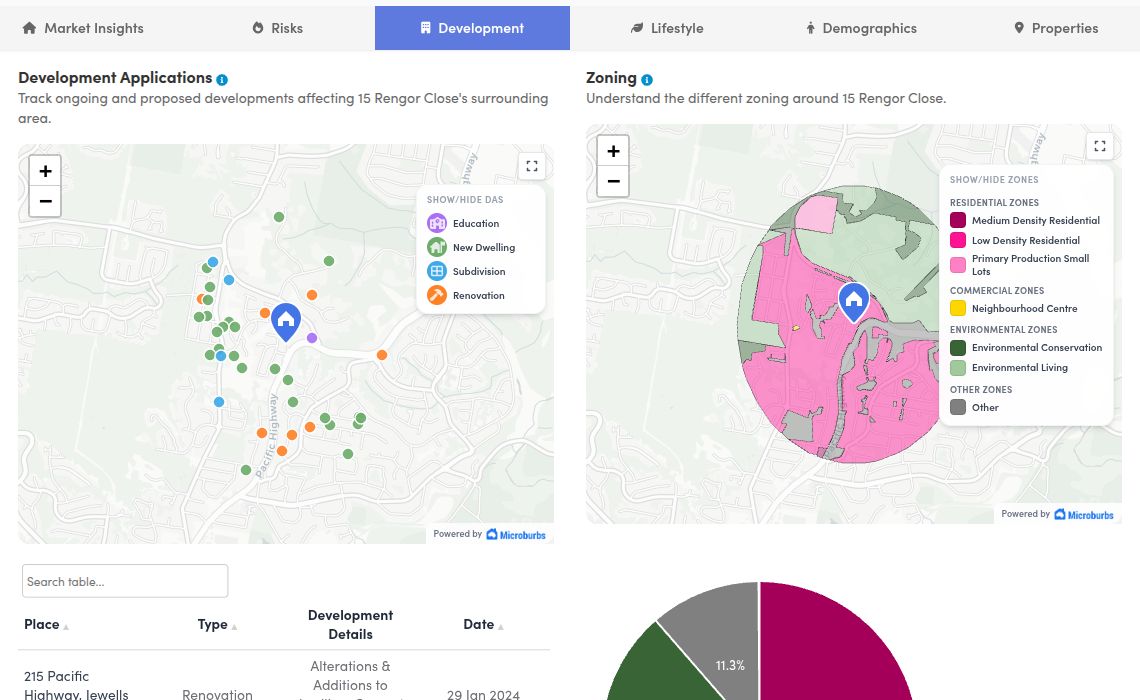 Shown for 15 Rengor Close, the open sample
Named places with distances from the front door, June 2026.
The risk panel, the title, the zoning, the schools and the pocket score for 22 Tongue St, East Ipswich QLD.
