Across 63,408 paired Australian house re-sales between 2002 and April 2026, the gap between a best-10-in-100 and worst-10-in-100 investor outcome on the deposit is around 44 percentage points per year. The new 2026 tax rules shift the typical investor return by 1 to 2 percentage points per year. Property choice has been roughly 20 times more important than the tax setting.
 By Luke Metcalfe · Founder, Microburbs Research
The 12 May 2026 Australian Federal Budget removes negative gearing for newly purchased established residential investments. The salary-offset benefit on rental losses ends from 1 July 2027 (with a transitional window for purchases between 7:30 pm AEST on 12 May 2026 and 30 June 2027). The 50 per cent capital gains tax discount on gains accruing from 1 July 2027 is replaced with inflation indexation of the cost base plus a 30 per cent minimum tax rate. We rebuilt 63,408 paired Australian house re-sales between 2002 and April 2026, computed what each property would have earned as an investment (under both old and new rules) and as a family home, and compared the dispersion of investor outcomes to the regime change itself. The dominant finding is the within-investor spread. The best-10-in-100 investor in the customer bracket ($400,000 to $800,000 in today's money) earned around 29 per cent per year on the deposit in real terms with the new rules applied. The worst-10-in-100 lost around 3 per cent per year. That spread is roughly 33 percentage points per year. The new tax rules trim the typical investor's return by 1.4 to 1.8 percentage points per year. Property choice has been roughly 20 times more important than the choice between old and new rules.
The 20x ratio is the practical takeaway. Spend the bulk of your time on what to buy, not on which tax structure to hold it in. Tax structure matters at the margin. Property choice dominates.
Three rules now apply to anyone buying an established residential investment property after 7:30 pm AEST on 12 May 2026:
Negative gearing is grandfathered for existing investors who purchased before 7:30 pm AEST on 12 May 2026. The capital gains tax change applies to gains accruing from 1 July 2027 regardless of when the property was bought. Newly built residential property keeps full negative gearing and lets the investor choose between the 50 per cent discount and the indexation method, whichever gives the lower tax bill.
We took every Australian repeat-sale house transaction in our holdings dataset between 2002 and April 2026. 63,408 unique paired sales spanning every state. And computed three returns on each property:
All three returns were adjusted for actual realised inflation over each property's specific hold period so the comparison is in today's dollars. Every cash carrying cost. Stamp duty, mortgage interest, agent fees on sale, property management for investors, maintenance, and state land tax for investors. Is calculated per property using the actual hold dates and prices. Capital losses on sale are clamped at zero (no tax refund on a losing sale). The investor scenario applies a 39 per cent marginal tax rate (the typical 37 per cent bracket plus the 2 per cent Medicare levy). Borrowing is held constant at 80 per cent of the purchase price across both the family home and investor scenarios so the loan amount is not what drives the comparison. The methodology was independently rebuilt by a second computation using a different tax framing. Both rebuilds agree on the direction and rough size of the comparative family-home premium, though their absolute return levels differ.
The comparison is fair only because you put the same mortgage and the same maintenance on both sides. The owner-occupier just doesn't pay land tax, property management, or capital gains tax. That is the entire wedge, and it is structural. It doesn't go away if interest rates fall or if the tax laws shift again.
Among the 63,408 paired Australian house re-sales 2002 to April 2026, the real after-cost after-tax annual return on deposit varied across an enormous range. For investors under the new rules in the customer bracket ($400,000 to $800,000 in today's money), the bottom 10 per cent lost around 3 per cent per year while the top 10 per cent earned around 29 per cent per year on the deposit. A 33 percentage-point spread. Across all 63,408 records the spread runs even wider (P10 around -13 per cent, P90 around +31 per cent, a 44-point spread) because the higher-price end of the market contains more extreme negative tails. Picking the right property at the right time mattered around 20 times more than the choice between old and new tax rules.
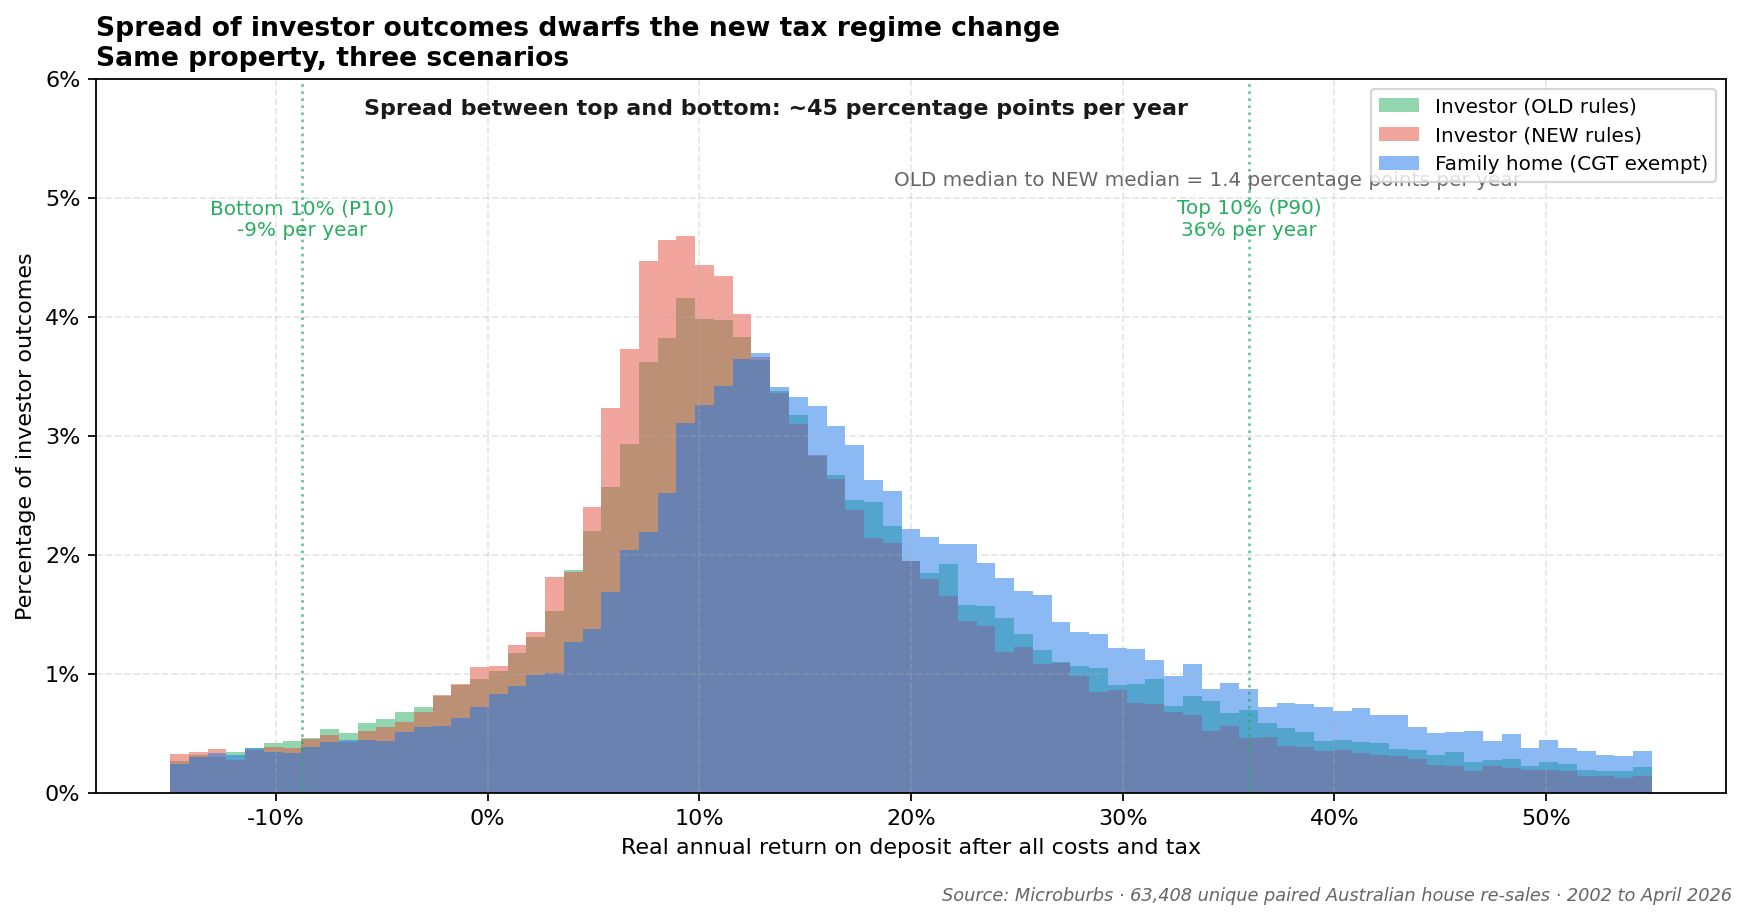
Compared to that spread, the regime shift and the family-home wedge are both second-order effects. Numerically the levered medians look like this:
| Owner type | Median real return per year on deposit (2002 to April 2026) | Difference vs family home |
|---|---|---|
| Family home (owner-occupier) | 16.0% | baseline |
| Investor under old rules | 12.5% | −3.5 pp/yr |
| Investor under new rules | 11.1% | −4.9 pp/yr |
The roughly 4 to 5 percentage-point family-home premium on deposit is real and structural (no CGT, no property management, no land tax). The 1.4 percentage-point gap between investor under old rules and investor under new rules is the tax-regime hit. Both are dwarfed by the 33 to 44 percentage-point spread within the investor cohort. A bottom-decile investor and a top-decile investor differ by far more than any tax wedge between any pair of owner types.
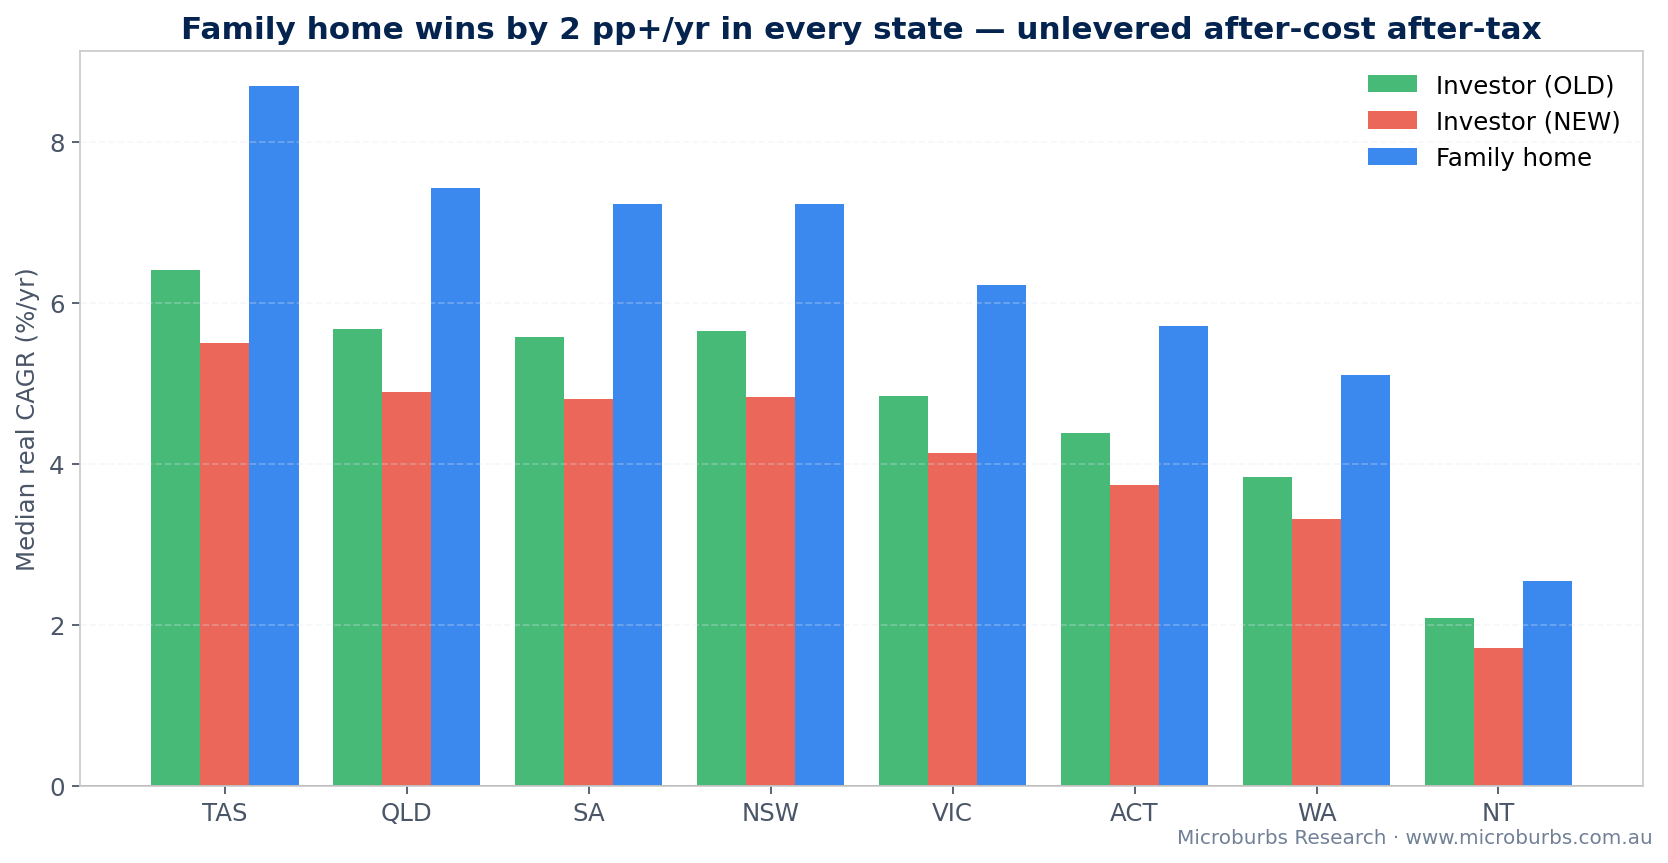
The premium varies by state but the dispersion finding holds in every state. Queensland and Western Australia show the largest family-home premium on the deposit (around 6 to 7 percentage points per year under the new rules). Victoria, Northern Territory and Australian Capital Territory show the smallest (3 to 4 percentage points). Even in the smallest-premium state, the within-investor dispersion is many times larger.
The customer bracket (around 52 per cent of the sample) is where most Microburbs customers buy. The within-bracket spread is huge: in $400,000 to $600,000 the best 10 per cent earned around 32 per cent per year on the deposit, the middle 12 per cent, the worst 10 per cent broke even. In $600,000 to $800,000 the spread is from -10 per cent (bottom 10) through +9 per cent (middle) to +25 per cent (top 10).
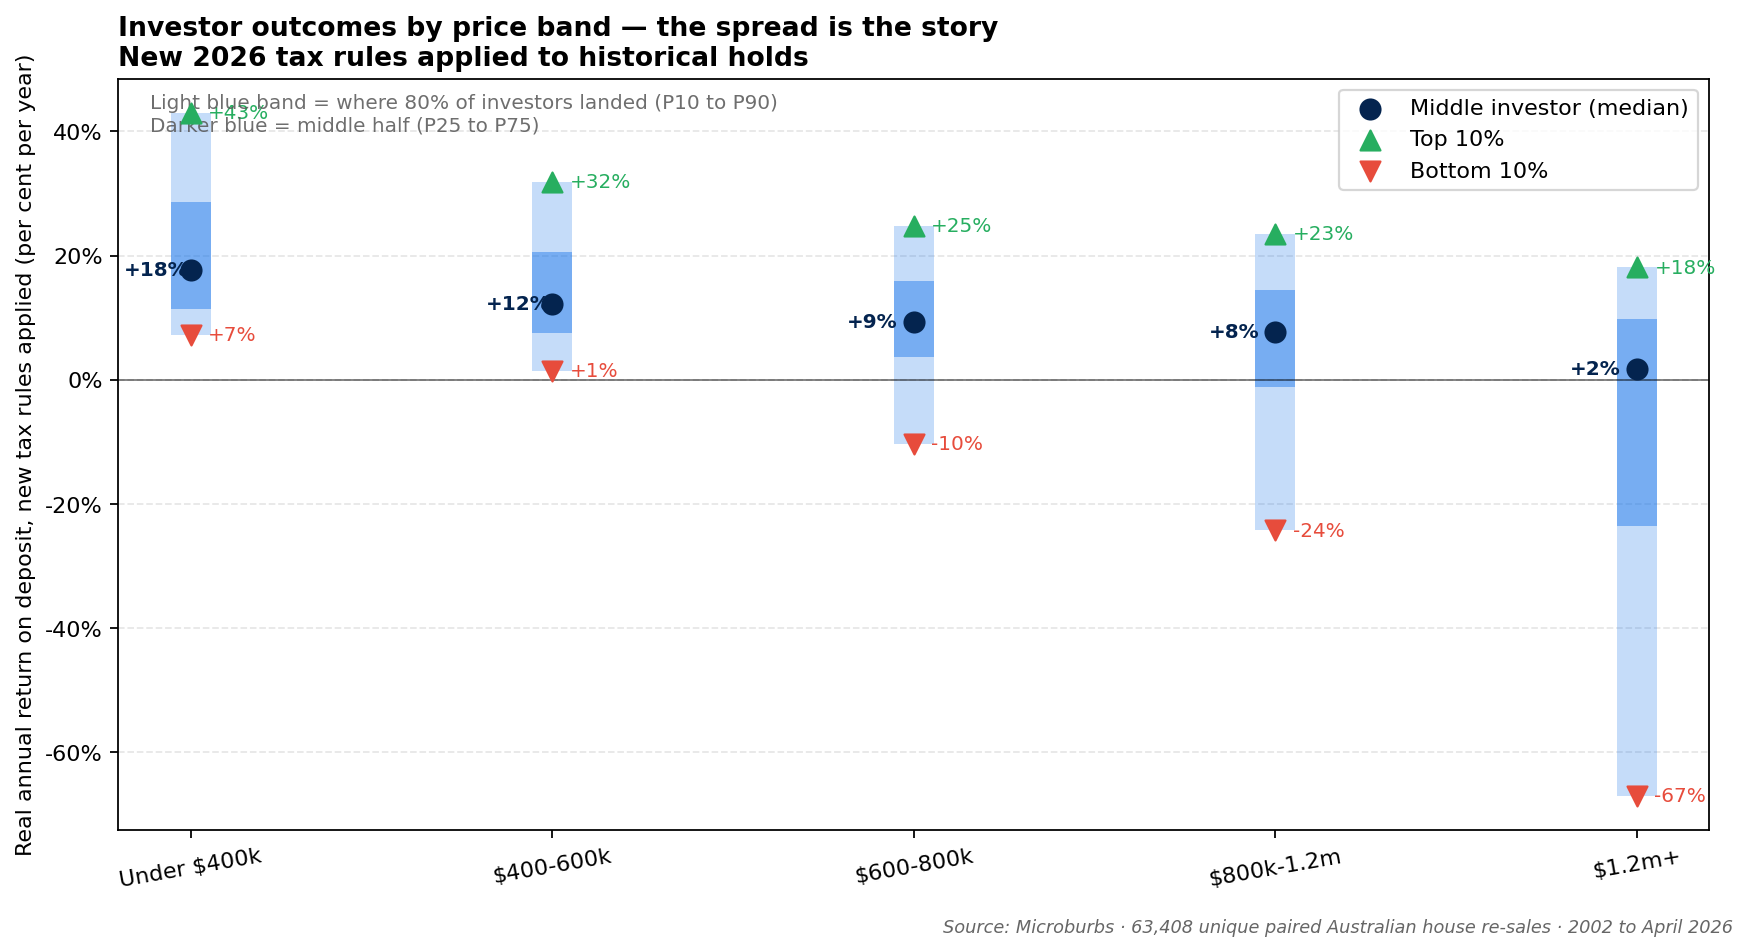
Three structural costs eat into the middle investor's return, and they bite harder the further up the price ladder you go: state land tax rises faster than the price (and only investors pay it, not owner-occupiers), the capital gains tax bill grows with the size of the gain, and property management fees skim a slice of the rent for the whole hold. None of these apply to the family home. But the spread within each bracket is still wide. Even in the $1.2m+ bracket, the best 10 per cent of investors earned around 18 per cent per year on the deposit under the new rules.
To check whether the top-tier story is a one-off boom-period artefact, we sliced the customer-bracket cohort by year of sale and by year of purchase.
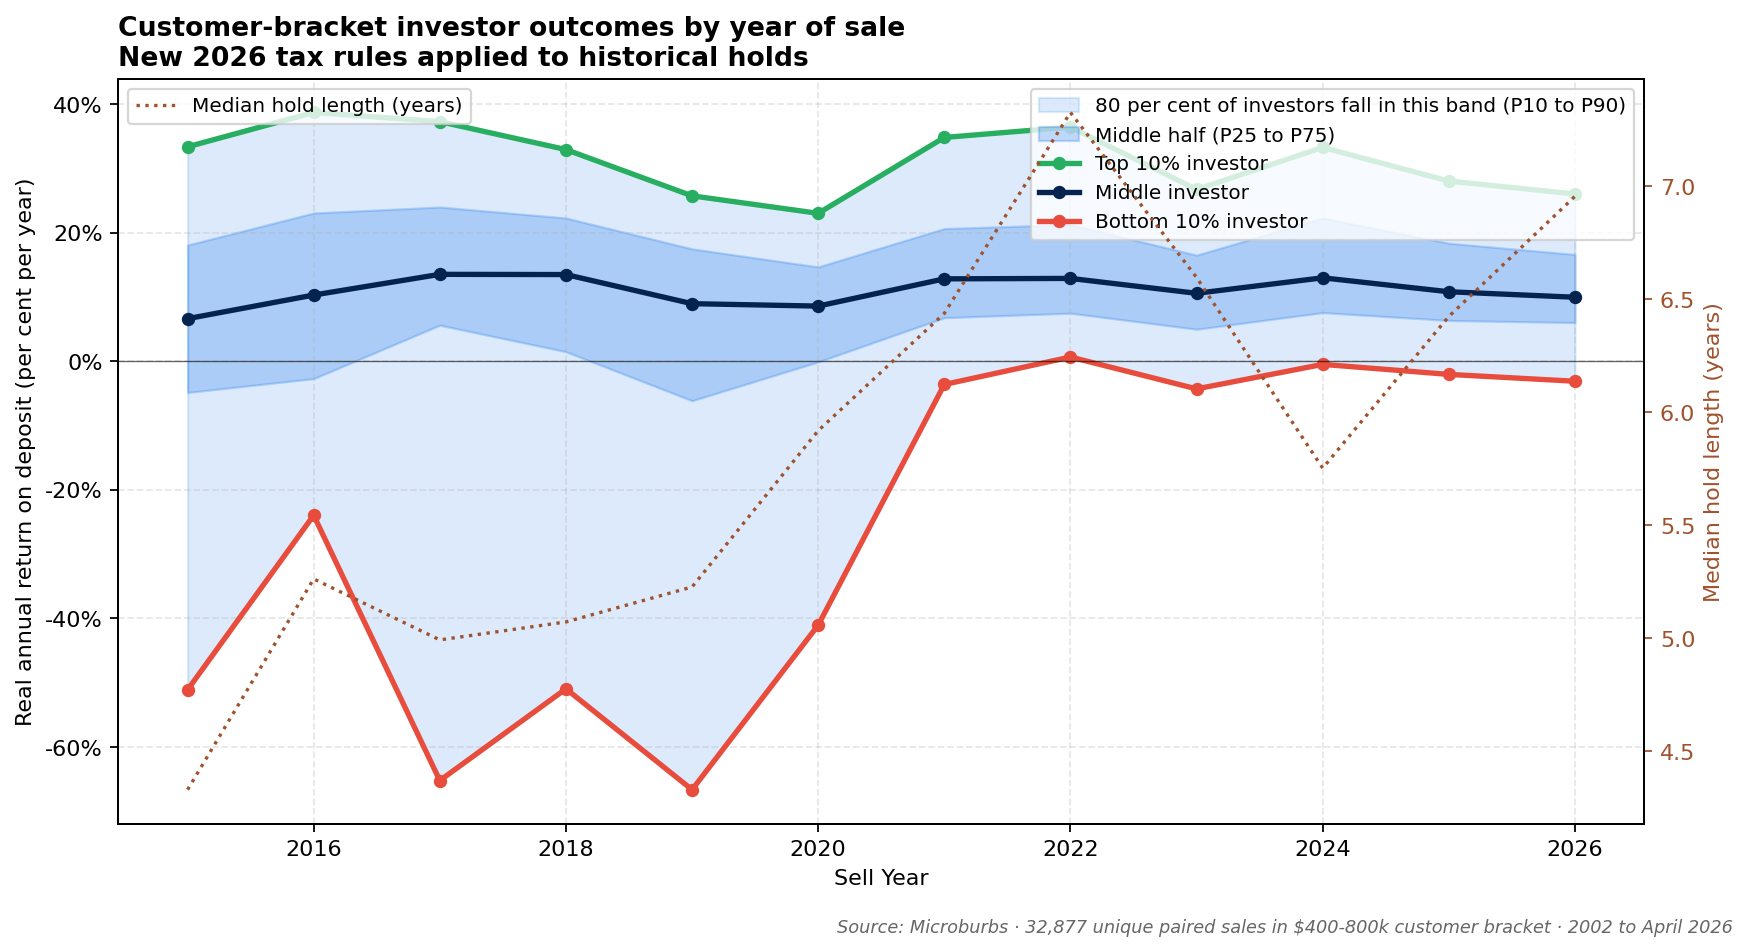
For every year between 2015 and 2026 in which the sample has at least 50 customer-bracket sales, the best 10 in 100 investors earned between 22 and 38 per cent per year on their deposit in today's dollars with the new rules applied. The middle investor sat between 7 and 14 per cent per year. The top-tier outcome is not a single-year boom.
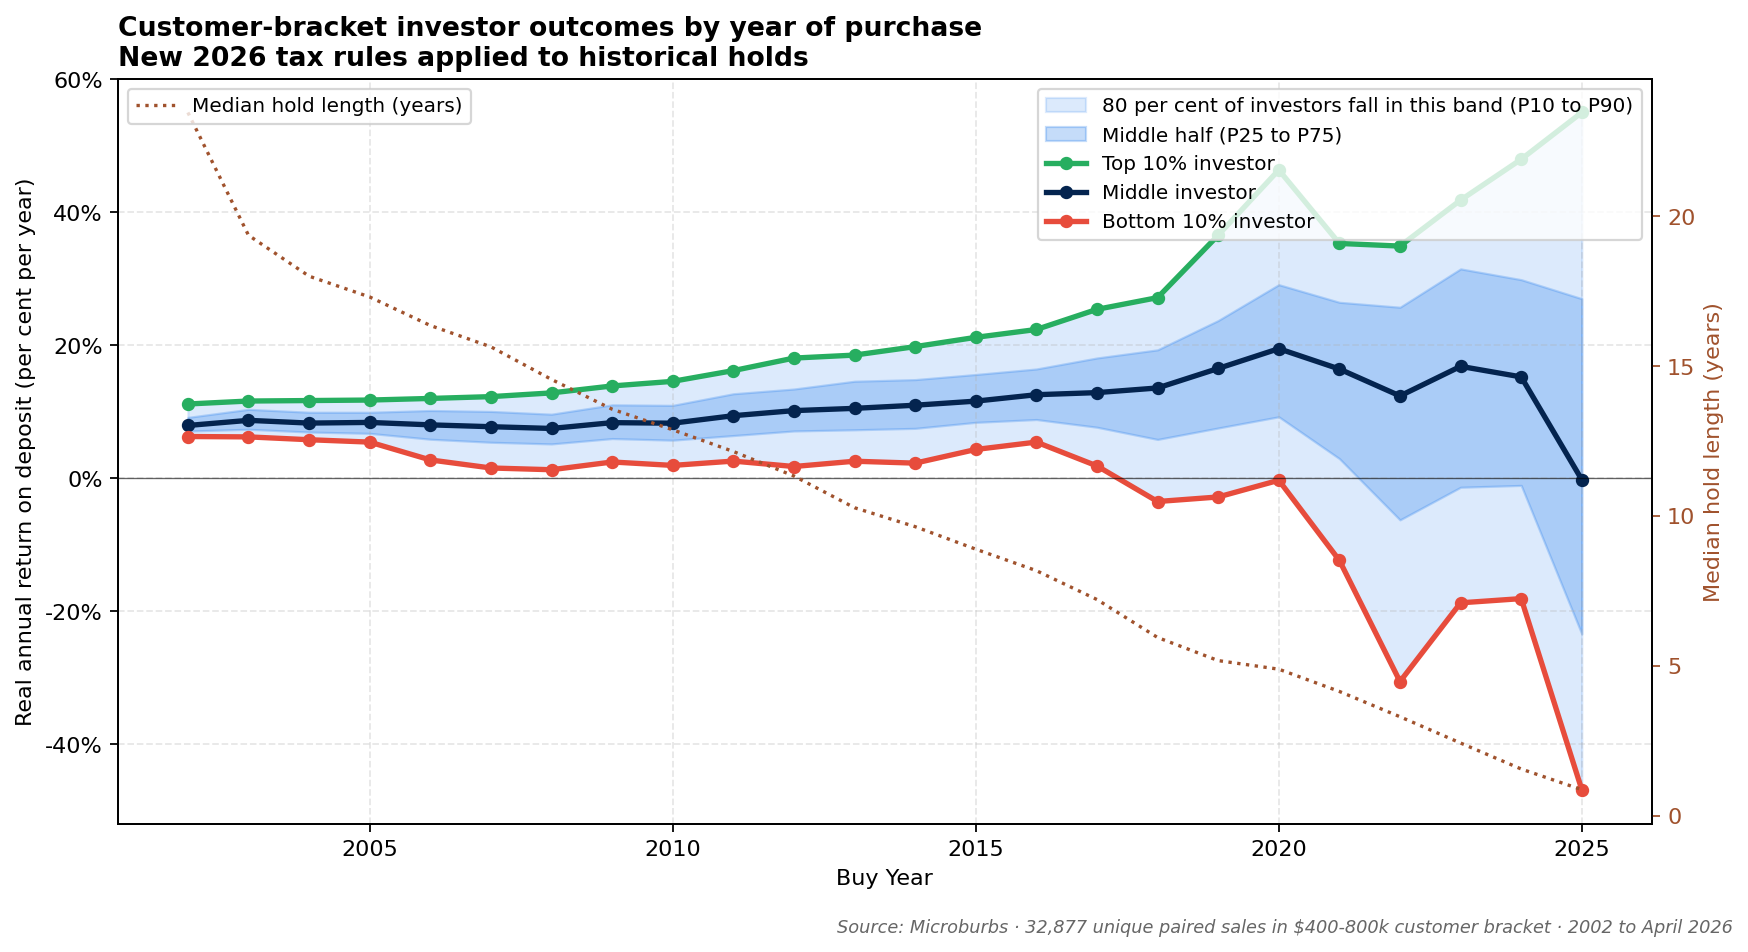
Splitting by year of purchase tells a more nuanced story. Top-decile investors who bought between 2003 and 2010 and held for 15 to 19 years earned a steady 9 to 13 per cent per year on the deposit. Top-decile investors who bought between 2018 and 2024 and held for 1 to 3 years earned 30 to 55 per cent per year on the deposit because of the post-2020 price acceleration. The long-hold numbers are the more reliable expectation for someone buying today and holding for a decade.
Three customer-bracket suburbs with the largest count of paired sales. Picked by sample size, not by outcome.
| Suburb | State | n in band | Bottom-10 inv NEW | Middle inv NEW | Top-10 inv NEW | Family home premium (NEW) |
|---|---|---|---|---|---|---|
| Pakenham | VIC | 221 | -1.5%/yr | +10.7%/yr | +27.5%/yr | +3.8 pp/yr |
| Baldivis | WA | 182 | +5.2%/yr | +19.4%/yr | +38.8%/yr | +10.2 pp/yr |
| Kirwan | QLD | 153 | +2.8%/yr | +13.4%/yr | +28.0%/yr | +5.1 pp/yr |
The same pattern repeats across cities and across market types. Within every suburb the spread between top and bottom outcomes dwarfs the gap between owner types or the gap between old and new rules.
The numbers above are returns on the 20 per cent deposit. Adding the same 80 per cent loan to both scenarios does not change the direction. The within-cohort spread expands proportionally as leverage increases the variance of outcomes, but the relative ranking of owner types is unchanged.
Our 63,408-property sample covers every state, every year from 2002 to April 2026, and every Significant Urban Area in Australia that produced enough paired re-sales to compute a stable median. The conclusion is the same in every state and in every hold-period bucket we tested (1-3 years, 3-7 years, 7-12 years, 12+ years). The smallest family-home premium in any state slice is around 3 percentage points per year on the deposit. The largest is around 7. Within every slice the dispersion is many times larger than the slice-to-slice variation.
Yes, and this is the most subtle part of the new rules. At 4 per cent inflation, indexing the cost base over a 10-year hold absorbs most of the taxable gain. At 2 per cent inflation, the indexed gain is much larger than the discounted gain under the old rules. Our sensitivity work shows the median property is roughly neutral on CGT under indexation versus the old 50 per cent discount over typical 5 to 10 year holds. The investor's pain in the new rules is mostly the loss of negative gearing during the hold, not the tax change on sale.
For historical retrospective purposes the strict new-regime treatment is: zero salary-offset on rental losses, full carry-forward to the eventual capital gain. The transitional window (12 May 2026 to 30 June 2027) only applies to actual contracts inside that window, and our historical sample is by definition outside it. A softer interpretation that grants every modelled hold one year of full negative gearing reduces the regime hit by around 0.4 to 0.7 percentage points per year. The dispersion finding survives either interpretation. The headline ratio of ~20x within-cohort spread to regime change does not depend on the choice.
The two computations use different tax framings (a flat blended rate versus progressive 2026 to 2027 brackets with explicit depreciation recapture) and produce different absolute return levels. Both still find the family-home premium in the same direction and the same low-single-digit range (around 2 percentage points per year before leverage), though they do not agree on the exact figure. Within each model, swapping the intermediate cost calculations one at a time moved the absolute levels by 1 to 2 percentage points per year but left the premium broadly stable. The wedge between owner-occupier and investor is structural. It follows from the absence of capital gains tax, property management and land tax on the owner-occupier side. And is mathematically insensitive to which tax framing you place on the investor.
Two independent rebuilds landing on the same direction and rough size for the comparative premium is genuinely useful, even when they differ on the absolute headline. The premium is a structural wedge, not an artefact of one set of tax assumptions.
The strongest fair criticism of the result is that we hold property prices constant under the new tax rules. In reality, fewer investors will be able to enter the market because they cannot fund the negative cash flow without the salary-offset. Investor-led suburbs. Where 35 to 50 per cent of monthly transactions come from investors. Will likely see softening prices as a result. That softening will compress the family-home premium in those specific suburbs (because the owner-occupier's nominal return also falls there) while widening it in homeowner-led suburbs where the demand pressure was already from family buyers.
This second-order effect does not change the within-investor dispersion finding. The spread across investors is dominated by suburb-level growth heterogeneity and the choice of property. It does affect the absolute size of the family-home premium in particular suburbs. We have measured the suburb-level investor share that drives the price-softening risk in a separate analysis. Integrating that with the cash-flow model in this paper is the next step.
The analysis is restricted to houses and excludes units. Around 39 per cent of Australian investor stock is units, which behave differently. Rental yield is higher, capital growth lower, and the depreciation profile is different. A unit-specific extension is on our roadmap.
The investor scenario uses a flat blended marginal rate of 39 per cent as the headline. Investors at very different income levels (below $45,000 or above $190,000 of personal income) will see different absolute outcomes. The 30 per cent capital gains tax floor binds only for the small share of investors earning less than $45,000. The independent rebuild used progressive brackets and reached the same comparative conclusion.
The owner-occupier scenario imputes a rental benefit equal to the actual rent that the same property received as an investment. This is a defensible choice for the median property but it implicitly assumes that cash-rent inflation and imputed-rent inflation move together over long holds.
The model does not include behavioural feedback. Fewer investor bids reducing prices in heavily investor-led suburbs, owner-occupier substitution into freed stock, or rental supply responses. Those are second-order effects on top of the structural tax wedge documented here.
The 2026 supplement (sales between December 2025 and April 2026) uses our current per-property rent estimate scaled down by a CPI-rents factor across the hold. For 2024 to 2026 short holds this is a reasonable approximation but not as accurate as fully vintaged rent series. A rent-vintaged rebuild is on the roadmap.
Three practical conclusions follow directly from the result.
First, spend the bulk of your decision time on what to buy, not on how to hold it. The within-investor spread of around 33 percentage points per year on the deposit in the customer bracket dwarfs the 1.5-percentage-point hit from the tax-rule change. Moving your purchase from a worst-decile property to a top-decile property within the same suburb is worth around 20 times what optimising the tax structure can do for you.
Second, the investor case is alive for people who pick well. The top 10 in 100 customer-bracket investors continue to earn very large real returns under the new rules. 22 to 38 per cent per year on the deposit, consistently across every recent year of sale. The new rules trim the typical investor's return by around 1.5 percentage points per year. They do not collapse the spread of outcomes.
Third, where the investor case is structurally strongest after the regime change. Newly built dwellings retain full negative gearing and a choice of CGT method, so the investor economics on new builds remain close to the old rules. Subdivisions that create new dwellings count as new builds. Inner-city suburbs with high rental yield relative to price keep their structural appeal but lose less in absolute terms because the within-suburb dispersion is what drives top-tier outcomes anywhere.
The premium is not uniform. In some regional and outer-metro houses, the same property would have paid the owner-occupier 12 to 14 percentage points per year more than an investor under the new rules. In a small handful of inner-Melbourne and inner-Canberra suburbs, the gap closes to under 2 percentage points per year. The ten largest and five smallest premiums in our sample, restricted to suburbs with at least twenty paired sales, sit below.
| Suburb | State | Area | n | Investor NEW | Family home | Premium (PPOR over Inv NEW) |
|---|---|---|---|---|---|---|
| Top 10 largest family-home premiums (n ≥ 20) | ||||||
| Bundaberg North | QLD | Regional Qld | 20 | +18.8%/yr | +29.5%/yr | +14.3 pp/yr |
| Oakey | QLD | Regional Qld | 27 | +31.2%/yr | +44.8%/yr | +13.5 pp/yr |
| Spalding (WA) | WA | Regional WA | 21 | +17.6%/yr | +24.8%/yr | +13.1 pp/yr |
| Rosewood (Qld) | QLD | Brisbane | 24 | +23.8%/yr | +34.4%/yr | +13.1 pp/yr |
| Brabham | WA | Perth | 24 | +27.8%/yr | +41.2%/yr | +12.7 pp/yr |
| Park Avenue | QLD | Regional Qld | 31 | +16.8%/yr | +30.0%/yr | +12.6 pp/yr |
| Blacks Beach | QLD | Regional Qld | 47 | +24.0%/yr | +35.4%/yr | +12.4 pp/yr |
| Wellard | WA | Perth | 51 | +15.8%/yr | +26.9%/yr | +12.4 pp/yr |
| Bundamba | QLD | Brisbane | 26 | +22.8%/yr | +35.7%/yr | +12.4 pp/yr |
| Aveley | WA | Perth | 44 | +25.4%/yr | +38.4%/yr | +12.2 pp/yr |
| Smallest family-home premiums (n ≥ 20). Where the investor scenario is closest to the family home | ||||||
| Mount Waverley | VIC | Melbourne | 23 | -7.7%/yr | -5.0%/yr | +1.5 pp/yr |
| Eltham (Vic.) | VIC | Melbourne | 31 | +0.6%/yr | +2.2%/yr | +1.5 pp/yr |
| Altona Meadows | VIC | Melbourne | 22 | +6.4%/yr | +7.9%/yr | +1.7 pp/yr |
| Moonee Ponds | VIC | Melbourne | 20 | -13.2%/yr | -11.6%/yr | +1.8 pp/yr |
| Mulgrave (Vic.) | VIC | Melbourne | 24 | +3.0%/yr | +4.1%/yr | +1.9 pp/yr |
Two patterns. The top 10 are dominated by regional and outer-metro houses where rent does most of the carrying work but where property management, land tax and capital gains tax inflict the most damage on the investor side. The bottom 5 are dominated by inner Melbourne suburbs that have spent the last several years in real-price decline. Both sides earned modest or negative real returns, and the investor's structural disadvantage looks smaller because absolute returns are compressed.
Find the spread of outcomes for any Australian suburb. Microburbs suburb reports now include the historical spread of investor outcomes for every Australian suburb with enough recorded same-house resales. See the top-10-in-100 and bottom-10-in-100 outcomes for your suburb, the share of investor activity that was loss-making, and the family-home premium under the new rules. Search any suburb →
The 2026 Budget changes are real, and the family-home tax treatment retains a small structural advantage over investor tax treatment. Both are second-order effects. The first-order effect is which property you buy. The spread between a best-10-in-100 and worst-10-in-100 real return is roughly 20 times the size of either tax modifier. For most Australians making a property decision today, the practical implication is the same: spend your effort on suburb and property selection. The investor case is alive for those who pick well.
