Across 63,408 Australian houses bought and later sold between 2002 and April 2026, the gap between the best 10 in 100 and the worst 10 in 100 investors in the customer bracket was around 33 points per year on the deposit. The new 2026 tax rules trim the typical investor's return by 1 to 2 points per year. Property choice has historically been roughly 20 times more important than tax setting. Investors who picked well continue to earn very well under the new rules.
 By Luke Metcalfe · Founder, Microburbs Research
The 12 May 2026 Federal Budget changed two things for anyone buying an existing residential investment property after the announcement at 7:30 pm AEST on 12 May 2026. First: from 1 July 2027, if your rental costs more to run than the rent it brings in, that loss no longer reduces the tax on your day-job salary. The loss can still be saved up and used against future rent or against the profit on sale. Second: the 50 per cent discount on capital gains tax is gone for any gain accruing from 1 July 2027 onwards. In its place, your purchase price gets adjusted up for inflation before the tax is worked out, and the tax never falls below 30 per cent of the remaining gain. Both changes apply only to purchases of existing homes. New builds keep the old rules.
The natural question is whether property investing is still worth it. The data says clearly: yes, for investors who pick well. The tax change moves the average outcome by a small amount. The big profits in the data never came from the average investor. They came from people who picked unusually well.
The property you choose matters far more than the new tax rules. Across the 63,408 same-house resales in the data, the best 10 in 100 investors earned a real return on their deposit of around 29 per cent per year in the customer bracket. The worst 10 in 100 lost around 3 per cent per year. That gap between best and worst is roughly 33 points per year on the deposit. The new 2026 tax rules shift the typical investor's outcome by around 1.5 points per year. Which property you bought has historically been around 20 times more important than which set of tax rules applied.
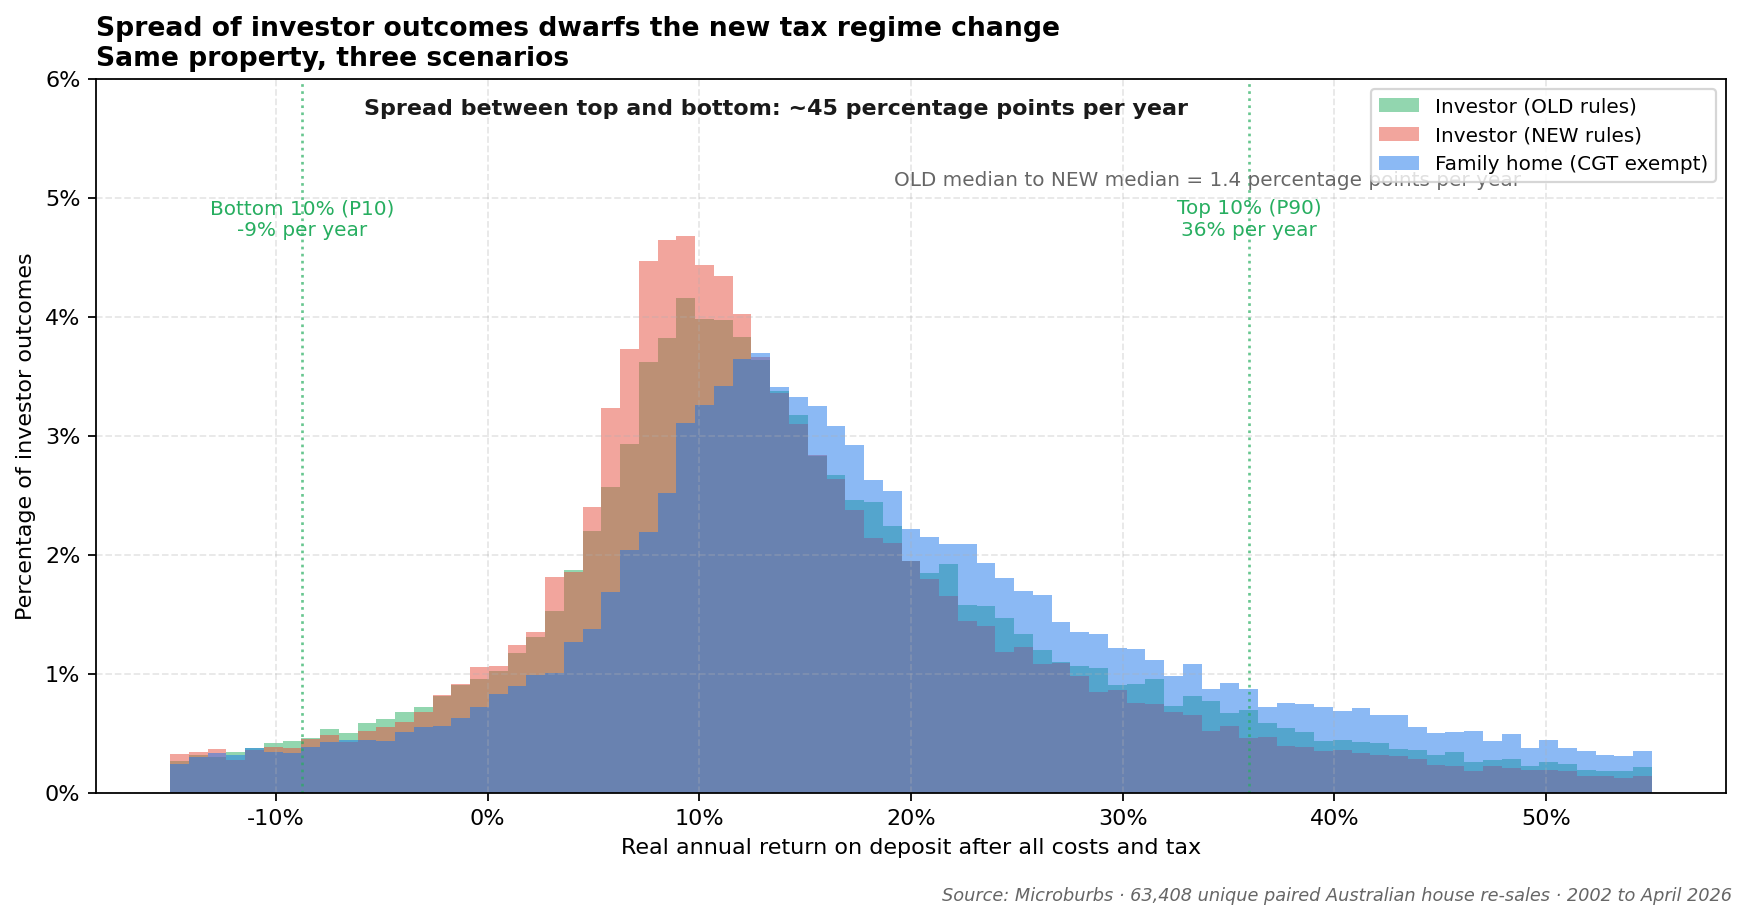
This was true before the budget. It is more true now. The budget made the typical return a bit smaller. It did not change which investors win and which lose. People who picked well continue to do well. People who picked badly continue to do badly.
Deep dive: the full analysis of why outcomes vary so much →
Roughly 1 in 4 investors in the $400,000 to $800,000 bracket earned more than 18 per cent per year on their deposit (in today's dollars), even with the new rules applied. The best 1 in 10 earned more than 29 per cent per year on their deposit. On an $80,000 deposit, 18 per cent per year is around $14,400 in the first year. 29 per cent per year is around $23,200. Both compound from there.
The honest question is whether this top-tier outcome is a lucky one-off from a hot market or a consistent feature. Two cuts of the data answer it.
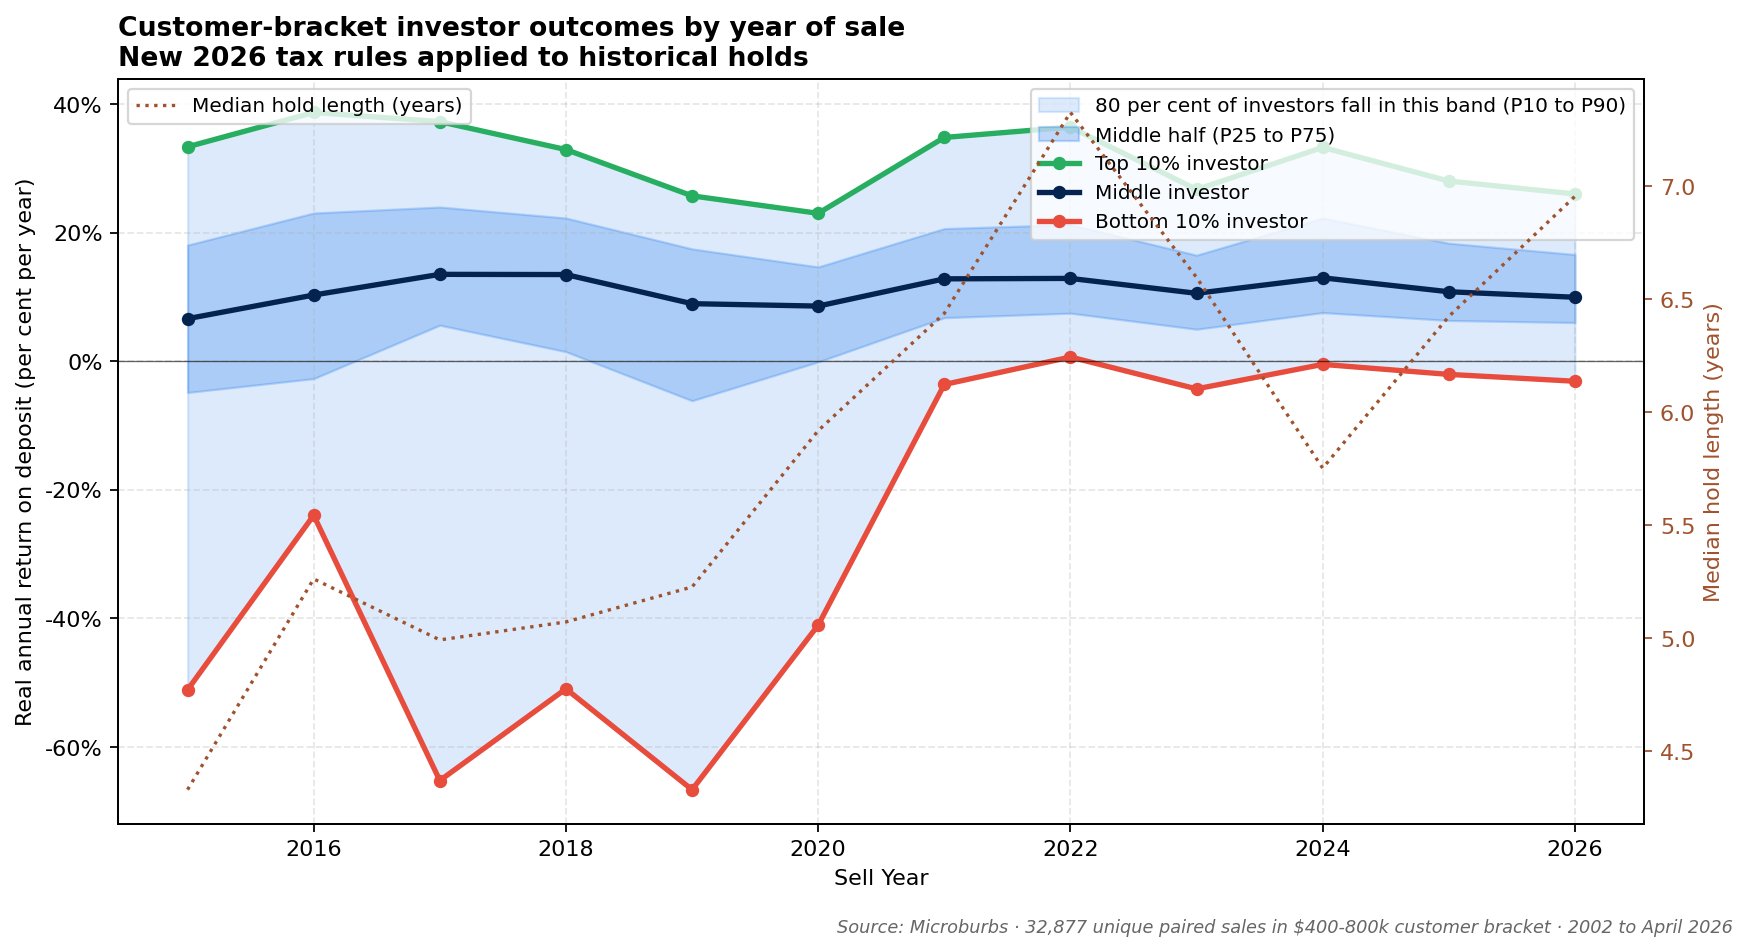
For every year between 2015 and 2026 in which our sample saw at least 50 customer-bracket sales, the best 10 in 100 investors earned between 22 and 38 per cent per year on their deposit in today's dollars with the new rules applied. The middle investor sat between 7 and 14 per cent per year. The worst 10 in 100 fluctuated more. This is not a single-year boom. The top tier of customer-bracket investors has earned strongly in every recent year of sale, including the early 2026 group.
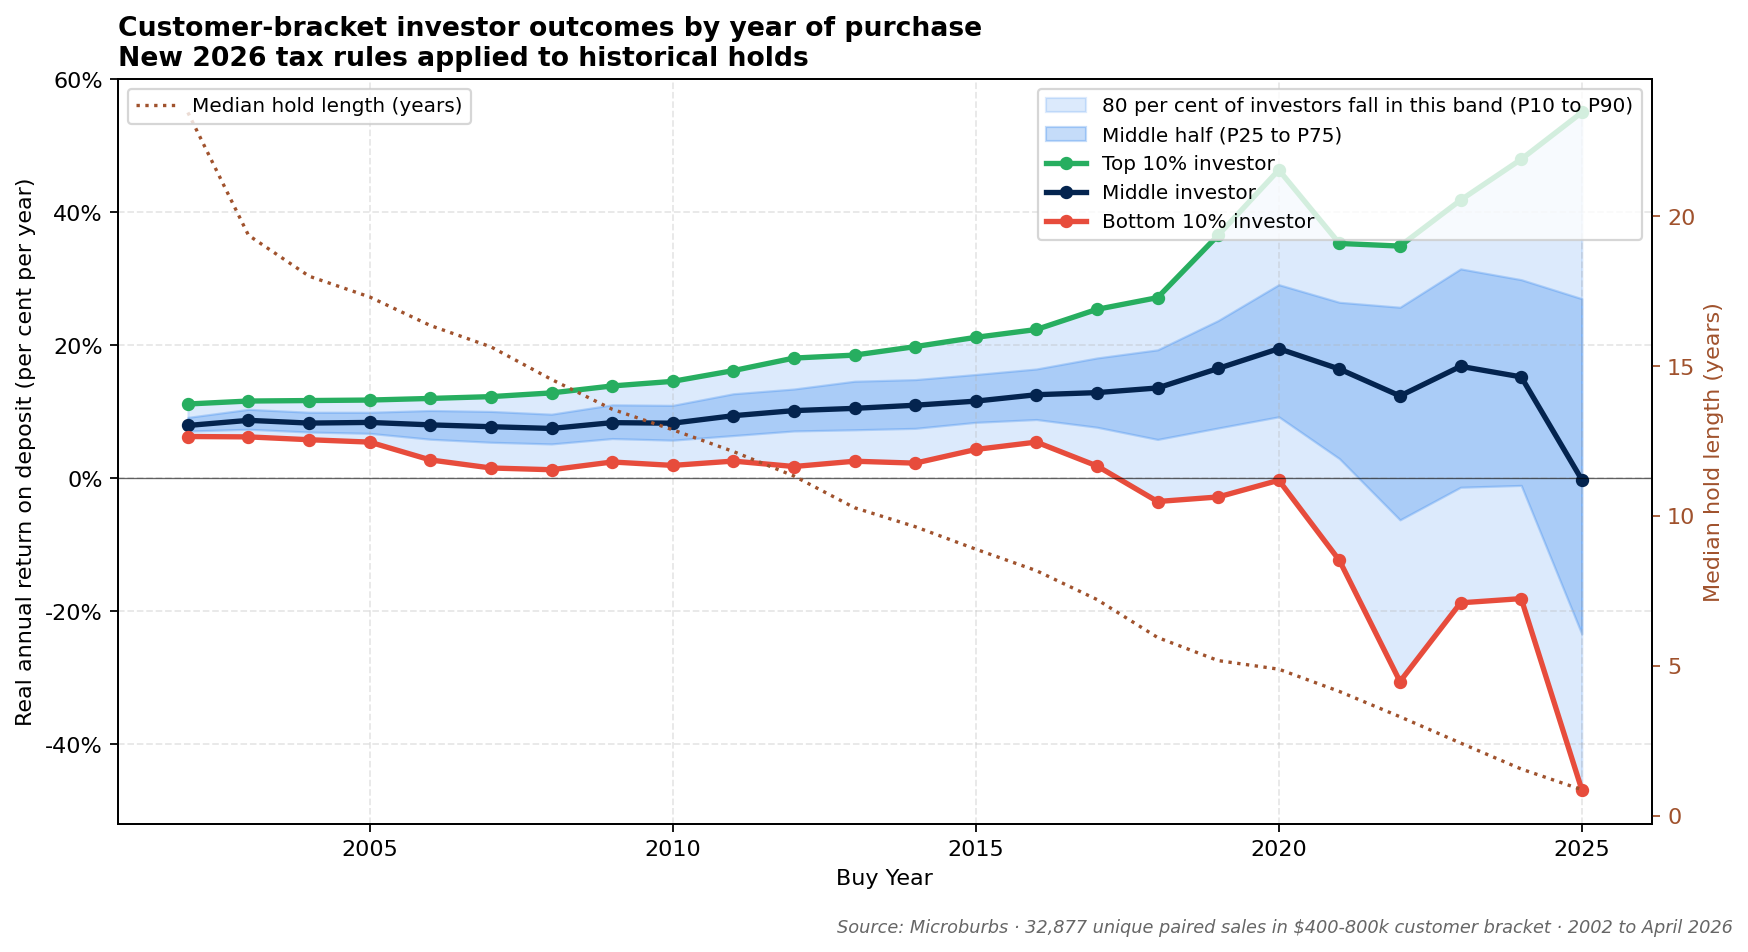
The split by year of purchase tells a more nuanced story. Best-10-in-100 investors who bought between 2003 and 2010 and held for 15 to 19 years earned a steady 9 to 13 per cent per year on their deposit in today's dollars. Best-10-in-100 investors who bought between 2018 and 2024 and held for 1 to 3 years earned 30 to 55 per cent per year on their deposit. The per-year number rises sharply with shorter holds during the post-2020 price rise. The long-hold numbers are the more reliable expectation for someone buying today and holding for a decade or more.
Concrete dollar example. A best-10-in-100 investor in our customer bracket who bought in 2007 with around $100,000 in today-money deposit and held until around 2022 earned roughly 13 per cent per year on the deposit in today's dollars with the new rules applied. That compounds to around $525,000 of real profit on the original $100,000 deposit over a 15-year hold. A top-tier investor who bought in 2020 and sold in 2024 earned closer to 30 per cent per year, but on a much shorter hold. Both are real best-10-in-100 outcomes from the data. The investor case is alive across the full window for people who picked well.
The new tax rules nudge the top earners down a few points and nudge the bottom losses down a few points. They do not change the overall pattern. Investors who pick well continue to win. The catch is that picking the property well is harder than picking the tax structure.
Deep dive: the breakdown of best-in-class investor outcomes by state and hold length →
The $400,000 to $800,000 bracket is where most of our customers buy. Two things matter when you look at the data here. First: the wide spread of investor outcomes holds in this bracket. The top 10% earned 24% to 32% per year on their deposit (in today's money) under the new rules. The middle investor earned 10% to 12% per year. The bottom 10% lost about 8% per year on their deposit at the $600,000 to $800,000 end, or roughly broke even at the $400,000 to $600,000 end. Where you end up in that spread is the decision that matters.
Second: this bracket is where the typical investor case is hardest to make. The wide spread says it is possible to do very well. The middle line says the typical hold won't get you there by itself. Picking the right suburb, the right street, and the right house is what separates the top 10% from the middle in our data.
| Price band (today's money) | Sales in band | Bottom 10% investor (worst-case) | Middle investor (typical) | Top 10% investor (best-case) |
|---|---|---|---|---|
| Under $400,000 | 13,551 | +7.2%/yr | +17.7%/yr | +43.0%/yr |
| $400,000 to $600,000 | 19,278 | +1.4%/yr | +12.2%/yr | +31.8%/yr |
| $600,000 to $800,000 | 13,599 | -10.4%/yr | +9.3%/yr | +24.8%/yr |
| $800,000 to $1.2m | 10,472 | -24.3%/yr | +7.7%/yr | +23.4%/yr |
| $1.2m+ | 6,508 | -67.1%/yr | +1.7%/yr | +18.1%/yr |
All figures are the real annual return on deposit, with the new tax rules applied to each historical hold. The middle investor numbers are the typical outcome. The bottom-10% and top-10% columns show the full width of the spread. Note how the spread widens as the price rises and how short-hold buyers at the bottom of the recent market produce extreme negatives at the $1.2m+ end (these figures are annualised, so a loss spread over a year or two looks far larger than the dollars actually lost). The customer bracket ($400,000 to $800,000) is where the typical investor case is hardest, but the top 10% in every band still earned strongly.
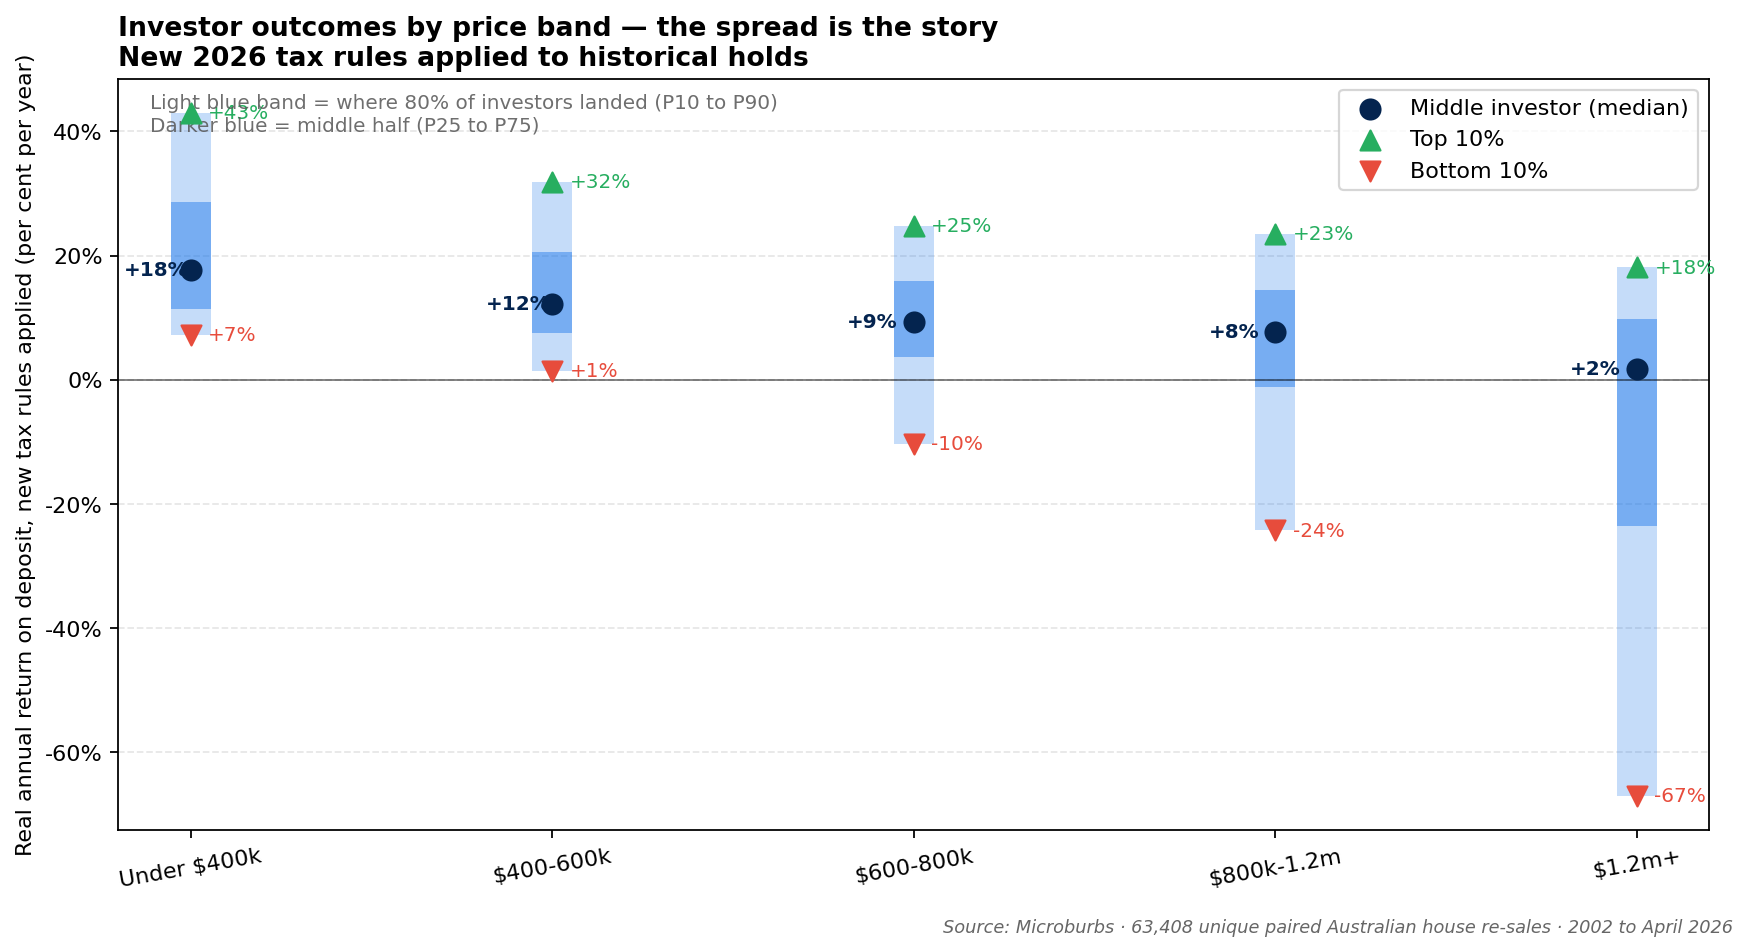
The way performance changes with price is the second practical takeaway. Three costs eat into the middle investor's return, and they bite harder the further up the price ladder you go: state land tax rises faster than the price and only investors pay it (not owner-occupiers), the capital gains tax bill grows with the size of the gain, and property management fees skim a slice of the rent for the whole hold. None of these touch the family home. The spread of outcomes within each price band is still wide, so a best-25-in-100 investor in any price band can still beat the middle family home buyer.
Deep dive: the full price-band analysis →
These are the three Australian suburbs with the largest count of paired sales in the $400,000 to $800,000 bracket. They were picked by sample size, not by outcome. The numbers below are medians for the bracket within each suburb.
A typical family-home suburb with lots of owner-occupiers on Melbourne's south-east urban edge. The middle Pakenham investor in this bracket earned around 11 per cent per year on the deposit. The best 10 in 100 here earned roughly 25 to 30 per cent per year on the deposit.
In today's dollars: typical Pakenham hold in this bracket is 5.8 years, deposit around $126,000 in today's money, purchase price around $568,000. The median family home owner kept around $171,000 of real profit (in today's money). The median same house held as an investor with the new rules applied kept around $101,000. Difference at the median: $62,000 in today's money.
A large planned housing estate on Perth's southern fringe. One of the fastest-growing areas in the country since 2002. Both the middle family home and a best-25-in-100 investor outcome did well here. The middle investor still lagged the middle family home buyer.
In today's dollars: typical Baldivis hold in this bracket is 4.3 years, deposit around $115,000 in today's money, purchase price around $534,000. The median family home owner kept around $265,000 of real profit (in today's money). The median same house held as an investor with the new rules applied kept around $161,000. Difference at the median: $107,000 in today's money.
A regional Queensland suburb covering most of Townsville's family houses. Long holds, modest growth, more typical of regional Australia than the booming city outskirts. Even the modest growth here is enough to produce a six-figure dollar gap between the middle family home buyer and the middle investor in the same property.
In today's dollars: typical Kirwan hold in this bracket is 8.4 years, deposit around $101,000 in today's money, purchase price around $474,000. The median family home owner kept around $206,000 of real profit (in today's money). The median same house held as an investor with the new rules applied kept around $117,000. Difference at the median: $85,000 in today's money.
Deep dive: the full state-by-state and suburb-level breakdown →
1. The investor case is alive for people who pick well. The top 10 in 100 investors continue to earn very large real returns under the new rules. Across every recent year of sale they have earned between 22 and 38 per cent per year on the deposit in the customer bracket alone. The new rules dent the typical investor's return by around 1.5 points per year. They do not collapse the spread of outcomes. The work is in picking the right property in the right suburb, not in fiddling with the tax structure.
2. Use the data on each suburb to lift your odds. The spread within every bracket is wide, but the suburbs at the top of each bracket are not random. Microburbs suburb reports show the historical spread of investor returns for each Australian suburb with enough recorded same-house resales. Search a suburb before you commit and see whether its track record sits in the top 25 in 100 or the bottom 25 in 100 of bands like it.
3. New builds and subdivisions keep the old rules. The full mortgage-loss deduction and a choice of capital gains method continue to apply to new builds and to dwellings produced through subdivision. A new build in a strong-demand suburb is one of the few legal routes to keep the old tax treatment.
Find the suburbs where investors actually win. Microburbs suburb reports show the historical spread of investor returns for any Australian suburb with enough same-house resales recorded. See where the top 10% of investors earned their returns in the past, and which suburbs tend to produce best-25-in-100 or worst-25-in-100 outcomes for the same hold length. Search a suburb before you commit to a contract. Search a suburb →
Deep dive: the full investor playbook →
What is in the sample: 63,408 same-house resales between 2002 and April 2026, in every state, where the same house was bought and later sold and the structural type was not changed in between (no major renovation, no subdivision, no demolition). Properties that were knocked down, extended significantly, or split into units are excluded so it is a fair comparison on the same house. The sample is limited to properties that sold twice in the window, so investors who bought and never sold are not represented.
How the 2026 sales were added: for the 2026 portion of the data, we used a 20 per cent deposit, 5.2 per cent average interest rate, our per-property weekly rent estimate, and the same property-management, maintenance, agent-fee and land-tax numbers as the rest of the data. For 2024 to 2026 purchases this means today's rent is applied across the (short) hold. This slightly inflates the investor return for very recent purchases. The direction of the customer-bracket finding is unchanged.
Why the customer-bracket finding is robust to our cost assumption: insurance, property management fees, rates and maintenance are calculated at 1 per cent of property value. Between $400,000 and $1,200,000 this is close to the real dollar cost. Below $400,000 the real fixed-dollar costs are larger than 1 per cent, which means the under-$400,000 family-home premium in the table is, if anything, understated. The customer-bracket numbers do not depend on this assumption.
The best-10-in-100 outcomes are not just short flips. Splitting by year of sale, the best-10-in-100 investor outcome in our customer bracket stayed between 22 and 38 per cent per year on the deposit in every full year of data from 2015 to 2026. Splitting by year of purchase, the best 10 in 100 investors who bought in the 2000s and held for 15 to 19 years still earned 9 to 13 per cent per year on their deposit. Buyers in the 2018 to 2025 group earned much higher numbers per year because they held for a short time during the post-2020 price rise. Readers should weight the long-hold groups more heavily when thinking about what to expect over the next decade.
Why the result still holds when we count differently: the underlying dataset has 69,794 records, with some pre-2026 properties producing more than one row (one per year of the hold). Counted by unique sale instead, we have 63,408 records overall and 32,877 in the customer bracket. Either way, the family-home premium in the customer bracket under the new rules is around +5 points per year and the spread between best-10-in-100 and worst-10-in-100 investors is around 33 points per year. The headline does not depend on how we count. Data as at April 2026, the date of the most recent resale in the dataset.
Deep dive: the full list of caveats and what we did and didn't capture →
The analysis sits on 63,408 same-house resales (across 69,794 hold-year observations) covering every Australian state, between 2002 and April 2026. Stamp duty, mortgage interest, agent fees, property management and state land tax are calculated property by property using the actual hold dates and prices. Insurance, rates and maintenance use a 1 per cent of property value placeholder. The investor scenario applies a 39 per cent marginal tax rate (the typical 37 per cent bracket plus the 2 per cent Medicare levy) and treats every rental loss under the new rules as carry-forward to the eventual capital gain (no salary offset, in line with the post 1 July 2027 settled treatment). Capital losses are clamped at zero (no tax refund on a losing sale). Both options assume a 20 per cent deposit and an 80 per cent loan. For a buyer with about $80,000 saved, that points to roughly a $400,000 purchase before stamp duty and other buying costs. The 20/80 split is held the same in both options so the comparison is about rent, costs and tax, not who borrowed more. Every return is adjusted for actual realised inflation over each property's hold window. A second, independent computation built with a different tax framing reached the same conclusion: the family home comes out ahead, by a premium of a similar size (around 2 points per year before borrowing). The two methods differ on the exact figure but agree on the direction and the rough magnitude.
Read the full method →
