On four-year holds, across Australia. This paper breaks that result apart: every rating year, every state, city and country, cheap streets and dear ones, rising and falling markets, streets that barely trade, and holds from two to eight years.
 By Luke Metcalfe · Founder, Microburbs Research
You have picked the suburb. The question left is which street to buy on. Microburbs rates every street we can read against the rest of its own suburb, and over a four-year hold the streets we rate highest have beaten their suburb by 6.6% a year, with our best-rated street beating our worst-rated one in the same suburb about 9 times in 10.
A single average can hide a great deal, so this paper takes the result apart. We re-ran the same test inside every slice we could cut: each of the 10 rating years from 2012 to 2021, all 8 states and territories, capital-city against regional, four price bands, suburbs that fell as well as suburbs that boomed, streets with almost no recent sales as well as busy ones, and holds of two, four, six and eight years. Every slice came out positive, ranging from +4.0% to +7.0% a year across the rating years. We also say plainly where the result is thinnest and what it does not claim.
Two houses can share a suburb and an asking price, then take different paths because of the street. Microburbs rates that street-level difference across Australia. The useful question is not whether the whole market rises. It is which street is better inside the suburb a buyer has already chosen.
| Hold | Top-rated streets ahead of own suburb | Best-rated street beat worst-rated |
|---|---|---|
| 2 years | +6.6% / yr | 87 in 100 |
| 4 years | +6.6% / yr | 90 in 100 |
| 6 years | +5.0% / yr | 91 in 100 |
| 8 years | +3.3% / yr | 91 in 100 |
One average can hide a lot. A street edge that only shows up in Sydney, or only in the boom years, or only on busy streets, is no use to a buyer standing in front of a house in Morayfield. So we ran the same test again inside every slice we could cut, and went looking for the place where it stops working.
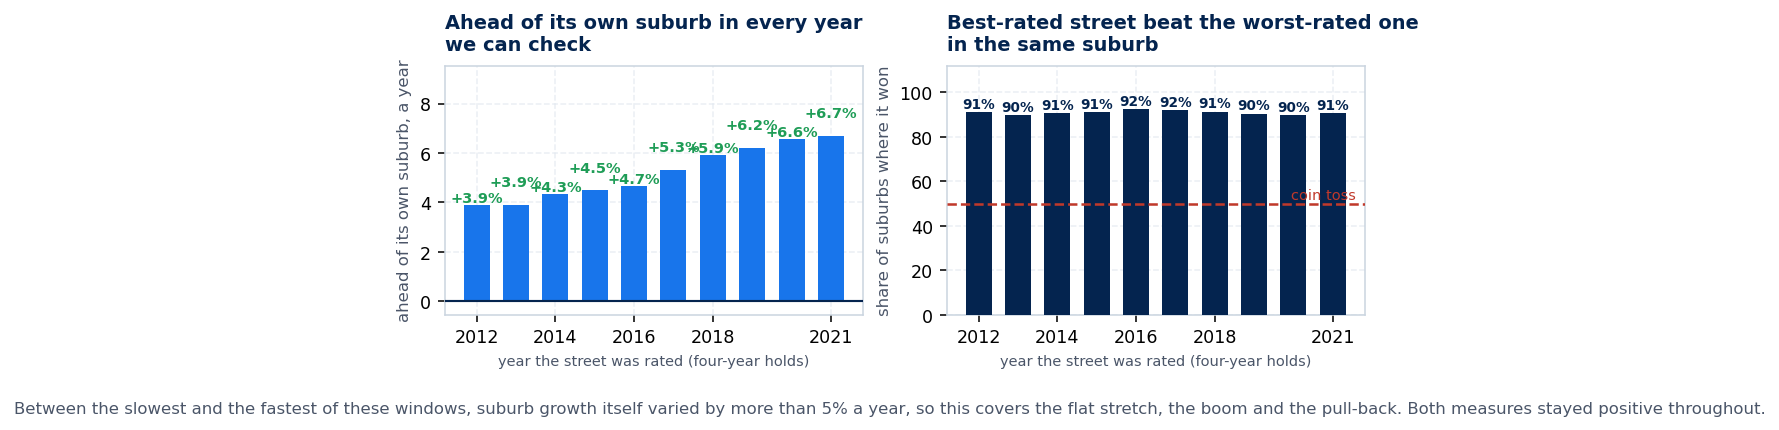
Each bar is a separate test. We rate the streets using only what was known at the end of that year, then wait for the full four years to finish and read what happened. The best-rated streets finished ahead of their own suburb in all 10 rating years from 2012 to 2021, between +4.0% and +7.0% a year. The run stops at 2021 because that is the most recent rating with a finished four-year result behind it: a street rated at the end of 2022 has nothing to check until December 2026. The sales feeding these tests run through to 2026. Between the slowest and the fastest of those windows, suburb growth itself varied by more than 5% a year, so this covers the flat stretch, the boom and the pull-back. The best-rated street beat the worst-rated street in the same suburb in 90 to 92 suburbs out of 100, year in and year out.
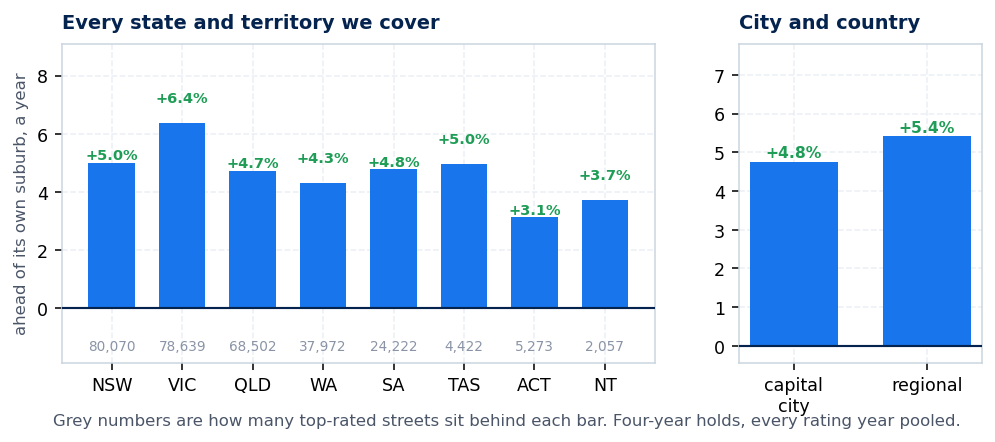
All 8 of the 8 states and territories we cover came out ahead, and so did both capital-city and regional streets. Nothing here rests on one hot market.
| State | Ahead of its own suburb | Share that finished ahead | Top-rated streets tested |
|---|---|---|---|
| NSW | +5.0% / yr | 69 in 100 | 80,070 |
| VIC | +6.4% / yr | 72 in 100 | 78,639 |
| QLD | +4.7% / yr | 73 in 100 | 68,502 |
| WA | +4.3% / yr | 77 in 100 | 37,972 |
| SA | +4.8% / yr | 72 in 100 | 24,222 |
| TAS | +5.0% / yr | 70 in 100 | 4,422 |
| ACT | +3.1% / yr | 66 in 100 | 5,273 |
| NT | +3.7% / yr | 75 in 100 | 2,057 |
| Where the street is | Ahead of its own suburb | Share that finished ahead | Top-rated streets tested |
|---|---|---|---|
| Capital city | +4.8% / yr | 71 in 100 | 176,736 |
| Regional | +5.7% / yr | 74 in 100 | 128,370 |
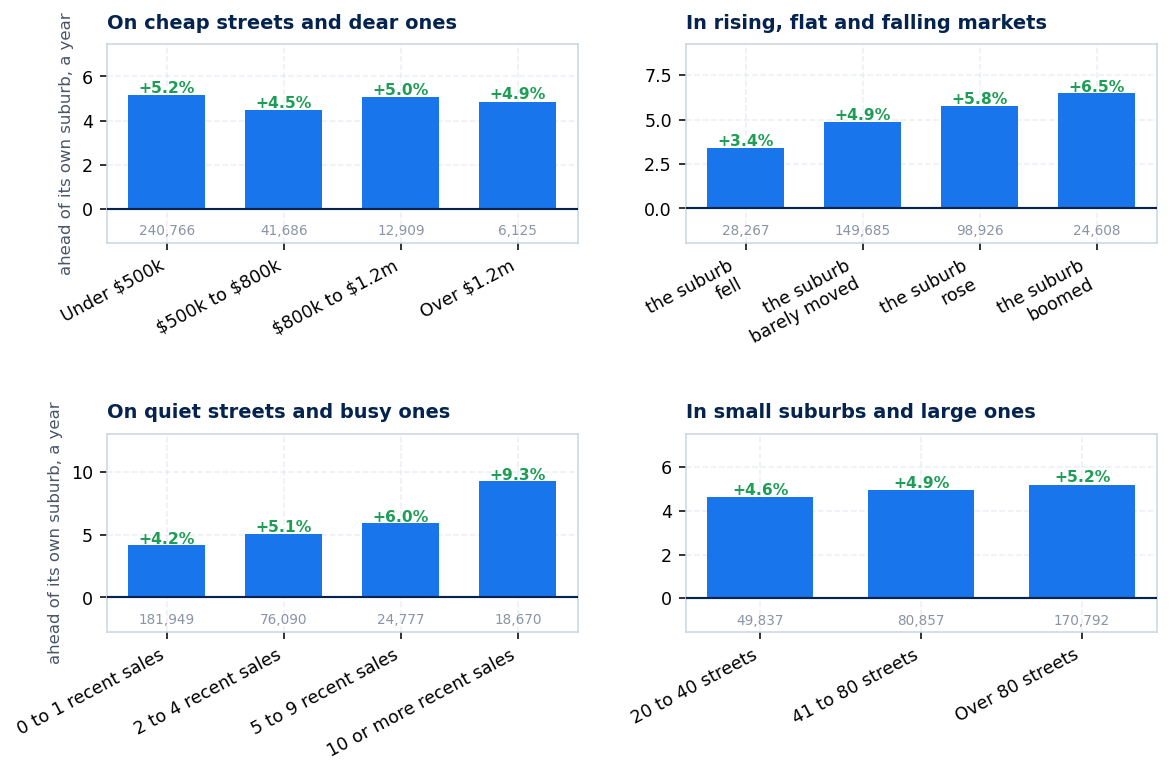
The four cuts that decide whether this is usable. Price matters because our readers are mostly shopping under $800,000, not in the blue-chip belt. Falling and flat markets matter because a signal that only works when everything rises is just the market in disguise. Quiet streets matter because most streets are quiet: a street with two sales in two years is the normal case, not the exception. And small suburbs matter because that is where local knowledge is meant to beat data. The strongest reading is on streets that trade a lot, which is also where a street's price is easiest to read.
| Price of the typical home on the street | Ahead of its own suburb | Share that finished ahead | Top-rated streets tested |
|---|---|---|---|
| Under $500k | +5.4% / yr | 73 in 100 | 244,100 |
| $500k to $800k | +4.5% / yr | 71 in 100 | 41,695 |
| $800k to $1.2m | +5.0% / yr | 74 in 100 | 12,948 |
| Over $1.2m | +5.0% / yr | 75 in 100 | 6,363 |
| What the suburb itself did over the four years | Ahead of its own suburb | Share that finished ahead | Top-rated streets tested |
|---|---|---|---|
| The suburb fell | +3.5% / yr | 78 in 100 | 29,654 |
| The suburb barely moved | +4.9% / yr | 73 in 100 | 149,421 |
| The suburb rose | +6.1% / yr | 70 in 100 | 97,685 |
| The suburb boomed | +6.9% / yr | 71 in 100 | 28,346 |
| Sales on the street in the two years before we rated it | Ahead of its own suburb | Share that finished ahead | Top-rated streets tested |
|---|---|---|---|
| 0 to 1 recent sales | +4.3% / yr | 66 in 100 | 173,829 |
| 2 to 4 recent sales | +5.2% / yr | 78 in 100 | 79,503 |
| 5 to 9 recent sales | +6.0% / yr | 84 in 100 | 28,367 |
| 10 or more recent sales | +9.0% / yr | 88 in 100 | 23,407 |
| Hold | Best-rated streets ahead of own suburb | Share that finished ahead | Separate yearly tests |
|---|---|---|---|
| 2 years | +5.2% / yr | 69 in 100 | 14 |
| 4 years | +5.2% / yr | 73 in 100 | 10 |
| 6 years | +4.5% / yr | 72 in 100 | 6 |
| 8 years | +3.4% / yr | 69 in 100 | 2 |
The edge is largest on shorter holds and fades as the horizon stretches out, which is what you would expect: the further ahead you look, the more the whole suburb, not the street, decides the outcome.
Every cut above came out positive, at every one of the four holding periods. The thinnest was ACT, at +3.1% a year against its own suburb over four years. That is the honest summary of the ranking: it points the right way everywhere we looked, including in suburbs that fell.
The soft spot is streets with almost no recent sales. They are the noisiest to read, and they are held back in the live report rather than dressed up as a confident call.
At each past rating date the forecast could only see results that had already finished by that date. Nothing from the future was available to it. It then rated the streets and we waited for the full two, four, six or eight calendar years to run out before reading the outcome. Part-finished periods were left out, so a hold begun at the end of 2022 does not count until December 2026.
Within each suburb and rating date, streets were ranked using the information available then. We compared the realised street-median growth of the higher-rated street with the lower-rated street, and compared the top-rated group with that same suburb's typical street. This removes the easy win from simply picking a booming state or suburb.
The live report is anchored to today's market and carries two, four, six and eight-year forecasts, ending in December 2034. Where a later point collapses against the preceding point, that broken tail is held back instead of being shown as a precise forecast.
In Frankston, Cranbourne Road and Leawarra Parade sit at roughly the same price. The current four-year forecast puts Cranbourne Road ahead of the suburb and Leawarra Parade behind it. That is the decision the forecast is built for: same suburb, similar budget, clearer street choice.
Open the Frankston street forecast preview →
It is a group result, not a promise for one home. The house itself, a renovation or one unusual sale can overwhelm the street signal. This is a rating of the street, not a valuation of a listing.
Quiet streets are the soft spot. Streets with almost no recent sales are noisier, and are held back in the live report rather than shown as a confident call.
It ranks streets inside a suburb. It does not tell you whether to buy in that suburb, in that city, or this year rather than next.
Open the Microburbs suburb report for anywhere you are looking. Every street we can read is rated against the rest of that suburb, so you can see which ones we tip to beat it and which to leave alone, before you make an offer.
