On four-year holds. Microburbs forecasts house-price growth street by street for 324,918 streets across Australia, and our best-rated street in a suburb beat our worst-rated one about 9 times in 10. Read off 18 years of street sales, right through to 2026. Houses, not units.
 By Luke Metcalfe · Founder, Microburbs Research
Here is the actual thing we give you. Two streets in the one Melbourne suburb, priced within about $20,000 of each other. Our forecast puts one ahead of the suburb over the next four years and the other behind it. Same budget, two different outcomes, and the only difference is the street.
Two streets, same budget, different futures. Frankston is a Melbourne bayside suburb where the typical home sits near $705,000, right in the range our buyers shop in. Among streets all priced near $700,000, Cranbourne Road is tipped to beat the suburb over the four years ahead, while Leawarra Parade, priced alongside it, is tipped to trail. Both are strongly backed calls.
| Street | Typical home price today | Above or below the suburb's typical price | Tipped growth over the next four years, against the suburb (to Dec 2030) |
|---|---|---|---|
| Cranbourne Road | $687k | -3% | +4% / yr faster |
| Leawarra Parade | $703k | level | -1% / yr slower |
What it means: Cranbourne Road and Leawarra Parade are within about $20,000 of each other, yet Cranbourne Road is tipped about 4 per cent a year ahead of the suburb and Leawarra Parade about 1 per cent behind. Put $700,000 into either street and the gap is on the order of $170,000 over four years, for the same money up front.
Frankston is not a lucky example. Back the streets we rate highest inside a suburb, look at how they actually went, and over the four years that followed they beat the suburb around them by 6.6 per cent a year. Over that same four-year hold, set our best-rated street in a suburb against our worst-rated one and the best-rated wins about 9 times in 10. Take any two streets in a suburb at random and we call the winner about 6.5 times in 10, which rises to 7 in 10 once the two ratings are clearly apart.
These are results already banked, not a projection. We rated the streets at the end of 2020 and again at the end of 2021, held each for four years, and counted what actually happened. The most recent four-year hold finished at the end of 2025, because one started at the end of 2022 does not finish until December 2026. The sales behind all of this run to today.
You cannot buy in the past, so here is what it means for a purchase you make now. Every street we can read is rated today for the four years to December 2030, made the same way as the calls above. The suburb you are looking at this weekend already has its streets ranked.
That 6.6 per cent is an average across many streets, not a promise on any one of them. About three in ten of our best-rated streets still finish behind their suburb. We publish one of those misses further down this page.
| If you hold for | Best-rated street beat the worst-rated in the same suburb | Top street ahead of its suburb by |
|---|---|---|
| 2 years | 87 in 100 | +6.6% / yr |
| 4 years | 90 in 100 | +6.6% / yr |
| 6 years | 91 in 100 | +5.0% / yr |
| 8 years | 91 in 100 | +3.3% / yr |
These figures track the street, not any single house. They compare the typical price on one street against another in the same suburb. A single home is a rougher guide than the street it sits on, so treat this as picking the better street, not valuing a particular house.
You have already chosen the suburb. The question we answer is which street inside it to buy on. So that is the question we test ourselves on: back in 2018, using only what we knew then, we ranked every street against the other streets in its own suburb. The best-rated streets were the buy signal. The worst-rated streets were the ones to avoid. This chooses where to buy inside a suburb. It does not tell an owner when to sell. Then we waited four years.
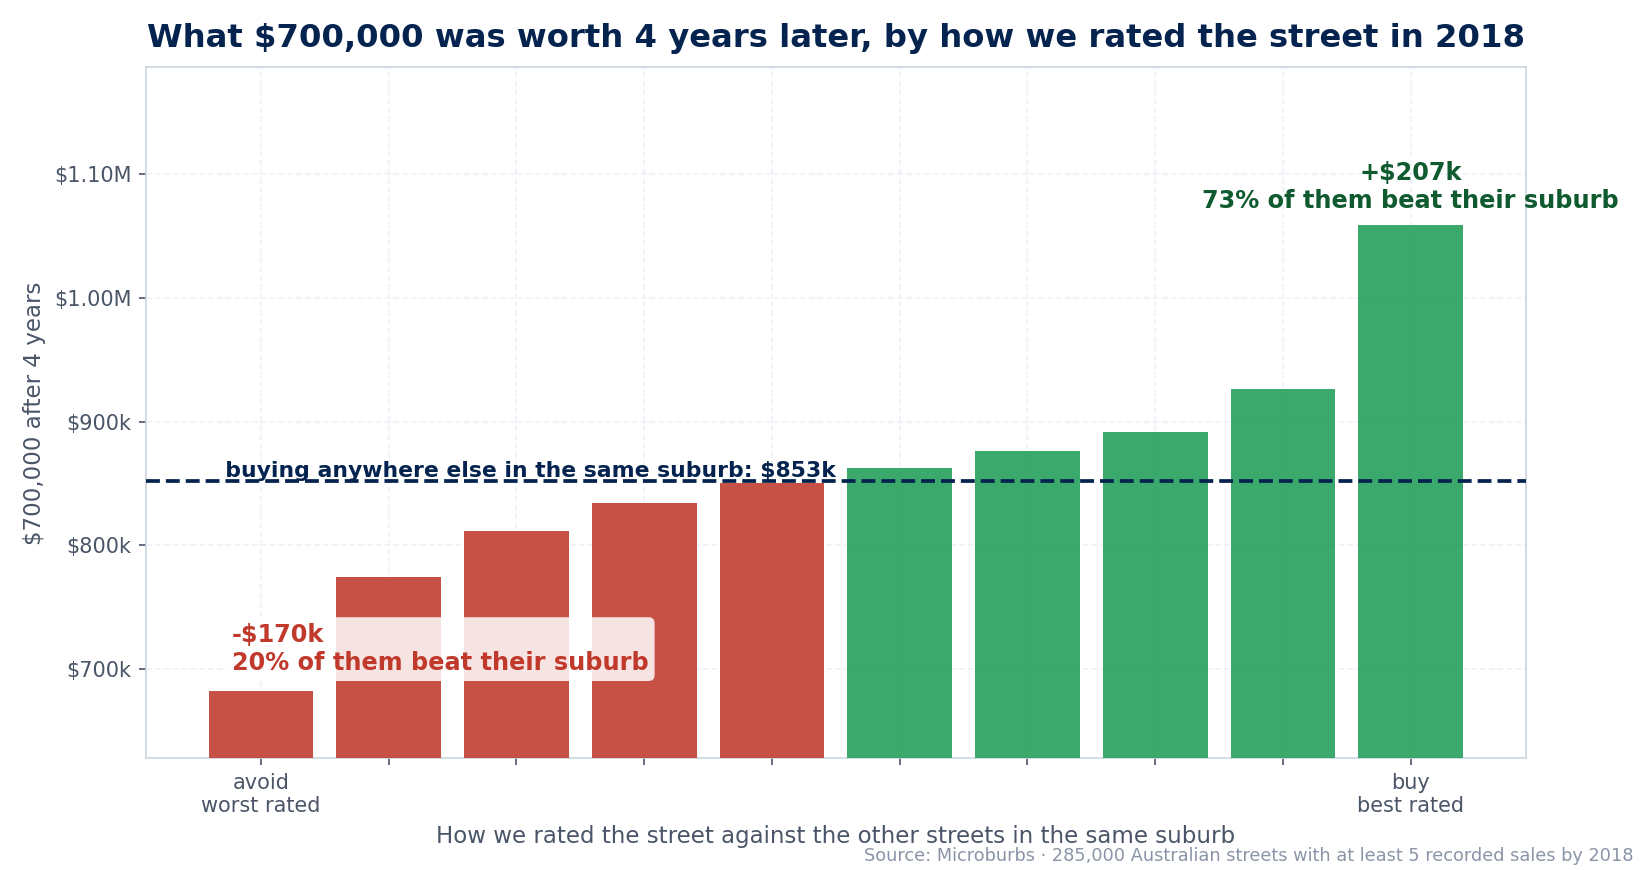
Every band steps up. Put $700,000 into the streets we rated best and four years later it was worth $1.06 million, against $853,000 for the same money anywhere else in the same suburb. That is $207,000 more, for buying on a different street in the suburb you already picked. Seven in ten of those streets beat their suburb. That is 5.9 per cent a year ahead of the suburb, close to the 6.6 per cent our four-year checks give, though this is a separate run on different years.
The signal cuts both ways. The streets we rated worst came out $170,000 behind the suburb around them, and only two in ten of them beat it. Knowing which street to avoid is worth about as much as knowing which to buy.
This covers 285,000 Australian streets: every one we could already read back in 2018. We rate 324,918 today, because more streets have built up a history since. Whichever streets you picked, the suburbs around them grew at much the same pace as each other, so this is not us picking hot suburbs and taking the credit. It is the choice of street inside one suburb, which is all we claim to call. We start the chart in 2018 because it is the call we have watched longest: hold those same streets six years and eight years and the order still holds, right through to 2026. The four-year window drawn here runs 2018 to 2022. The 6.6 per cent at the top of this page comes from the more recent windows, ending 2024 and 2025.
These are not hand-picked winners. Across six states and territories we took the highest 2018 rating with a readable price history, then published what happened next whether it won or lost. Tasmania and the Northern Territory are not shown, because neither had a street that cleared the same bar. The dark line is the street. The blue line is the same money growing at the pace of the suburb around it, which is what buying nearby would have given you.
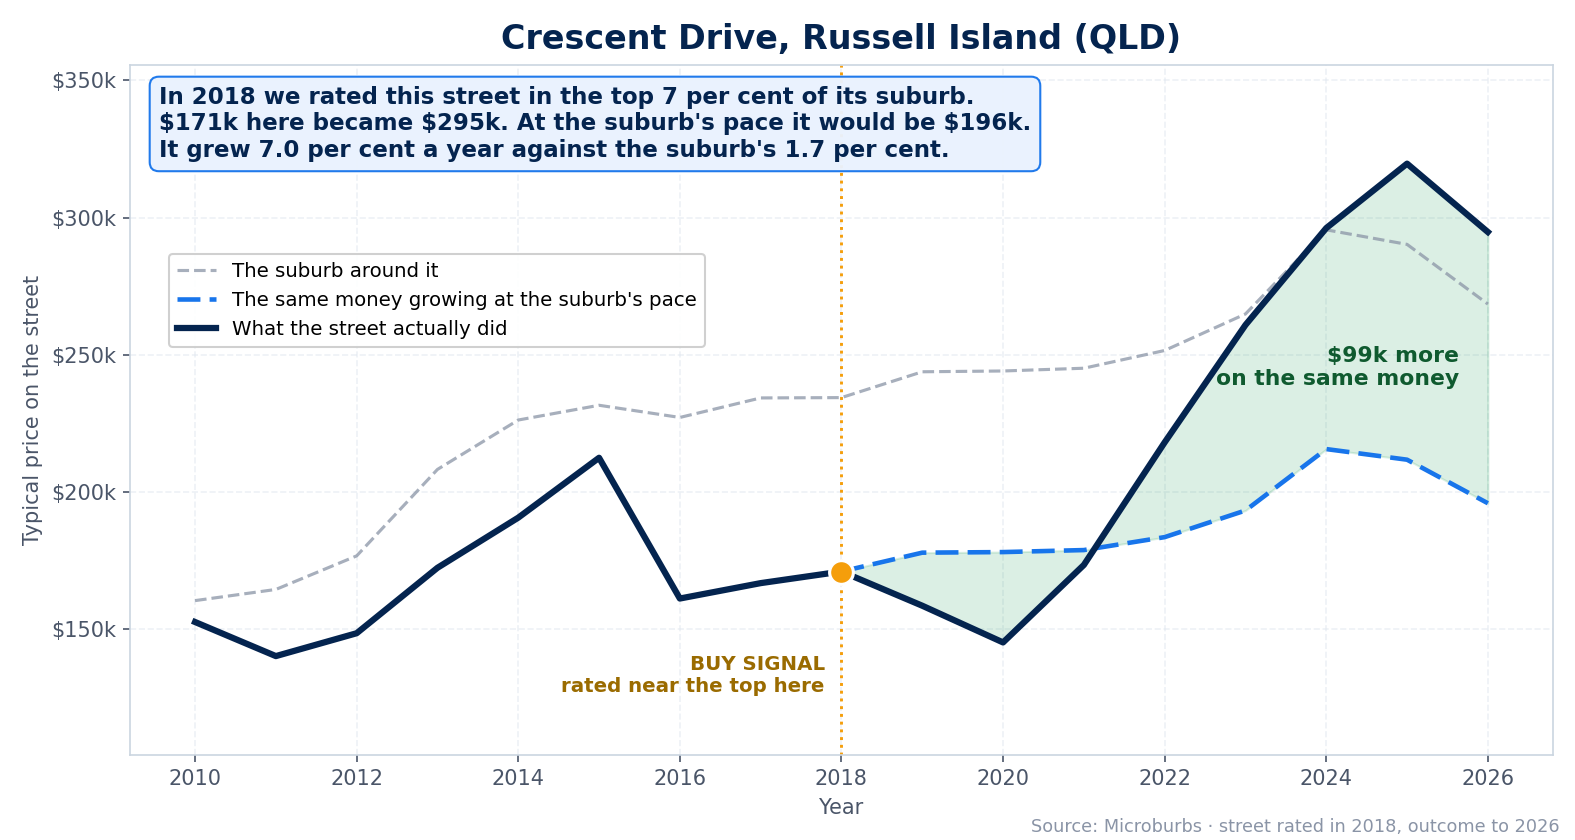
Crescent Drive, Russell Island (Queensland). $171,000 on this street became $295,000. The same money at the suburb's pace: $196,000. That is $99,000 more.

Stanley Street, Mount Lawley (Western Australia). $754,000 on this street became $1,106,000. The same money at the suburb's pace: $1,140,000. That is $34,000 less. It did not work out.
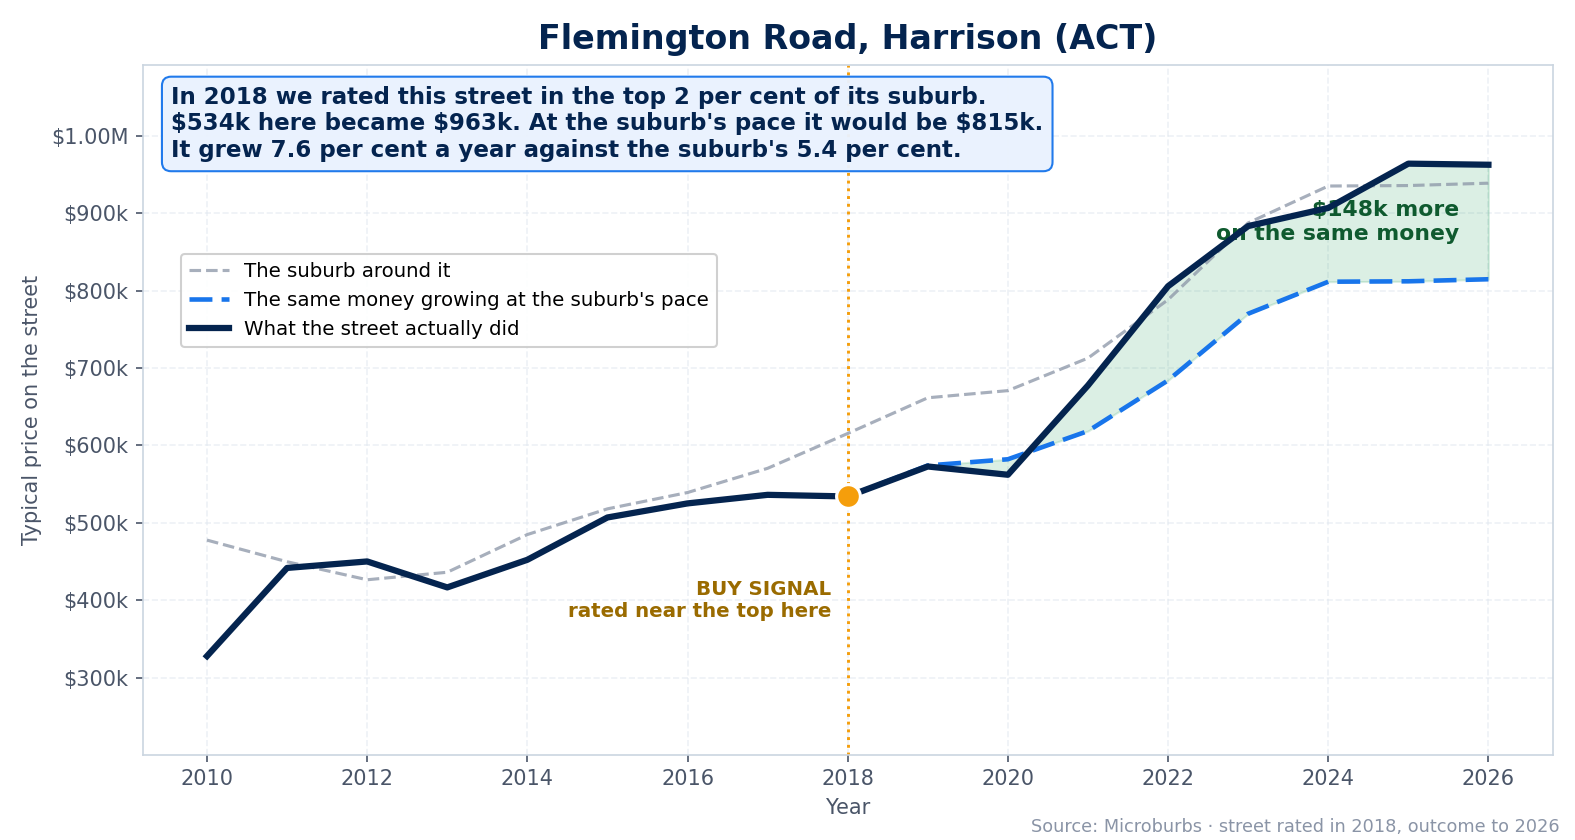
Flemington Road, Harrison (Canberra). $534,000 on this street became $963,000. The same money at the suburb's pace: $815,000. That is $148,000 more.
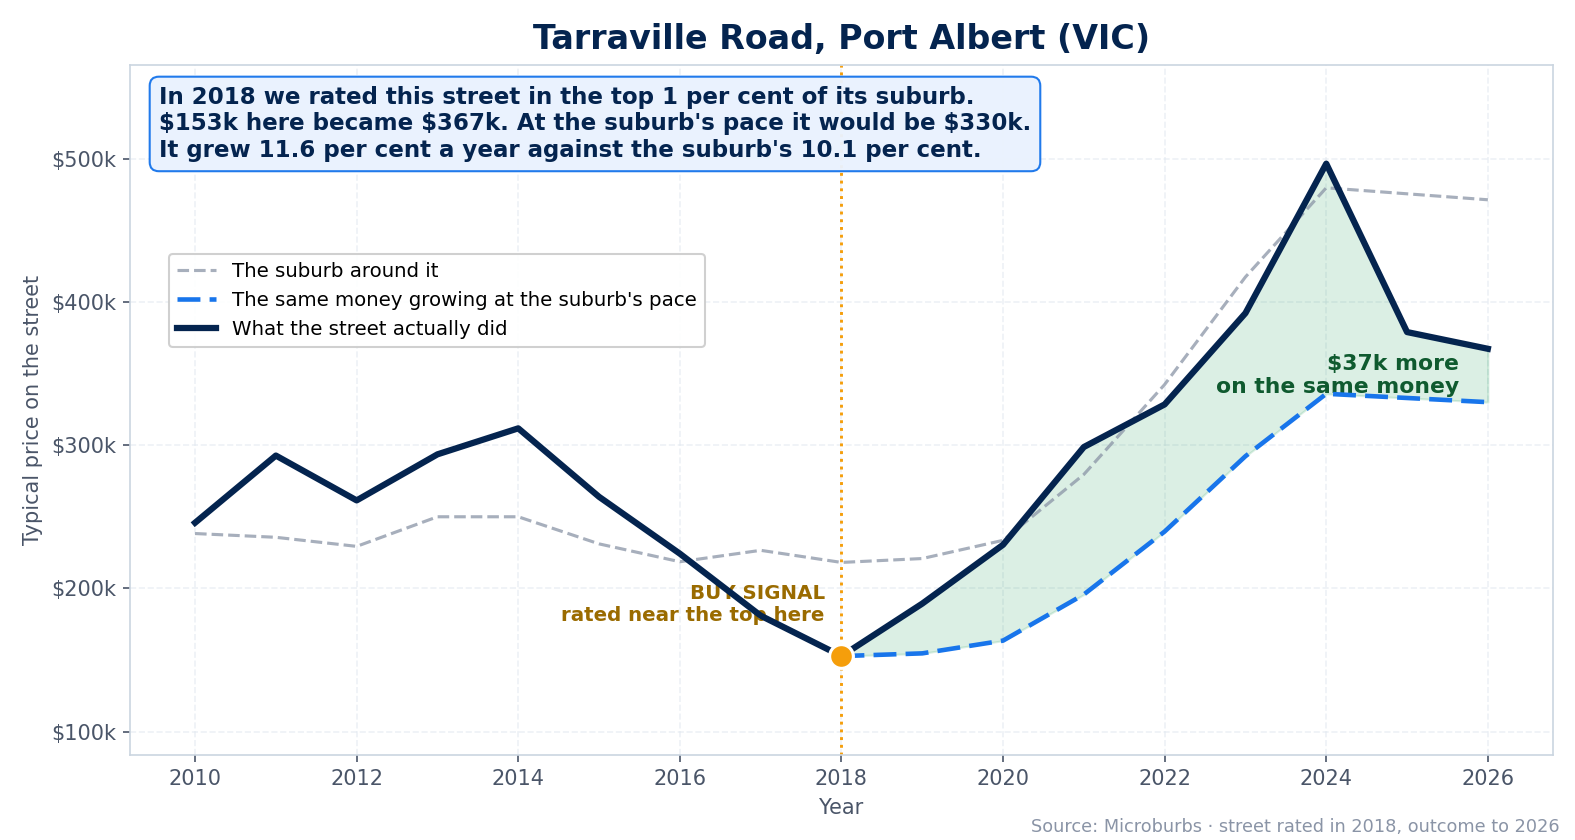
Tarraville Road, Port Albert (Victoria). $153,000 on this street became $367,000. The same money at the suburb's pace: $330,000. That is $37,000 more.
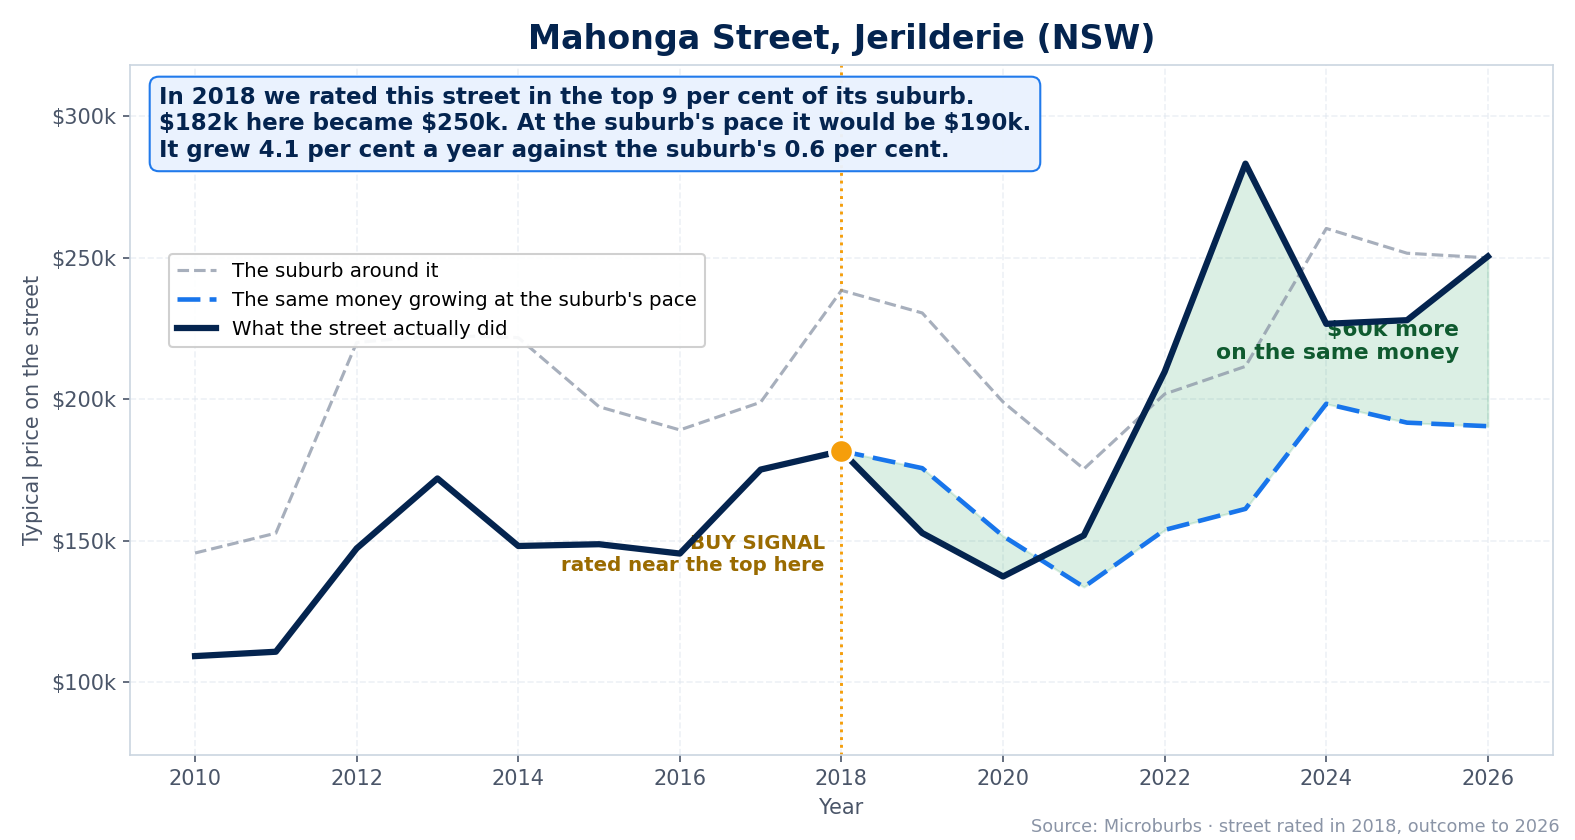
Mahonga Street, Jerilderie (New South Wales). $182,000 on this street became $250,000. The same money at the suburb's pace: $190,000. That is $60,000 more.
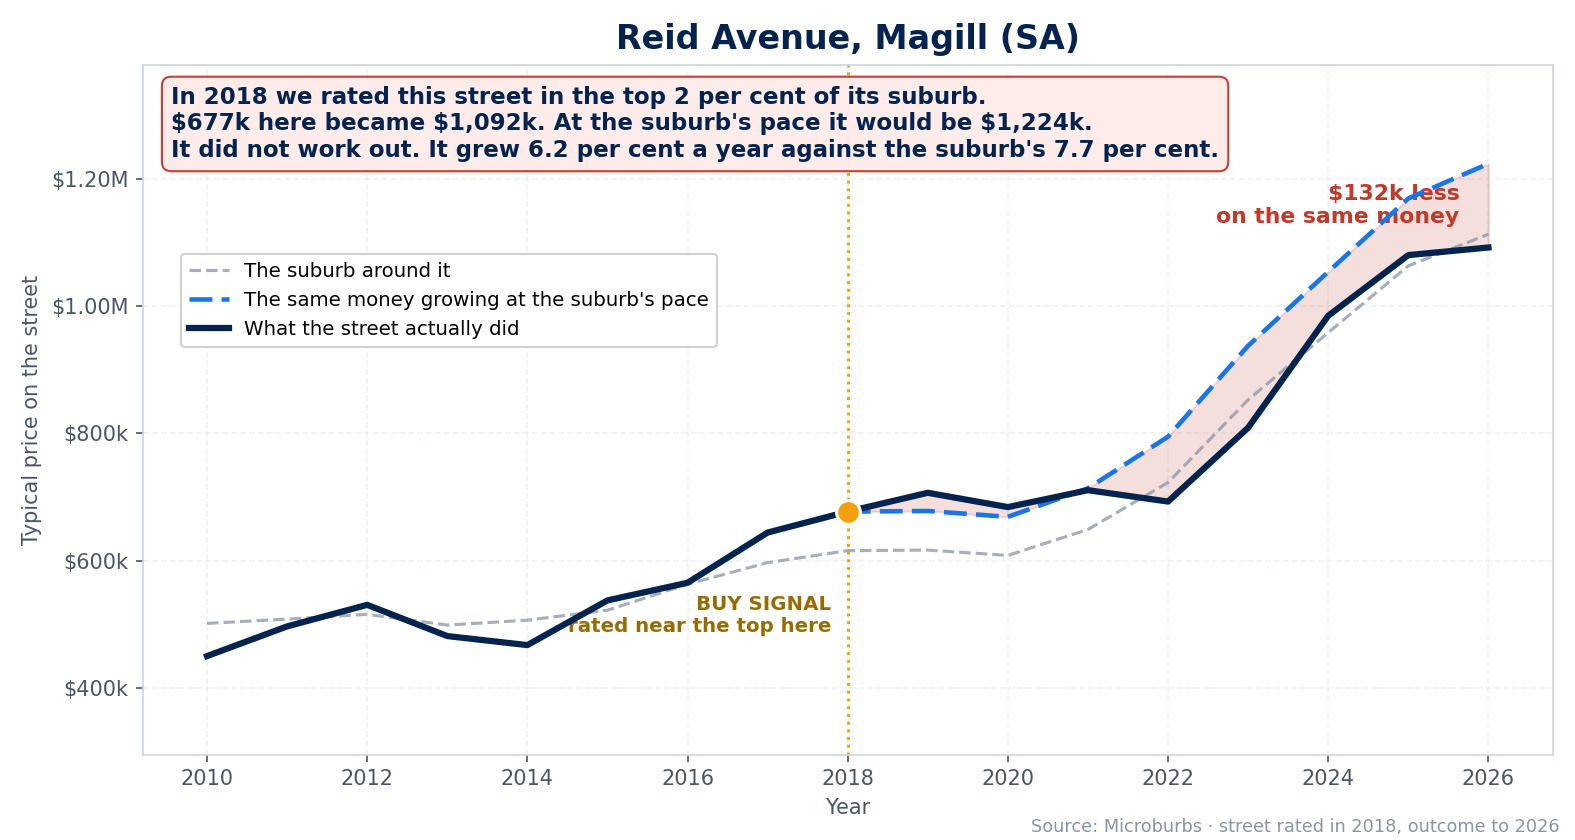
Reid Avenue, Magill (South Australia). $677,000 on this street became $1,092,000. The same money at the suburb's pace: $1,224,000. That is $132,000 less. It did not work out.
2 of these are misses and we have left them in. About three in ten of our best-rated streets finish behind their suburb. A strong rating shortens the odds, it does not guarantee the street you pick, still less one house on it. Weigh it alongside the home itself, what you pay for it, the rent it earns and your own advice.
Two homes in the same suburb, at the same price today, can drift hundreds of thousands of dollars apart over the years that follow. A lot of that gap comes down to the street. That is what our forecast reads, for every measurable street in Australia: whether it is set to outgrow the suburb around it or fall behind.
The street you buy on can matter as much as the suburb. A home on a street that outgrows its suburb can leave you far better off than a dearer home one block over. Paying up for the dearest street in a suburb is usually paying for growth that has already happened: only one in four of them went on to beat the suburb, against three in five of the cheapest streets.
Same suburb, same budget, different streets, different futures.
The dearer street is not always the smart buy. Caboolture sits on Brisbane's northern edge, with the typical home near $746,000. Among streets all priced under $800,000, the cheaper Kalunda Drive is tipped to beat the suburb over the four years ahead, while the dearer Charles Street is tipped to trail. Both are strongly backed calls.
| Street | Typical home price today | Above or below the suburb's typical price | Tipped growth over the next four years, against the suburb (to Dec 2030) |
|---|---|---|---|
| Kalunda Drive | $630k | -16% | +5% / yr faster |
| Charles Street | $671k | -10% | -7% / yr slower |
What it means: Kalunda Drive costs about $40,000 less than Charles Street, yet Kalunda Drive is tipped about 5 per cent a year ahead of Caboolture while Charles Street is tipped about 7 per cent behind. Put the same $650,000 into either street and the gap builds to about $360,000 over four years, and the stronger street is the cheaper one.
The cheaper street can be the stronger one. Mandurah is a Perth coastal city where the typical home sits near $592,000, well under our buyers' ceiling. Fifth Avenue and Eacott Street, both priced well below the suburb median, are tipped to beat the suburb over the four years ahead, while the dearer Mandurah Terrace is tipped to trail. All three are strongly backed calls.
| Street | Typical home price today | Above or below the suburb's typical price | Tipped growth over the next four years, against the suburb (to Dec 2030) |
|---|---|---|---|
| Mandurah Terrace | $765k | +29% | -5% / yr slower |
| Eacott Street | $552k | -7% | +4% / yr faster |
| Fifth Avenue | $557k | -6% | +5% / yr faster |
What it means: Mandurah Terrace costs the most of the three yet is tipped to grow slowest. Fifth Avenue is more than $200,000 cheaper and is tipped about 5 per cent a year ahead of the suburb. Run $555,000 forward at each street's tipped pace and Fifth Avenue finishes on the order of $240,000 ahead over four years. It is also the cheaper street to buy into.
Once you have a shortlist of suburbs, do not stop there. Look at the street. A home on a street that outgrows its suburb can leave you far better off than a dearer home one block over. Only one in four of the dearest streets in a suburb went on to beat it, so the dearest street is rarely the smart buy.
Before you offer, ask how the street is rated against the rest of its suburb, and how strongly that view is backed. Every street rating carries that strength alongside it, so you can tell a confident call from a weak one. The rating for your street is in its Microburbs suburb report.
See the forecast for your own street. Open the Microburbs suburb report for a suburb you know. Inside it, every street we can read is rated, and each one shows whether we tip it to beat or trail the suburb over the four years ahead. Most suburbs are covered. Start with one of these, all in the price range our buyers shop in.
Whalan (Sydney) · Werribee (Melbourne) · Morayfield (Brisbane) · Rockingham (Perth) · Salisbury (Adelaide)
This work was led by Luke Metcalfe at Microburbs Research. It forecasts growth for 324,918 streets across 7,053 suburbs, in every Australian state, out to December 2034. It covers houses, not units. We check ourselves the hard way: we make the call, wait, and then measure what those streets actually did. The four-year check counts outcomes through the end of 2025. The longest-running check, on streets rated in 2018 and followed for eight years, runs to 2026.
Open the Microburbs suburb report for anywhere you are looking. Every street we can read is rated against the rest of that suburb, so you can see which ones we tip to beat it and which to leave alone, before you make an offer.
