A suburb and bedroom count can hide very different homes. Here is the evidence for looking closer.
Armadale: local housing variety, with mixed infill
Armadale, Perth, WA. Deliberately selected photographed examples, with 2025–2026 listing records and ABS 2021 boundaries. They illustrate housing variety; they are not a random sample or every home in either block.
197 Seventh Road, Armadale, WA 3 bedrooms · 1 bathroom · 708 m² listed land A low brick house with a broad front garden, mature trees and a separate driveway along the side. Sold $655,000 · 2 December 2025 Source: archived listing. Camera date not supplied.Two adjoining blocks in Armadale. Blue A: 50009980000. Orange B: 50007550000. Shared boundary about 110 metres. Source: ABS 2021, Microburbs and OpenStreetMap.112C Fifth Road, Armadale, WA 3 bedrooms · 2 bathrooms · 229 m² listed land A compact single-storey home beside a shared driveway, with other similar homes visible behind it. Asking $625 per week · captured 1 February 2026 Source: archived listing. Camera date not supplied.
Both photographed homes have three bedrooms. The established house has one bathroom and 708 m² of listed land; the infill home has two bathrooms and 229 m². The land figure for 112C is its listed lot, not the wider parent parcel. These are individual examples, not different whole-block room medians.
A · Established housing sample
1975 1977 1978 1986
All four reported house years in block 50009980000. Median 1977.5.
197 Seventh Road itself has no verified construction year. Neither does the photographed 132 Fifth Road in the available descriptions.
B · A block with newer infill
1978 1995 2016 2016 2016
All five reported house years in block 50007550000. Median 2016.
112C Fifth Road has a direct “Built 2016” statement in its 5 November 2025 listing. Older houses remain in this block.
Construction source file dated 19 April 2026. The file date does not date each underlying listing. Eight of the nine house-year labels above have a matching construction phrase in available archived descriptions; 37 Sexty Street is explicitly marked as a source gap below. This pair is not included in the broader 2,777-pair age comparison because block A has fewer than five recorded house years.
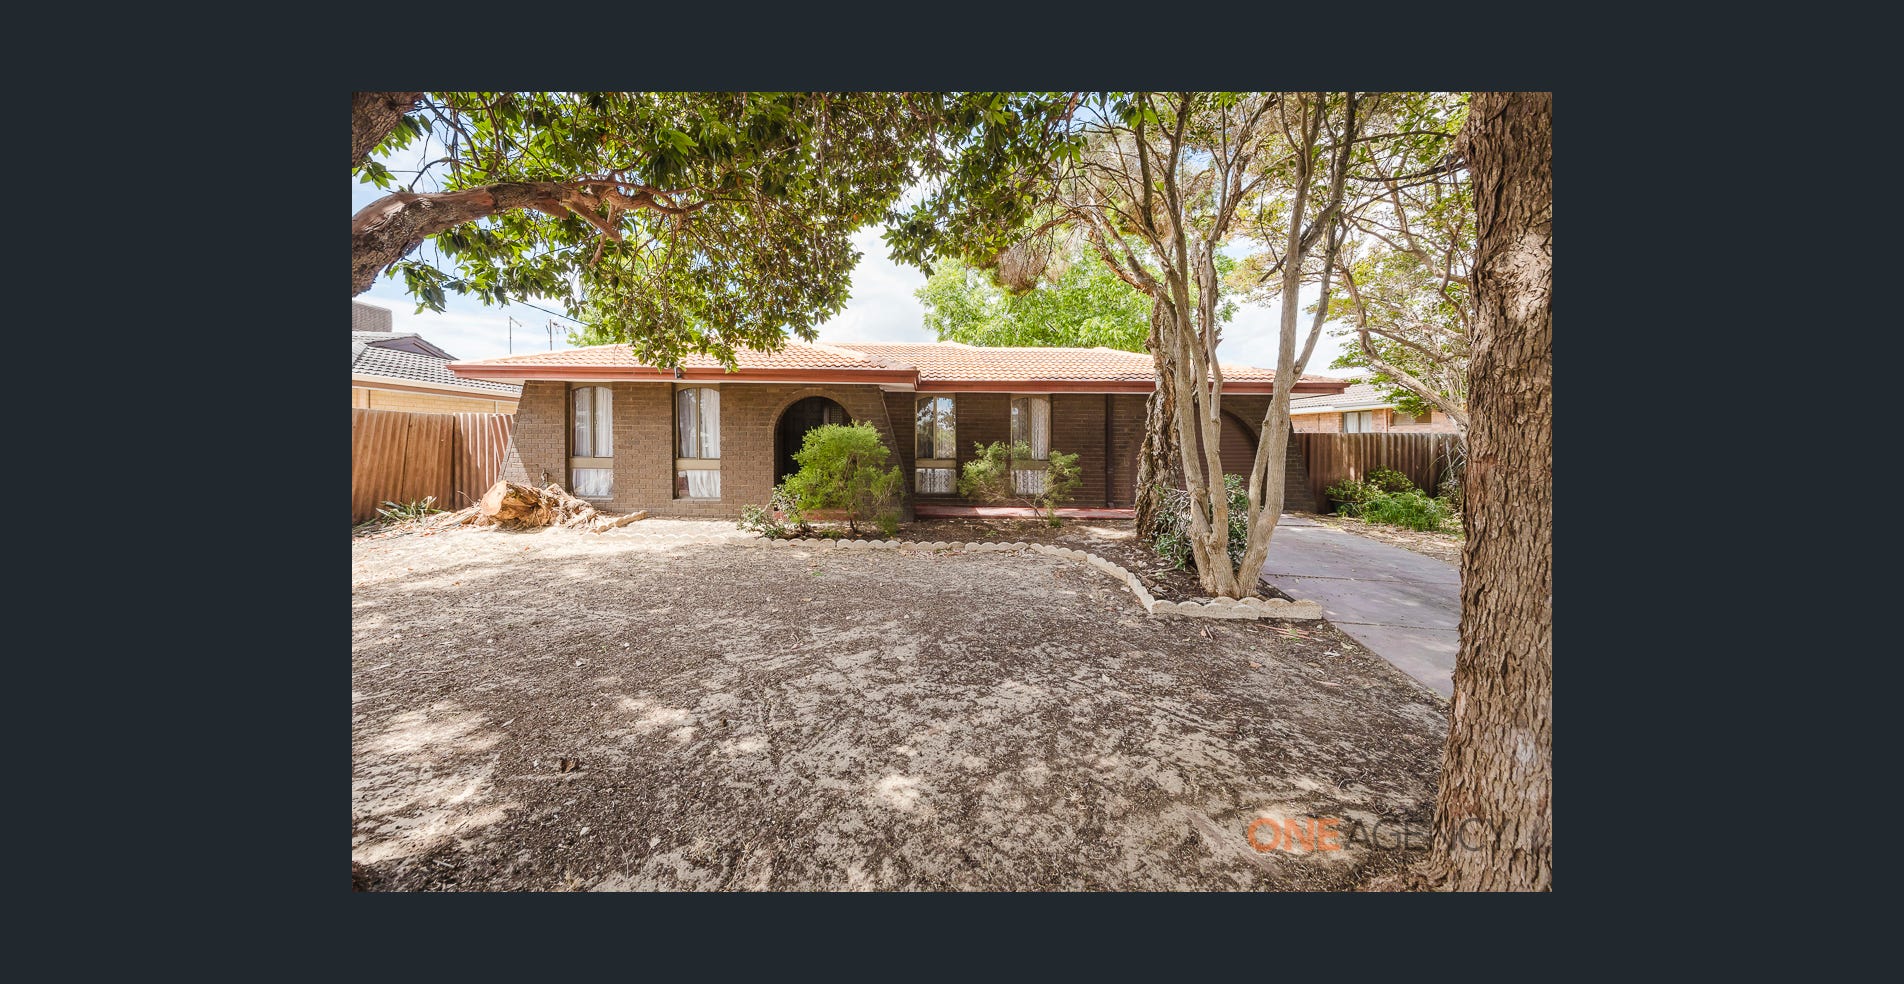
132 Fifth Road, Armadale, WA 3 bedrooms · 1 bathroom A single-storey brick house on an open lot with a broad front lawn and a long driveway beside the home. Asking $570 per week · captured 6 July 2026 Source: archived listing. Camera date not supplied.104 Fifth Road, Armadale, WA 3 bedrooms · 1 bathroom An established single-storey brick home with arched front openings, two garage doors and a paved driveway. Sold $525,000 · 25 July 2025 Source: archived listing. Camera date not supplied.
132 Fifth Road repeats the established brick-house form. 104 Fifth Road shows an older home remaining in the infill block. A mesh block can contain a recurring housing form and still be mixed.
Wider available Armadale house-listing sample: both blocks have a three-bedroom, one-bathroom median.
Armadale block, 2021
Distinct houses with room records
Median bedrooms
Median bathrooms
Retained listing dates
50009980000
19
3
1
16 August 2016 to 15 July 2026
50007550000
13
3
1
20 March 2018 to 21 January 2026
This local source check uses the wider available dated house listings, with the latest retained listing for each address. It is separate from both the April construction-year source and the national 2023–2026 room-count sample.
Armadale construction sources: all 9 reported-year houses
Each row is a distinct address. These dates identify available corroborating listings, which can be earlier or later than the construction-year file dated 19 April 2026. They are not a recovered date range for that file. Floor areas are recorded sample values in square metres, not measured anew. A missing quotation is shown explicitly.
The neighbouring Pace Road and Nannup Street blocks separate a 1950s cohort from a 2015 cohort. This example was selected because the reported years and address-registration history make the contrast unusually clear.
Medina, Perth, WA. Blue A is block 50181250000; orange B is 50181240000. The real 2021 boundaries share about 316 metres. Each dot locates a sampled house. Source: Microburbs, ABS 2021 and OpenStreetMap.
A · Pace Road
1953
Median reported year, five houses. Years: 1953, 1953, 1953, 1955 and 1965.
51 current address records. None first registered from 2015.
B · Nannup Street
2015
Median reported year, ten houses. One 2014, eight 2015 and one 2016.
77 current address records. All first registered from 2015.
Construction file dated 19 April 2026; address source held in May 2026, with national creation-date coverage through 21 April 2026. The 128 address records and 15 reported-year houses are different populations.
All 15 available house-year observations in these two blocks. No predicted years. The reported-year source file is dated 19 April 2026; each available corroborating listing has its own date below.
All 15 reported construction years have a matching phrase in an archived listing description. This is stronger evidence of different housing cohorts than address-registration dates alone. Registrations can reflect new addresses, subdivisions or administrative changes, so they are not construction dates. These counts cover current matched address records, not every historical address or every completed dwelling.
Medina construction sources: all 15 reported-year houses
Each row is a distinct address. These dates identify available corroborating listings, which can be earlier or later than the construction-year file dated 19 April 2026. They are not a recovered date range for that file. Floor areas are recorded sample values in square metres, not measured anew. A missing quotation is shown explicitly.
Broader evidence: closer house ages within a block
Average gap between two reported construction years
Within the same mesh block
11.0 years
Across adjoining mesh blocks
13.8 years
21,828 houses; 2,777 adjoining pairs; 451 suburbs. Each suburb contributes equally. Source file dated 19 April 2026; ABS 2021 boundaries.
House ages were about 20% closer within the same block in this sample.
The comparison uses actual listing-reported years, with each address counted once. It supports local housing similarity on average. It does not mean every neighbouring block is different, or every home within a block is alike.
Only 199 of 2,777 pairs had block medians at least 20 years apart. The median neighbouring gap was two years. Medina is a deliberately strong illustration, not the typical gap.
Separate samples for each measure. Each side of a pair needs at least five observations of that measure.
Measure
Housing included
Distinct properties
Blocks
Adjoining pairs
Suburbs
Larger contrasts
What counts as larger
Bedrooms
All housing types
27,121
3,114
2,567
544
822 pairs (32.0%)
At least one room in block medians
Bathrooms
All housing types
27,280
3,132
2,582
547
547 pairs (21.2%)
At least one room in block medians
Construction year
Houses only
21,828
3,139
2,777
451
199 pairs (7.2%)
At least 20 years in block medians
Why the sample counts differ
Bedrooms and bathrooms: the source contains dated listings from 1 January 2023 to 10 February 2026, reduced to distinct address observations. Inferred-date records are excluded, housing labels are grouped, and building-level apartment addresses are excluded where a unit address is also represented. A valid address-to-2021-block match is required. Bedroom and bathroom availability differ. These comparisons include houses, apartments and townhouses and require at least one metre of shared boundary.
Construction years: the much wider source contains 2,118,045 address rows, but only 201,027 have a reported year. After address, year-range and conflicting-year checks, 196,492 reported-year address records remain, including 146,468 records labelled houses with no unit identifier. The adjoining comparison includes 21,828 of those houses, in blocks with at least five recorded years and at least ten metres of shared boundary. No predicted construction year is used.
The construction-year source file is dated 19 April 2026. Its original listing-date range was not preserved in the aggregate. It must not be described as the 2023–2026 room-count sample, a current building inventory or council-certified construction history. Reported years may be approximate, wrong or refer to a rebuilt home.
Coverage is concentrated in Western Australia
Western Australia contributes 13,899 of the 21,828 houses (63.7%) in the adjoining age comparison. The source reaches several states, but coverage and attribute availability are uneven. Equal weighting of suburbs does not turn it into a representative national estimate.
State or territory
Houses in the adjoining age comparison
Share
WA
13,899
63.7%
SA
3,472
15.9%
QLD
3,351
15.4%
TAS
742
3.4%
NSW
208
1.0%
VIC
124
0.6%
ACT
32
0.1%
How the within-block and across-block averages are compared
For each adjoining pair, compare the absolute year differences between every pair of distinct houses within each block. Average the two within-block results. Separately compare every house on one side with every house on the other. Average those results within each suburb, then give each suburb equal weight.
Houses within the same block are generally closer in physical distance too. This comparison does not isolate the effect of the drawn boundary from distance, subdivision history or development patterns. It does not test a valuation or rental model, and it does not establish that mesh blocks outperform distance-matched areas or another small-area system.
Minimum houses per block
Pairs
Suburbs
Distinct houses
Within-block gap
Across-block gap
5
2,777
451
21,828
11.0 years
13.8 years
8
290
109
4,545
4.4 years
6.3 years
10
79
39
1,790
3.1 years
4.3 years
Higher minimums leave much smaller, different samples. Their results are sensitivity checks, not directly comparable representative estimates.
Armadale and Corio: a photographed stock comparison
Single-storey brick houses with tiled roofs, front gardens and three-bedroom, one-bathroom layouts appear in both Perth and Geelong. These two homes were selected to make that physical resemblance visible.
197 Seventh Road, Armadale, WA 3 bedrooms · 1 bathroom · 708 m² listed land A low brick house with a broad front garden, mature trees and a separate driveway along the side. Sold $655,000 · 2 December 2025 Source: archived listing. Camera date not supplied.Armadale, Perth, WA. The photographed 197 Seventh Road sits in ABS 2021 block 50009980000. Source: Microburbs, ABS 2021 and OpenStreetMap.
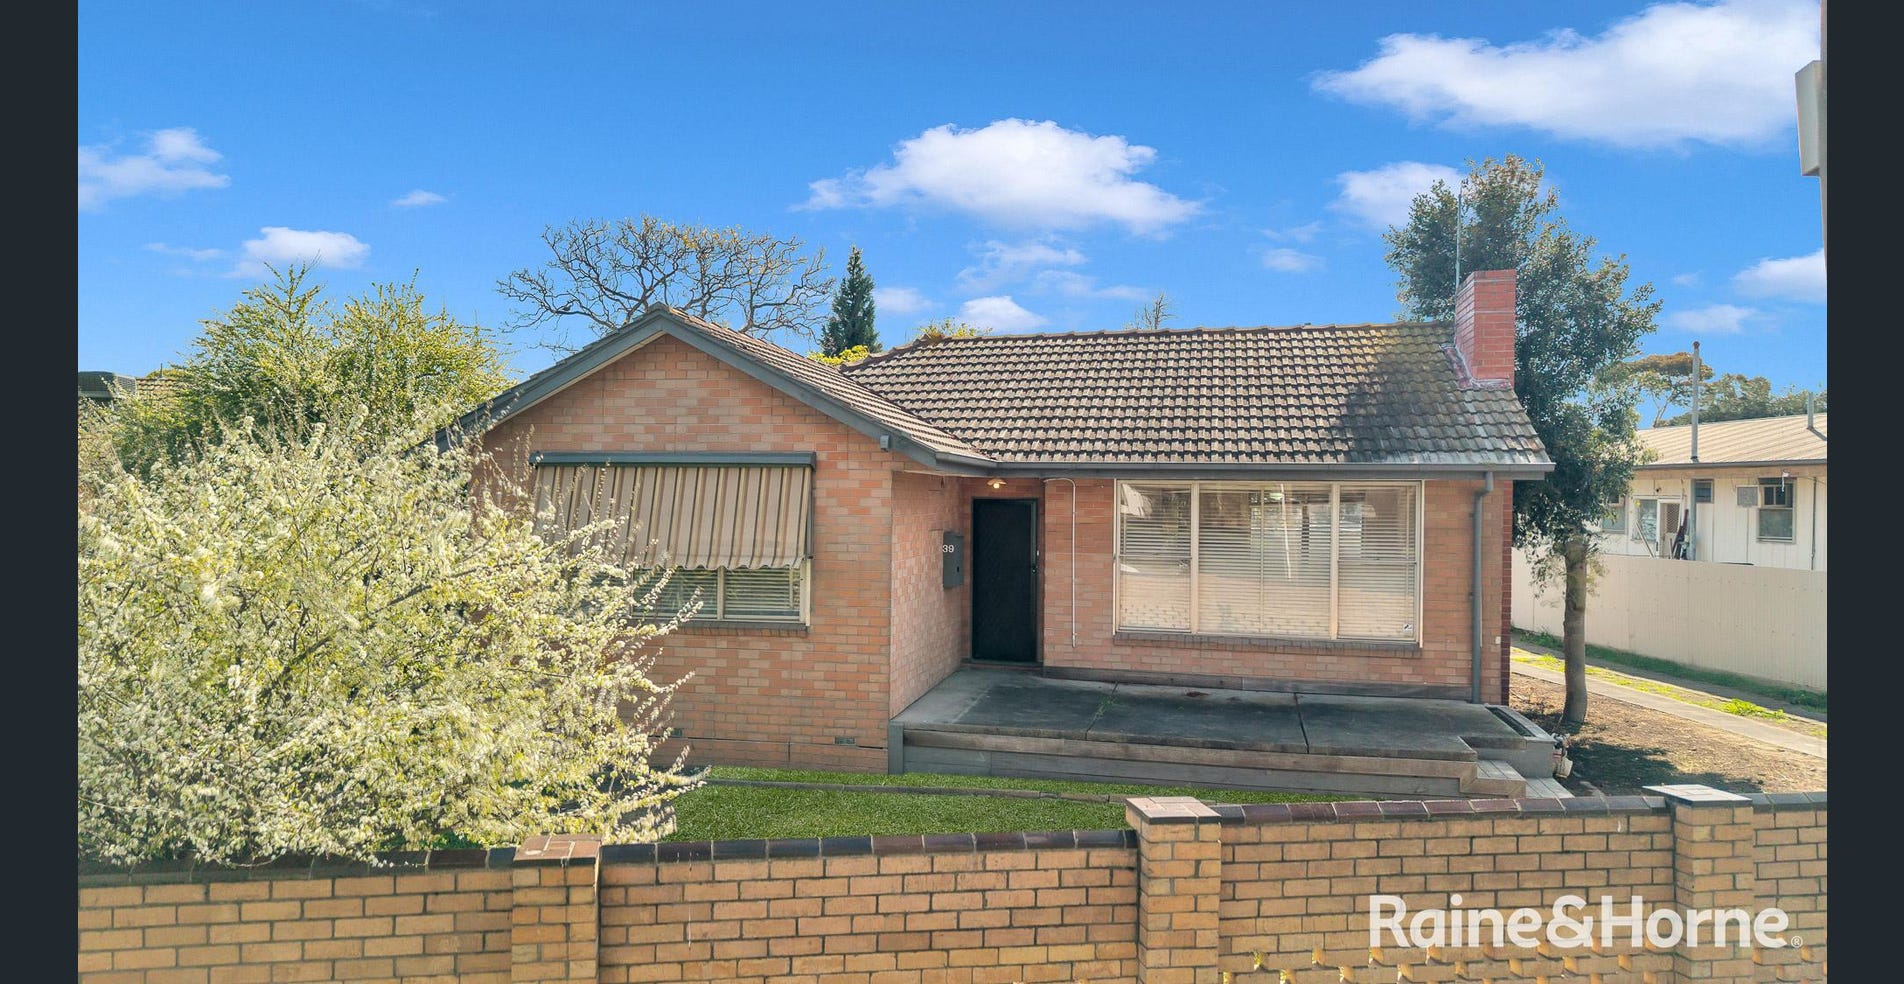
39 Bacchus Marsh Road, Corio, VIC 3 bedrooms · 1 bathroom · 618 m² listed land A single-storey exposed-brick house with a tiled roof, brick chimney, broad front windows and a front garden. Sold $500,000 · 25 September 2025 Source: archived listing. Camera date not supplied.Corio, Geelong, VIC. The photographed 39 Bacchus Marsh Road sits in ABS 2021 block 20239680000. Source: Microburbs, ABS 2021 and OpenStreetMap.
Both homes have three bedrooms and one bathroom. Their listed land sizes are 708 m² in Armadale and 618 m² in Corio. Neither photographed property has a verified construction year, so this comparison makes no claim that they were built in the same year or decade.
Both surrounding block samples also have medians of three bedrooms and one bathroom. That provides local room-count context; it does not establish that all houses in either block have the same appearance, age or condition.
Available house-listing observations around each photographed home, checked 9 September 2026.
Suburb and 2021 block
Retained houses
Usable bedroom counts
Usable bathroom counts
Median bedrooms / bathrooms
Retained listing dates
Armadale, WA 50009980000
19
19
19
3 / 1
16 August 2016 to 15 July 2026
Corio, VIC 20239680000
25
23
24
3 / 1
29 April 2015 to 16 June 2026
These are the latest retained source-dated listings for distinct house addresses with no unit identifier. Missing room counts are excluded from that room’s median. This local comparison uses wider historical records than the national 2023–2026 room-count analysis.
Physical resemblance is not price equivalence. The Armadale sale was $655,000 on 2 December 2025; the Corio sale was $500,000 on 25 September 2025. They are different properties, dates and markets. Their resemblance can inform research into building form, maintenance and competing stock, but it does not make them interchangeable valuation comparables or explain the difference in sale prices.
The photographs are selected examples, not a random sample or images of every home in the blocks. The separate Medina–Clarkson comparison matches reported construction years and floor areas; it answers a different housing-similarity question.
All 44 retained house-room observations in the photographed comparison
Each row identifies the address, source listing date and usable room counts. The two featured sale dates above come from their photographed listing records; the dates below are the retained room-source listing dates.
Medina and Clarkson: similar physical stock across suburbs
The two selected Perth blocks have the same median reported construction year and floor area: 2015 and 112 m². Their centres are 59.9 km apart in a straight line.
Medina block 50181240000: ten houses with years and ten recorded floor areas. Clarkson block 50391659000: eleven houses with years and eight floor areas. Both local maps span 600 metres. Source: April 2026 reported-year and floor-area file, ABS 2021 and OpenStreetMap. These blocks were selected as a clear physical-stock match.
The wider scan found 812 qualifying cross-suburb matches among 860 eligible blocks. Blocks needed at least eight reported-year houses, five floor areas and a reasonably concentrated construction period. Matched blocks are in different suburbs within the same state, at least three kilometres apart, with median years no more than three years apart and median floor areas within 15%.
Similar building age and size can help investigate maintenance, dwelling form and competing supply. It does not establish equal rents, equal prices, similar residents or interchangeable valuation comparables. Location, land, condition, schools and market date still matter.
All ten Medina year labels have direct construction phrases. Nine of the eleven Clarkson labels do; 19 and 23 Perkins Drive are retained and marked as quotation gaps in the table.
Medina–Clarkson construction sources: all 21 reported-year houses
Each row is a distinct address. These dates identify available corroborating listings, which can be earlier or later than the construction-year file dated 19 April 2026. They are not a recovered date range for that file. Floor areas are recorded sample values in square metres, not measured anew. A missing quotation is shown explicitly.
Clyde North: observed population differences at the right geography
The 2021 Census area containing Selandra Rise Retirement Village had a median age of 74. The neighbouring Census area had a median age of 30.
Clyde North, Melbourne, VIC. Selected because one Census area exactly equals the village-containing mesh block. Orange: 20632001470. The highlighted blue neighbour is 20631984520, within the full pale-blue four-block Census area. Shared boundary about 156 metres. Source: ABS 2021 and OpenStreetMap.
The orange block also includes ordinary houses on Nunkeri Court. Its figures describe all usual residents of the 2021 area, not just village residents. The blue figures describe all four constituent blocks, not the highlighted neighbour alone.
At mesh-block level the ABS publishes total usual-resident population and dwelling counts. Detailed observed demographics normally use Statistical Areas Level 1, or SA1s. Only when an SA1 is one mesh block can those figures describe that exact mesh block as well. This example demonstrates historical area differences, not similarity between all individuals or today’s residents.
Microburbs also creates estimated mesh-block demographics. Those estimates can add context when clearly labelled, but they were not used as independent proof that people within a block are alike. Income, age or tenure is not evidence of an individual’s safety or behaviour.
What this changes for property research
Armadale, Perth, WA. The same two local areas used in the photographed comparison. Source: Microburbs, ABS 2021 and OpenStreetMap.
112C Fifth Road 3 bedrooms · 2 bathrooms · 229 m² listed land
$667,924
These are Microburbs modelled estimates, not sale prices. Similar estimated prices can describe different housing. They are shown to explain why a valuation needs the property and local context, not to establish a boundary premium or a measured accuracy improvement.
Use
How the smaller area helps
What still needs checking
Rental valuation
Find rental stock with similar rooms, dwelling form and local setting. The 112C Fifth Road example asked $625 per week, captured 1 February 2026.
Achieved leases, condition, listing date and current competition. An asking rent is not an achieved lease.
Home valuation and comparative market analysis (CMA)
Explain why selected sales resemble the home. Search beyond the block or suburb where similar stock is scarce.
Sale date, land, size, condition and location differences. No reduction in prediction error has been measured here.
Safety and environmental checks
Attach detailed road, flood or environmental evidence to the address and local map.
Use each source at its supported resolution. A boundary shape, income or tenure measure is not a measured hazard or a judgement about individuals.
Development and supply
Distinguish established houses, infill and estates within a suburb; examine address additions.
Address creation does not prove construction or completion. Use building and planning evidence too.
Local demand and services
Compare historical household mixes across appropriately defined Census areas.
Keep the Census period, area extent and observation-versus-estimate label.
Portfolio and API reporting
Use an official small-area code and boundary edition to connect local evidence across many properties.
Keep source dates and geography editions. A consistent identifier does not make every input equally reliable.
Why the shape of the block matters
Footscray, Melbourne, VIC. Selected long housing strip beside Buckley Street, ABS 2021 block 20377652000. Its enclosing rectangle is roughly 560 by 70 metres. Source: ABS 2021 and OpenStreetMap.Doubleview, Perth, WA. Selected main-road and rear-lane example, ABS 2021 block 50288270000. Source: ABS 2021 and OpenStreetMap.
Roads, access, land use and property boundaries can make one group of homes share a setting. These selected strips demonstrate actual shapes, not a measured traffic, noise, safety or price effect. The ABS mesh-block design guidance also addresses communities with shared access, housing complexes and physical barriers.
2026 mesh blocks: a new boundary edition, not new Census results
The ABS released the Edition 4 main structure on 22 July 2026. Mesh blocks form the smallest part of its nested main hierarchy: mesh block → SA1 → SA2 → SA3 → SA4 → state or territory → Australia. ABS approximations of suburbs, postal areas and council areas also use mesh blocks, with their own structure and release dates.
That official standard makes detailed data easier to connect and aggregate. Suburb and postcode names remain useful for orientation. A mesh-block code plus its boundary edition preserves a more explicit geographic reference. It is a statistical geography, not a property title or a legal planning boundary.
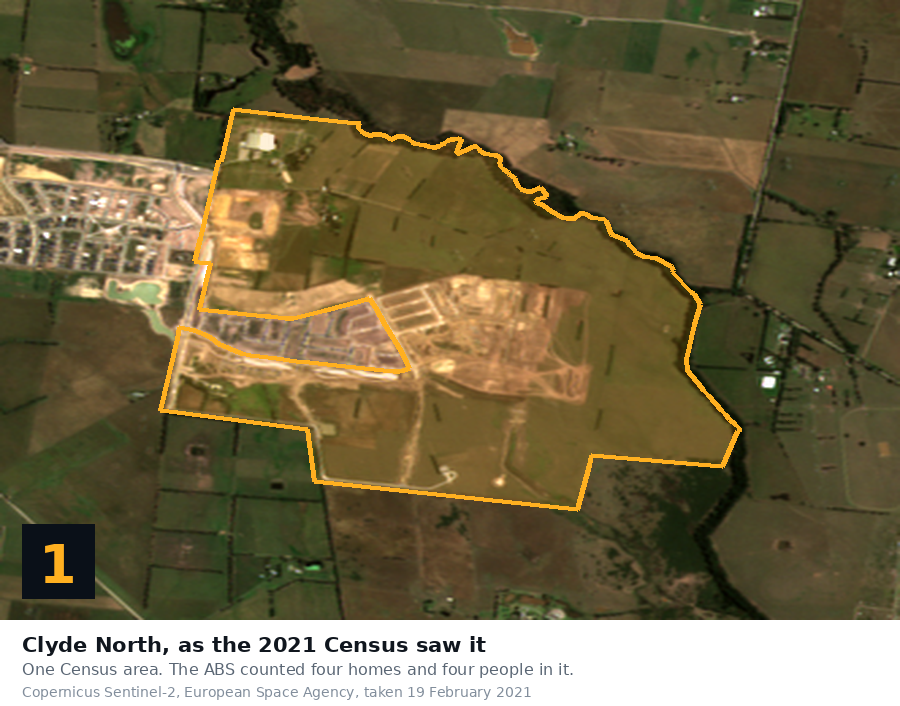
Clyde North, VIC: 19 February 2021 satellite acquisition. Selected before-and-after view of the same developing land. Earlier 2021 boundary footprint. Source: Microburbs, Sentinel-2 and ABS.
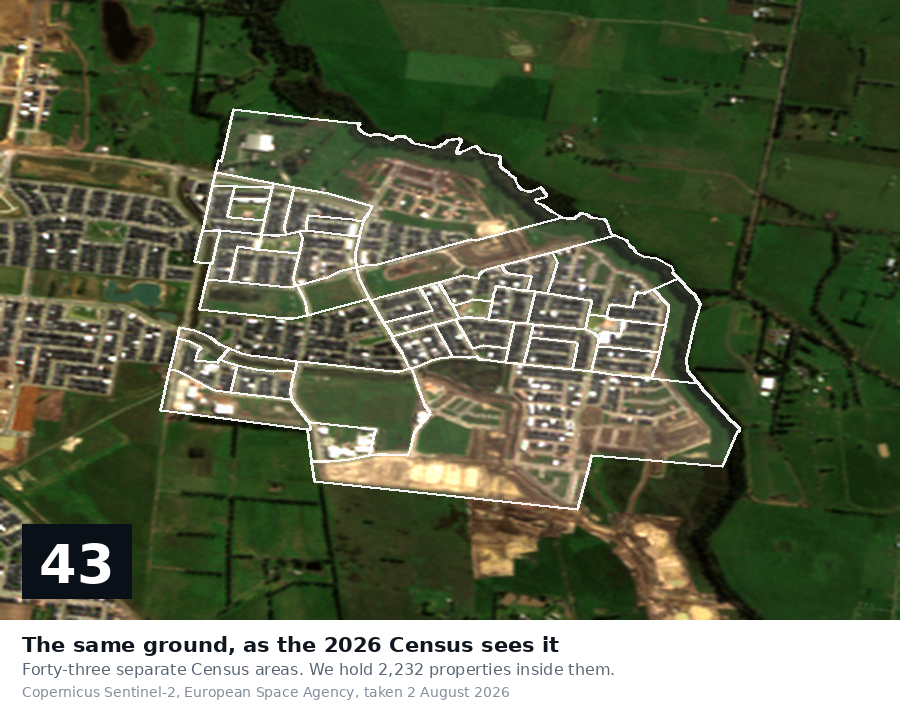
The same area: 2 August 2026 satellite acquisition. Development and the more detailed 2026 geography are visible. Source: Microburbs, Sentinel-2 and ABS.
The official 2021-to-2026 correspondence contains 43 successor rows for the selected Clyde North 2021 block 21327400000. This is a boundary correspondence count, not 43 new developments or a count of people. The imagery dates, boundary editions and observation periods are separate facts.
All new adjoining housing and construction-year comparisons in this note use 2021 boundaries. The Clyde North satellite example separately compares 2021 and 2026 geography. An unchanged code alone does not guarantee an unchanged footprint. The ABS release plan schedules the first 2026 Census results for June 2027.
Microburbs API access
Microburbs holds the 2026 boundary data. The public mesh-block polygon documentation currently describes 2021 boundaries, and the property context documentation describes local block information. Holding the 2026 data does not establish a documented live 2026 endpoint.
API documentation and research checked 9 September 2026. No 2026 Census demographic results or undocumented API response are announced here.
What the evidence supports
Mesh blocks provide a common official way to preserve local detail. The observed house-year sample is more similar within blocks on average, while selected maps show substantial diversity inside one suburb and similar physical stock across different suburbs.
The research does not establish universal homogeneity, a causal effect at the boundary, improved valuation accuracy or person-level similarity. Listing coverage is incomplete and uneven. Source dates, property condition and the exact location still belong in a sound property comparison.