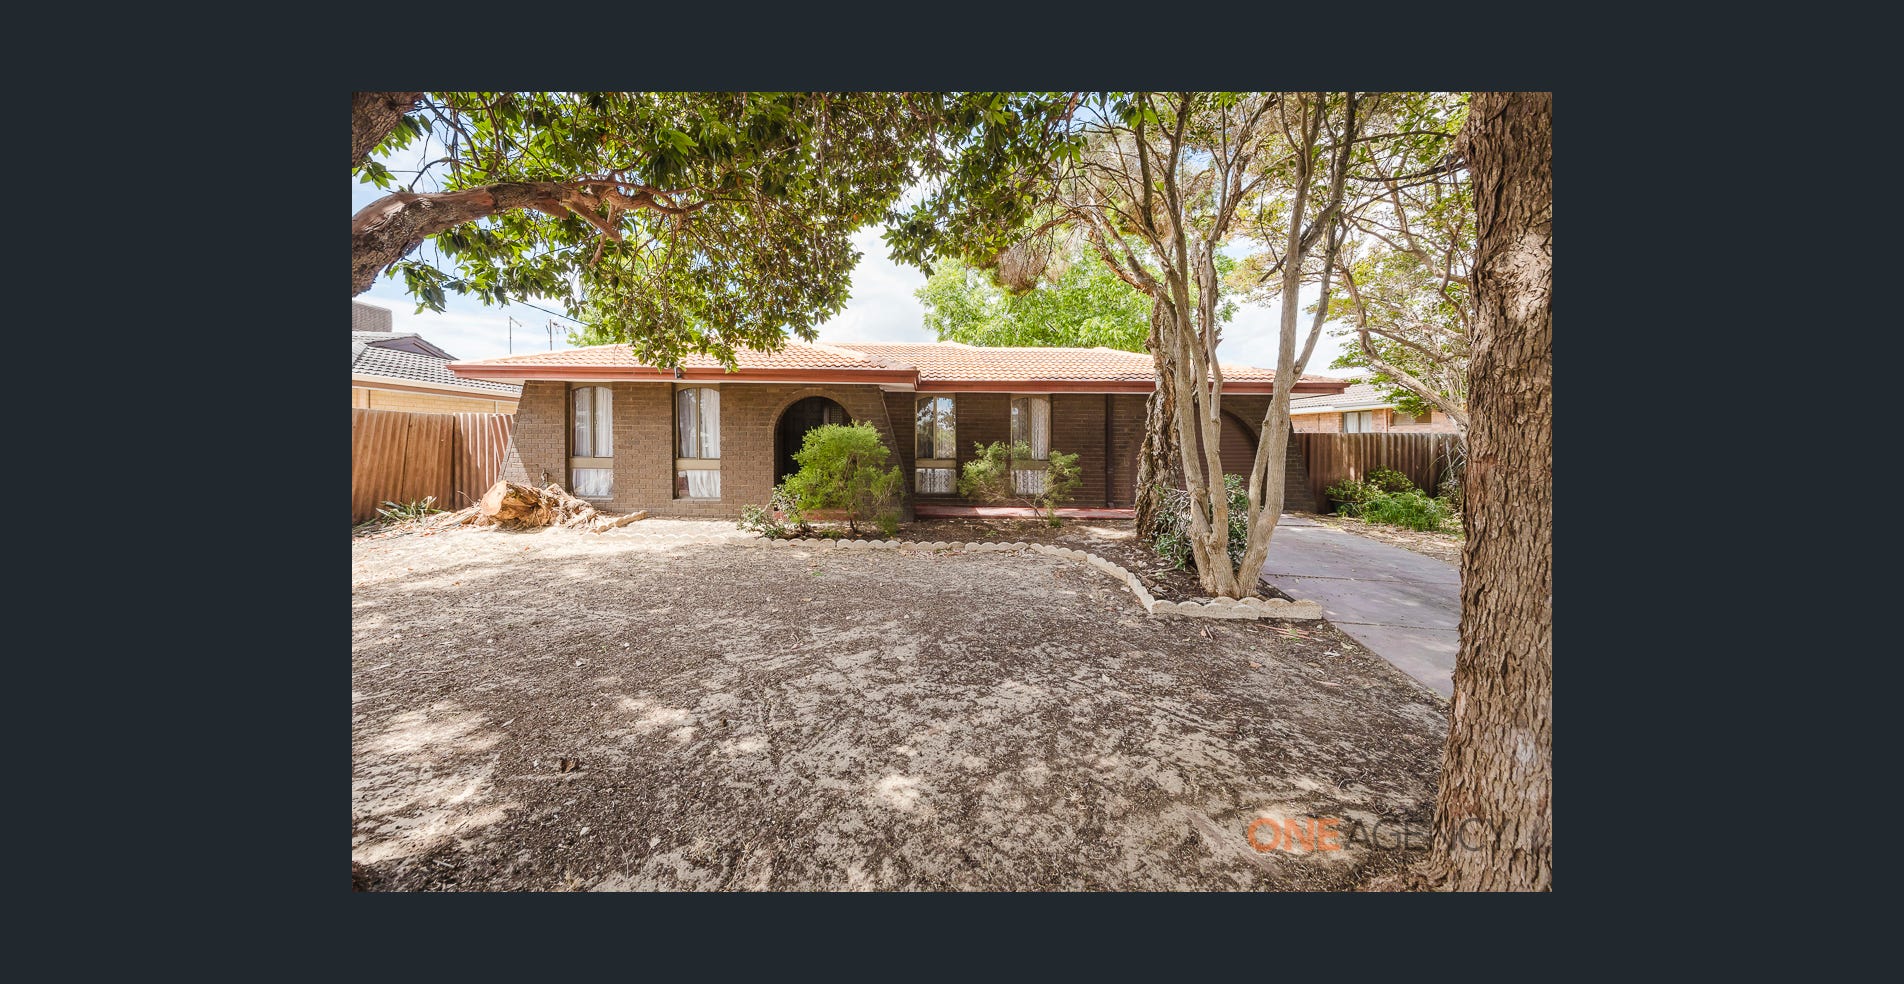
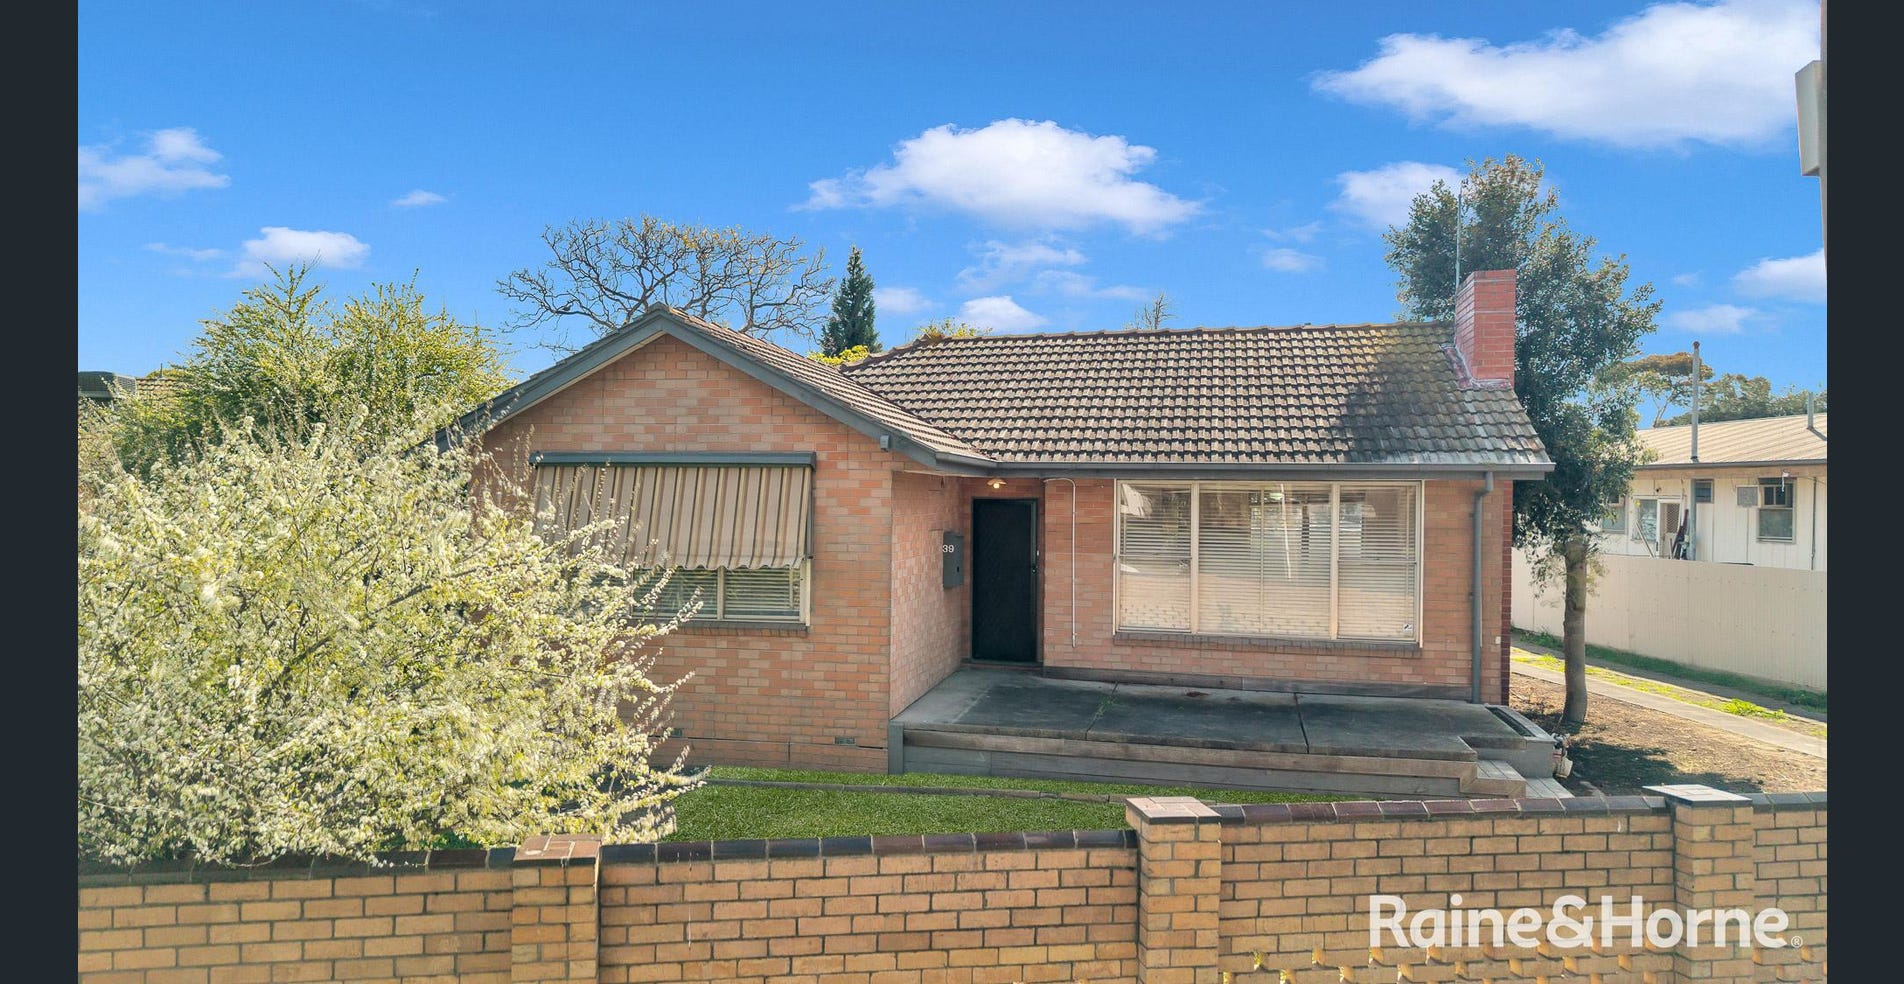
One suburb can contain apartment precincts and large family homes. Mesh blocks, the smallest areas used by the Australian Bureau of Statistics, make those local differences easier to see.
Two mapped housing pockets in Epping, Sydney, NSWSelected real exteriors, dated listing facts and 2021 mesh blocks
Why this one: A clear apartment-versus-family-house contrast, supported by the wider recorded stock in each block.
A · Apartment precinct
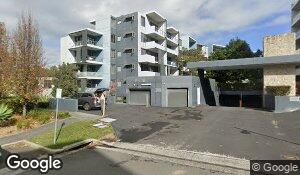
371/5 Epping Park Drive, Epping, NSW
2 bedrooms · 2 bathrooms
Sold $765,800 · 15 Aug 2025
Street-level exterior of the Epping Park apartment complex, with stacked balconies and shared vehicle access. This is the building exterior, not a view inside Unit 371.
94% have 1–2 bedrooms215 of 228 recorded homes in this block.
Source: Microburbs · Google exterior. Saved photo and dated listing facts. Camera date not supplied.
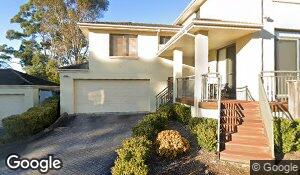
A detached two-storey home with a double garage, front steps and a landscaped entrance.
86% have 4+ bedrooms25 of 29 recorded homes in this block.
Source: Microburbs · Google exterior. Saved photo and dated listing facts. Camera date not supplied.
What you see
The apartment precinct is 231 apartments out of 232 observed homes. The family-house pocket is 29 houses out of 31. The photographs show examples of those different building forms.
What it means
A suburb name alone is a weak rule for choosing comparable sales or rental stock. Start with the kind of home and its local housing pocket.
Epping block A: retained listing records 16 Dec 2015–7 Jul 2026. Block B: 22 May 2016–25 Mar 2026. One dated housing record per observed address. These are selected clear contrasts, not a census of every home. Street images show exteriors and retain Google attribution.
Inspect the mapped properties and every source count →
How many suburbs contain sharply different homes?
42% of the suburbs in our test contained blocks with sharply different bedroom, bathroom or combined room profiles. This is a count of suburbs containing a contrast, not a claim about the same percentage of homes.
42%
2,079 of 4,910 qualifying suburbs
At least one pair of blocks met one of the large-difference definitions alongside.
5,779,724 property profiles across 171,195 blocks. At least 20 complete room profiles per block, 100 per suburb and two eligible blocks. Property-profile extract: 7 April 2026. Underlying observation dates are unavailable. ABS 2021 boundaries.
Bedroom mix: at least 70% of homes have 0–2 bedrooms in one block, while at least 70% have 4+ in another. 1,007 suburbs (21%).
Bathroom mix: at least 80% have one bathroom in one block, while at least 80% have two or more in another. 1,899 suburbs (39%).
Combined profile: at least 60% have 0–2 bedrooms and one bathroom in one block, while at least 60% have 4+ bedrooms and two or more bathrooms in another. 1,128 suburbs (23%).
The three groups overlap, so their percentages must not be added. This is a defined test of our available property profiles. Requiring at least 30 profiles per block gives 39% of qualifying suburbs, while 50 gives 27%. The minimum sample changes which smaller housing pockets can be included.
See the full denominators, definitions and sensitivity checks →
Can this happen even when you compare houses?
Yes. Werribee contains an established pocket dominated by three-bedroom homes and an estate where four-plus bedrooms and two-plus bathrooms dominate. “House in Werribee” still combines different stock.
A · Established housing
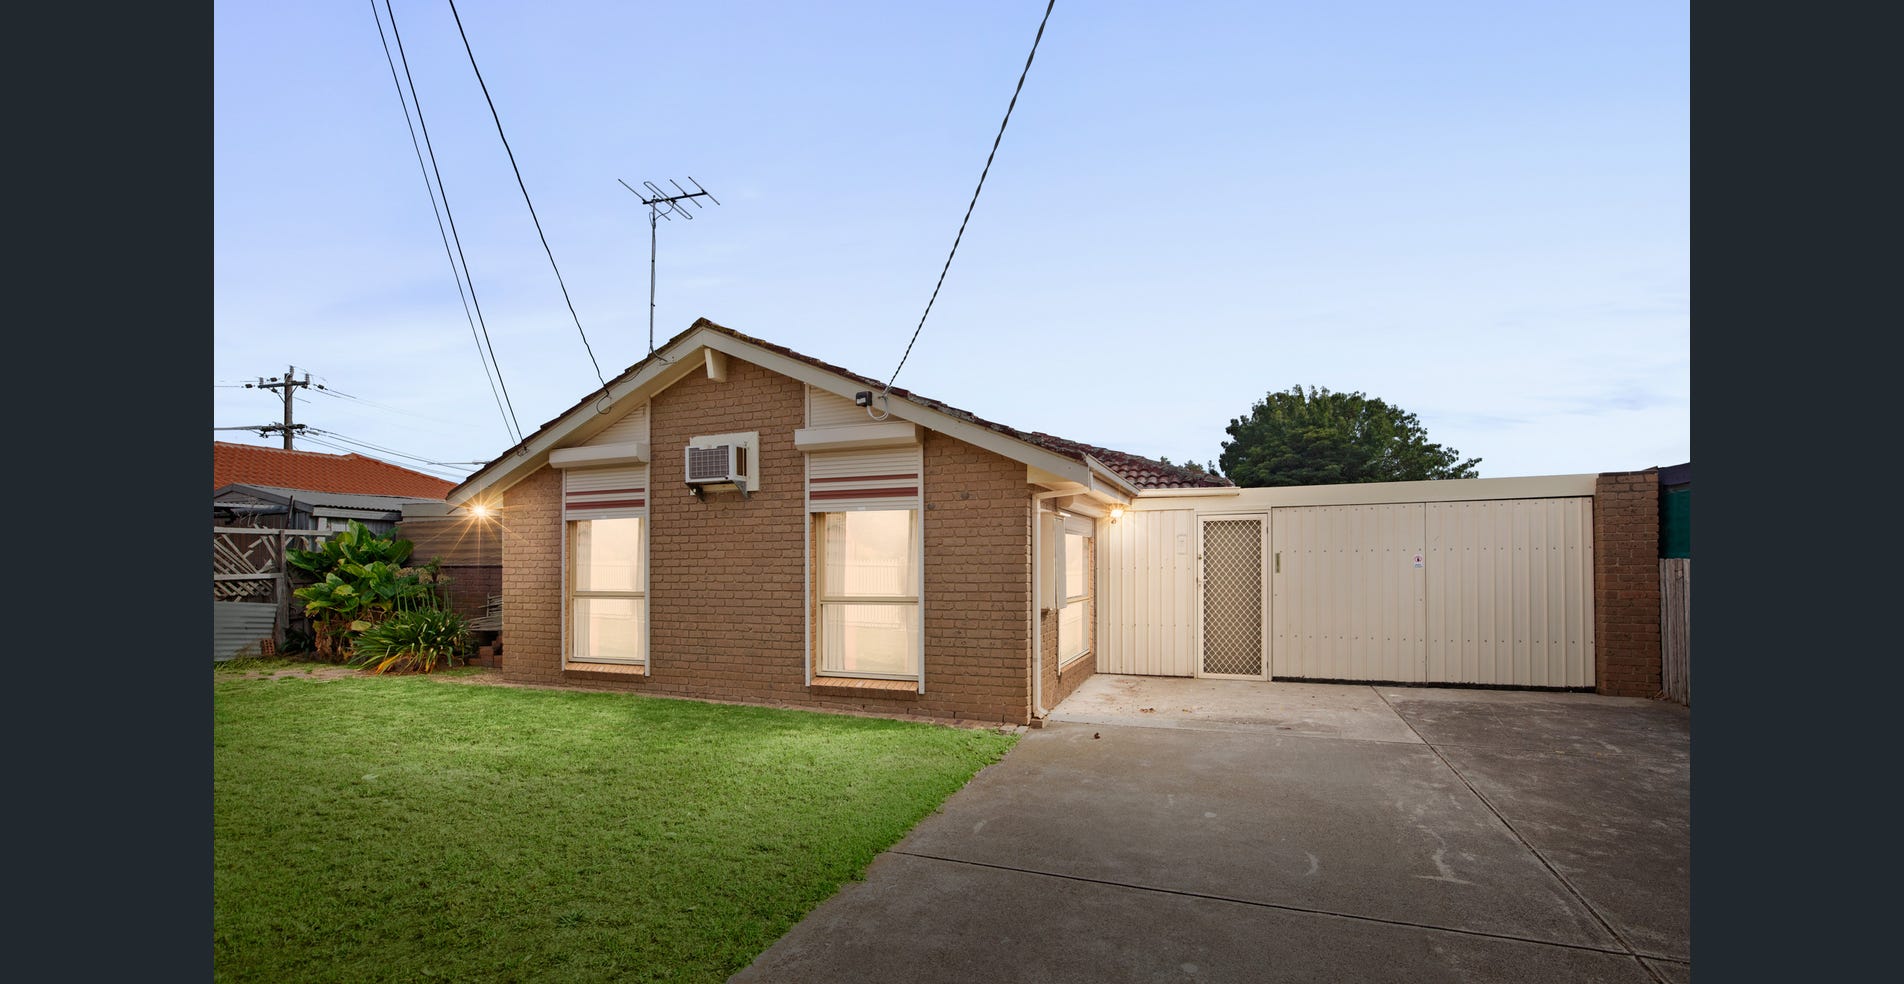
223 Shaws Road, Werribee, VIC
3 bedrooms · 1 bathroom · 529 m²
Sold $555,000 · 1 May 2026
An established detached brick home with a tiled roof, front lawn and a driveway beside the house.
17% have 4+ bedrooms3 of 18 houses with recorded bedrooms. 13 of 18 have one bathroom.
Source: Microburbs · Listing photograph. Saved photo and dated listing facts. Camera date not supplied.
B · Larger family housing
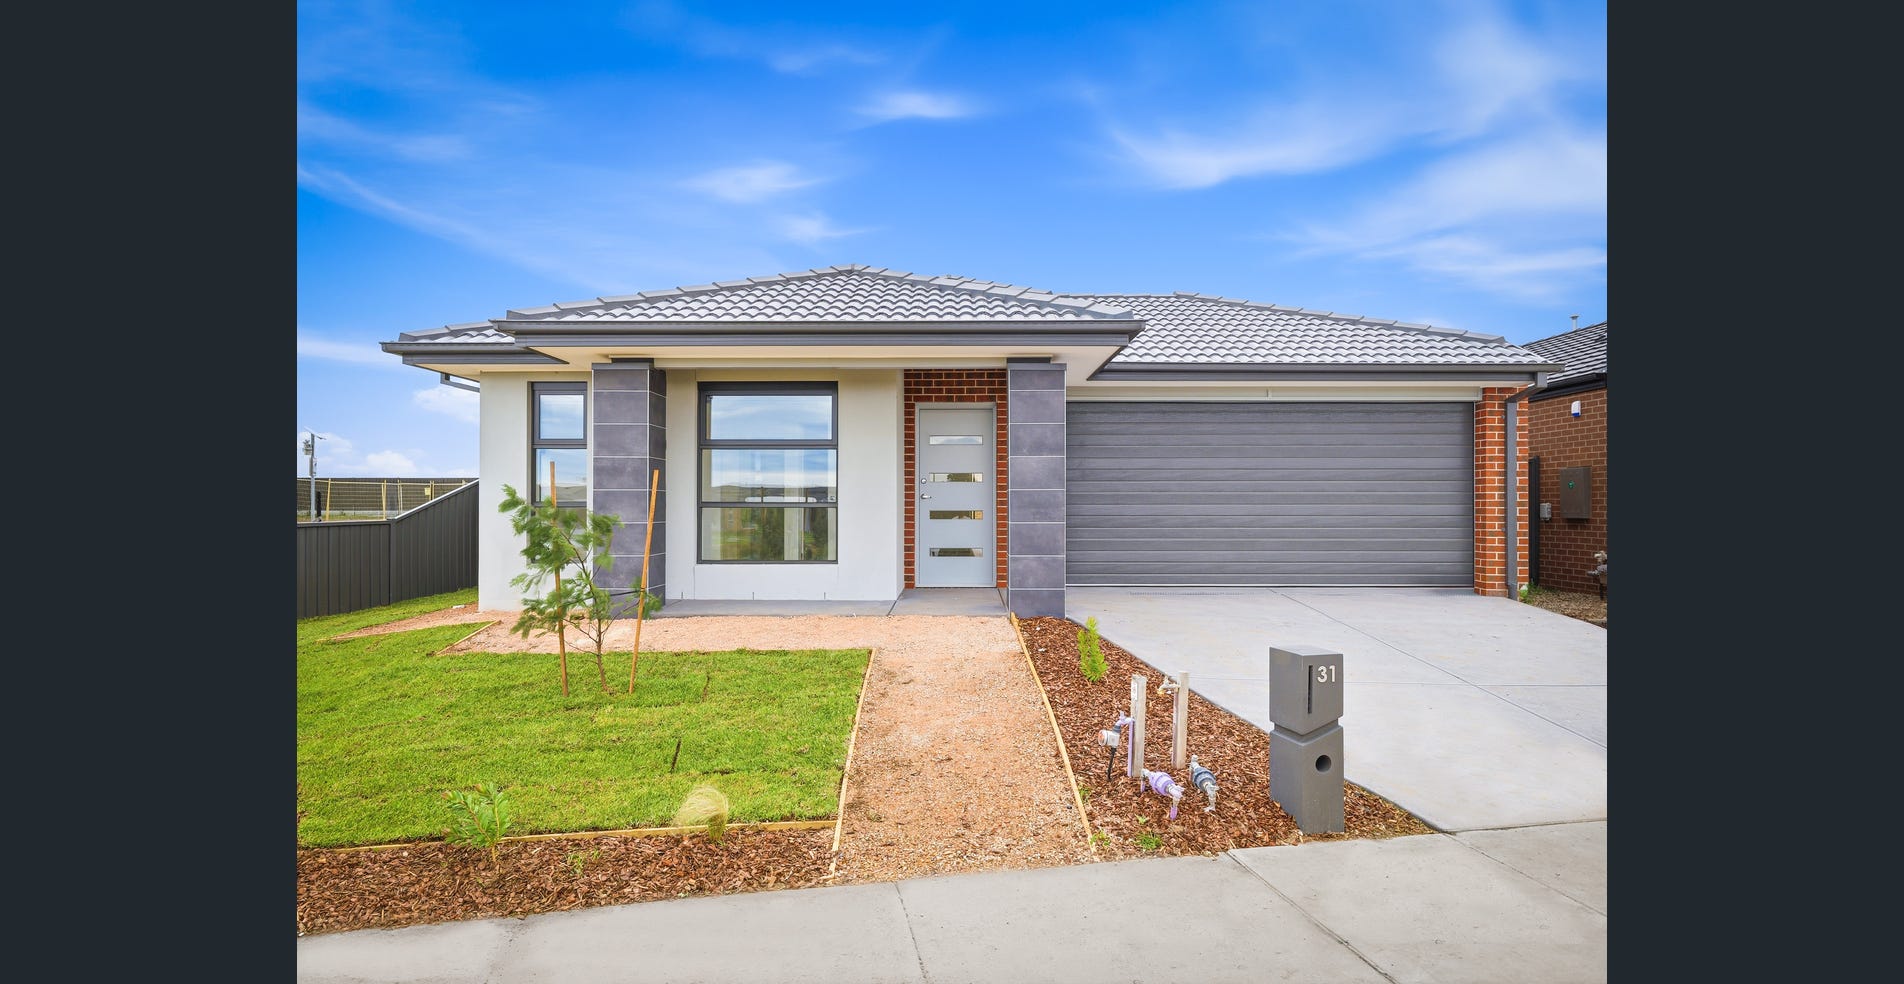
31 Tuff Street, Werribee, VIC
4 bedrooms · 2 bathrooms
Asking $450 per week · captured 28 Jun 2026
A single-storey home with a double garage, driveway and a small front lawn.
82% have 4+ bedrooms104 of 127 houses with recorded bedrooms. 127 of 127 have two-plus bathrooms.
Source: Microburbs · Listing photograph. Saved photo and dated listing facts. Camera date not supplied.
Retained house records: A 3 Sep 2015–9 Apr 2026. B 8 Feb 2022–16 Jul 2026. Houses only. Apartments, townhouses, vacant land and unclassified records excluded. Each photo is an example, not a photograph of all homes in its block.
Inspect the housing mix, photographs and individual records →
Can household incomes differ sharply inside one suburb?
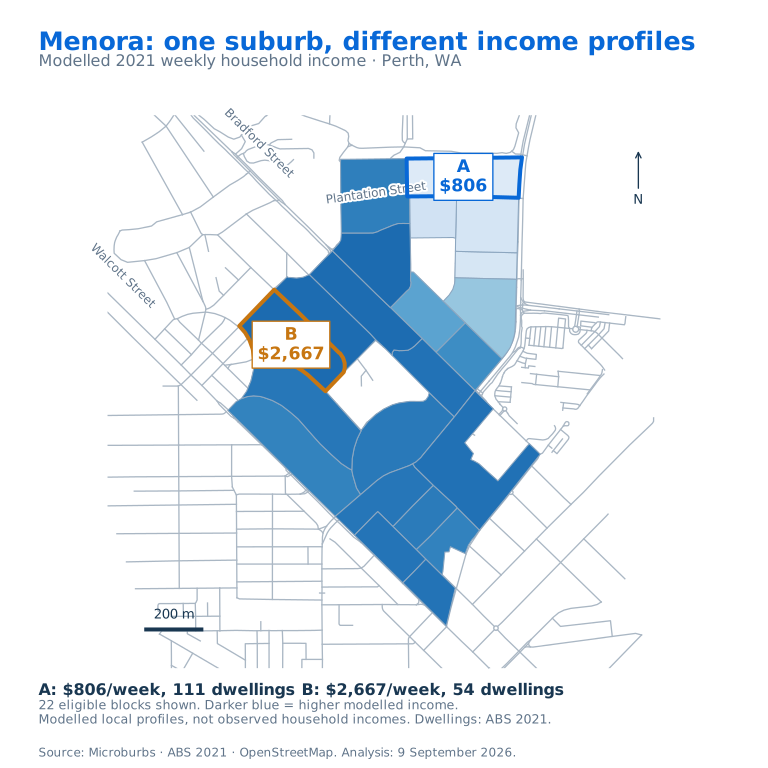
Our modelled local household-income estimates indicate they can. 784 of 4,716 qualifying suburbs (16.6%) contain modelled local income profiles at least twice as high in one block as another.
Modelled 2021 household-income profiles · not observed block incomes
Menora, Perth: one suburb, different income profiles
A · Lower profile $806
B · Higher profile $2,667
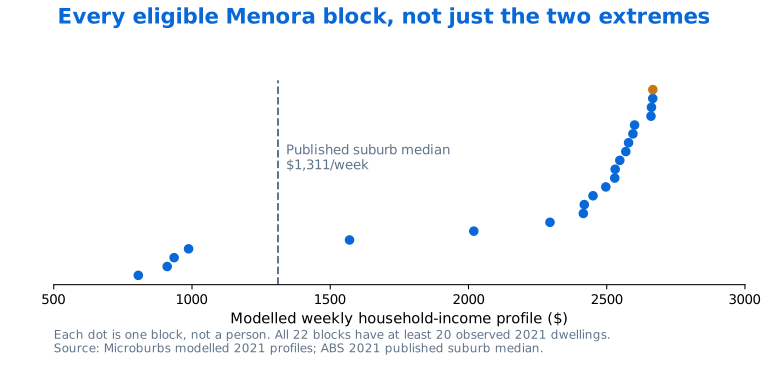
Per household per week, a 3.3× difference. These are modelled local household-income medians. The published 2021 Census suburb median is $1,311 per week.
A suburb-wide figure conceals these estimated local differences. It cannot tell you which housing pocket an address belongs to.
Modelled A: 111 observed 2021 dwellings. B: 54. The photos elsewhere in this article do not establish the incomes of the people who live in those homes.
All 22 eligible Menora blocks are shown. Horizontal axis: modelled median household income in dollars per week, for all 22 eligible Menora blocks in 2021. Each dot is one block. The published suburb median is $1,311 per week. The spread shows why one suburb figure cannot describe every pocket. Source: Microburbs · ABS Census 2021.
National income test: residential blocks with at least 20 observed Census dwellings and modelled income of at least $500 per week, in suburbs with at least five eligible blocks. The estimates have no supplied block-level accuracy bounds. They indicate possible local differences, not observed incomes or a description of every resident. The underlying modelled data extract is dated April 2026.
The 16.6% figure counts suburbs containing a twofold contrast. Only 0.35% of eligible blocks were themselves at least twice above, or below half, the published suburb income. Those are different questions and denominators.
See the modelled profiles, source definitions and exclusions →
Are nearby homes more similar than homes across the suburb?
Yes, in the measured house sample. Bedroom counts differed in 51% of suburb comparisons, against 39% for the nearest recorded house. Bathroom counts differed in 35% versus 26%. The same homes were used at every level.
Same 16,249 houses across 560 suburbs. Recorded listings: 3 January 2023–10 February 2026.
Homes with different bedroom counts
Percentage of comparisons, using the same 16,249 houses in 560 suburbs. Listing records: 3 January 2023 to 10 February 2026. Shorter bars mean a closer room match.
Same suburb
51%
Same mesh block
44%
Nearest house
39%
Homes with different bathroom counts
Percentage of comparisons, using the same 16,249 houses in 560 suburbs. Listing records: 3 January 2023 to 10 February 2026. Shorter bars mean a closer room match.
Same suburb
35%
Same mesh block
29%
Nearest house
26%
Shorter bars mean a higher share of homes have matching room counts. The comparison uses another recorded house in the suburb, another in the same mesh block, or the nearest recorded house within 100 metres.
Same suburb37%same bedrooms and bathrooms
Same mesh block45%same bedrooms and bathrooms
Nearest house50%same bedrooms and bathrooms
The benefit of going local remains after restricting the comparison to houses. A mesh block preserves useful local housing detail, and a nearby individual house can be a closer match again. Neither removes the need to inspect the property.
16,249 houses across 560 suburbs and 1,705 mesh blocks, with unit-style addresses excluded. Same homes and same data at all three levels. Nearest sampled house more than 5 m and at most 100 m away, averaging 41.5 m. It is not necessarily the immediate next-door neighbour. At least 30 recorded houses per suburb and five other houses in the block. Retained listing dates: 3 January 2023–10 February 2026. ABS 2021.
This measures physical room similarity. It does not measure sale-price or rental-valuation accuracy, or prove that the statistical boundary itself caused the similarity.
See exact matching rates, distance tests and independent checks →
Can the building era change across adjoining mesh blocks?
In Medina, south of Perth, the mapped examples show a clear change: five sampled houses built between 1953 and 1965 sit beside ten built between 2014 and 2016. All 15 have a reported construction year.
1953–1965 reported construction years. None of the block’s 51 currently registered addresses first entered the national address register in 2015 or later.
B · Ten newer houses
2014–2016 reported construction years. All 77 currently registered addresses first entered the register in 2015 or later.
The building years and address history both point to different development eras. Address registration alone does not prove when a home was built.
Construction-year source extract: 19 April 2026. Original observation dates not retained. National address-register history through 21 April 2026. Recorded houses are a sample, not every property in each block. The map shows locations. It does not establish building condition.
See all 15 addresses and their source construction-year statements →
How should buyers and property teams use this detail?
Suburbs are useful for a broad conversation about city access or shopping centres. For an individual home, choose evidence that fits the actual property and its local housing stock.
Rental valuation
Compare the home with competing rental stock of the same type, room count and condition. An apartment precinct and a large-family estate can have different tenants, layouts and competition.
Home valuation and CMAs
A comparative market analysis should explain why each sale is relevant. Use the mesh block to understand the local stock, then select and adjust individual sales for date, land, condition and location.
Demand and household profiles
Modelled income and household profiles can highlight areas worth investigating. Keep estimates separate from published Census counts and from what is known about a particular household.
Development and competing supply
Separate established housing, new estates and infill pockets. Track new addresses alongside planning and building evidence. Address registration dates alone do not prove construction dates.
Safety and local risks
Use the address and relevant mapped flood, road or environmental evidence. Keep crime data at its supported geography. Income estimates do not establish that an area or person is unsafe.
Consistent API reporting
Use an official small-area code and boundary edition to join housing and local context consistently. Preserve the actual property details and each source date alongside them.
See application examples and limits →
What determines the shape of a mesh block?
Roads, property boundaries, land use, access and physical barriers all matter. A mesh block follows the real place. It is not a standard square.
Homes along a main road may share frontage and traffic exposure, while the houses behind face a quieter street. A small boundary can preserve that distinction for further investigation.
ABS guidance also seeks to keep housing complexes together, separate different land uses and group communities with shared access. It favours compact urban shapes where possible. Long strips are real examples, not a rule that every main road must produce one.
They give different datasets a common, detailed geographic reference. You can preserve local variation first and combine it into larger official areas when needed.
The Australian Bureau of Statistics defines mesh blocks as the smallest areas in its Australian Statistical Geography Standard. Most contain 30 to 60 dwellings, although some have many more and others none.
Mesh block→SA1→SA2→SA3→SA4→State→Australia
SA means Statistical Area. Each level in this main structure combines whole areas from the level below. Other ABS structures use different groupings.
ABS approximations of suburbs, postal areas and council areas are also assembled from mesh blocks. Postcodes and suburb names remain useful labels, while a code and polygon make a data join explicit.
Keep suburbs for orientation. Keep local detail for comparisons.
People recognise suburb and postcode names. They work well in conversations, spreadsheets and broad questions about city access or major shopping centres such as Westfield. Even then, the exact address determines the journey.
When a system compares thousands of properties, it does not need a memorable name for every housing pocket. It needs consistent boundaries, dated evidence and enough detail to avoid treating an entire suburb as one property market.
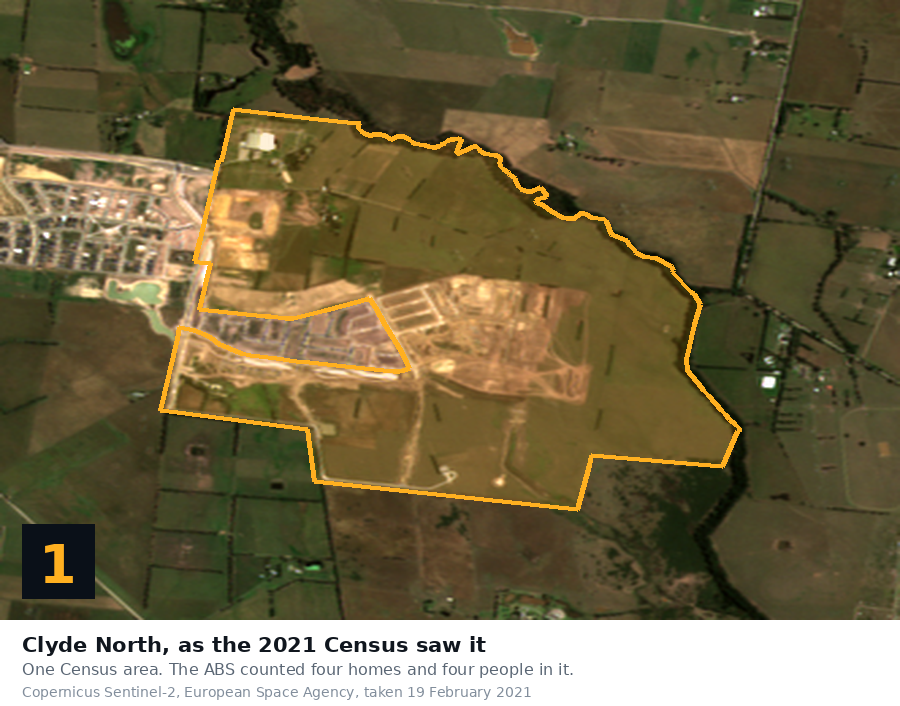
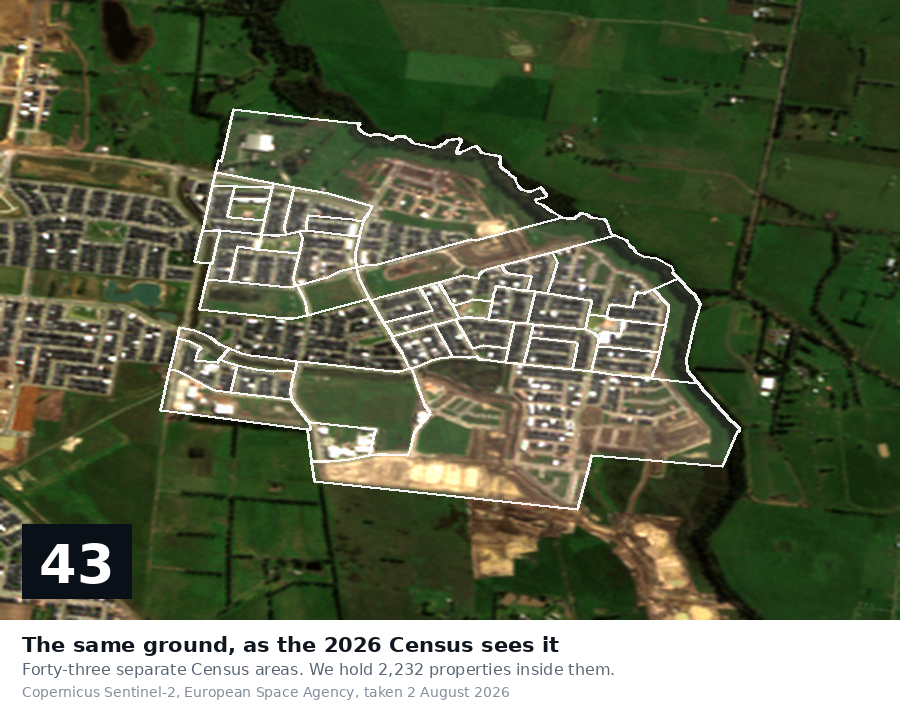
New development can turn one large statistical area into many smaller ones. Microburbs holds the 2026 mesh-block boundaries, so we can preserve this newer geography alongside the 2021 evidence.
Clyde North,19 February 2021. Real satellite image with the earlier geographic footprint. Source: Microburbs · Sentinel-2 · ABS.
The same area,2 August 2026. Development is visible and the 2026 geography is more detailed. Source: Microburbs · Sentinel-2 · ABS.
In this selected Clyde North example, one 2021 mesh block became 43 successor blocks in 2026. That does not mean 43 new neighbourhoods appeared at once. It means the statistical boundaries now preserve more of the area’s detail.
This is a boundary and satellite comparison, not 2026 Census results. The first 2026 Census results are due in June 2027. ABS release plan.
Read the boundary correspondence and imagery dates →
How can I use mesh blocks through a property data API?
The Microburbs API provides mesh-block identifiers, polygons and local property context, alongside property details and comparable-sales tools. That lets an application show the small area on a map and explain the home in its local setting.
For a buyer: Preview a suburb or property report. Full report detail requires a subscription. The public preview uses a clearly labelled sample location.
For a software team: keep the address identifier, mesh-block code, boundary edition and source dates together. Use the official geography to connect data without relying on suburb-name matching.
2026 boundaries are held by Microburbs. The public polygon API documentation currently names 2021 boundaries. Ask for the boundary edition you need when arranging access. This article does not announce a documented 2026 API endpoint.
Can useful housing comparisons cross suburb boundaries?
Yes. Similar building forms can occur in different suburbs. That can help with stock and design comparisons, while local demand, amenities and land values still need separate attention.
Selected three-bedroom, one-bathroom homes with brick walls, tiled roofs and front gardens. The individual dated sale prices differ. These are physical housing examples, not proof of interchangeable valuations or matching residents.
Inspect the cross-suburb comparison →
Luke Metcalfe
Chief Data Scientist and Founder microburbs.com.au