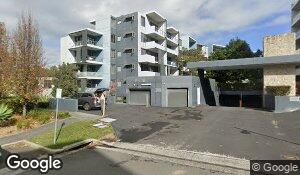
Street-level exterior of the Epping Park apartment complex, with stacked balconies and shared vehicle access. This is the building exterior, not a view inside Unit 371.
2 bedrooms · 2 bathrooms Sold $765,800 · 15 August 2025
Room-record sample: 16 December 2015 to 7 July 2026. Source photo: cached Google Street View, camera date unknown. Saved photo and dated listing facts.
Two different housing mixes inside Epping, Sydney About 1.5 km between the selected properties. The blocks are not adjoining. ABS 2021 blocks. Source: ABS, OpenStreetMap and Microburbs.
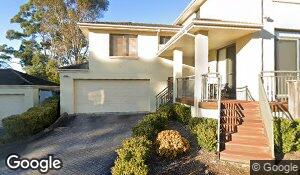
B · Detached family home
86%of the block’s dated bedroom records have 4+ bedrooms 25 of 29 dated records with bedroom counts
A detached two-storey home with a double garage, front steps and a landscaped entrance.
4 bedrooms · 2 bathrooms Sold $2,318,888 · 7 December 2025
Room-record sample: 22 May 2016 to 25 March 2026. Source photo: cached Google Street View, camera date unknown. Saved photo and dated listing facts.
A suburb name does not tell you which homes you are comparing. The apartment building and the detached home sit inside the same named suburb. Their blocks contain very different bedroom mixes. A whole-suburb summary combines those markets.
These are selected real exteriors. The first image shows the apartment building, not inside Unit 371. Photos, property sale dates and the dated bedroom-record samples are separate evidence. Missing bedroom counts are excluded from the percentages. The local suburb-outline edition is unconfirmed; the highlighted mesh blocks are ABS 2021.
Two sources support the Epping housing contrast
The headline pictures use the dated listing sample: 215 of 228 valid bedroom records have one or two bedrooms in the apartment block, versus 25 of 29 with four or more in the house pocket. The periods and missing-count denominators are given in the dated table below.
Separate broader room-profile source, with observation dates unavailable
ABS 2021 block
Complete room profiles
0–2 bedrooms
4+ bedrooms
One bathroom
Two or more bathrooms
11215300000
296
281 (94.9%)
0 (0.0%)
23 (7.8%)
273 (92.2%)
10380160000
54
1 (1.9%)
38 (70.4%)
12 (22.2%)
42 (77.8%)
Recorded room attributes extracted 7 April 2026. Underlying source observation dates are not retained. All property types combined. These are distributions of recorded profiles, not complete dwelling counts or current market shares.
Separate dated listing evidence and ten inspectable property rows
Block
Dated coverage
Observed housing labels
Bedrooms
Listing observation period
11215300000
232 recognised housing addresses
231 apartments; 1 houses; 0 townhouse-style homes
215 / 228 with 1–2 bedrooms; 0 / 228 with 4+
16 December 2015 to 7 July 2026
10380160000
31 recognised housing addresses
0 apartments; 29 houses; 2 townhouse-style homes
0 / 29 with 1–2 bedrooms; 25 / 29 with 4+
22 May 2016 to 25 March 2026
The dated records independently make the dwelling-type contrast visible. They cover a different sample from the 296 and 54 broad room profiles above. The ten latest rows below are for inspection, not the full distribution.
Address and source
Recorded type
Beds
Baths
Listing observation date
Block
UNIT 205, 16 EPPING PARK DRIVE Epping, NSWOriginal listing URLhttps://www.homely.com.au/homes/205-16-epping-park-drive-epping-nsw-2121/13311774
apartment
2.0
2.0
7 July 2026
11215300000
UNIT 531, 11 EPPING PARK DRIVE Epping, NSWOriginal listing URLhttps://www.domain.com.au/531-11-epping-park-drive-epping-nsw-2121-18122904
Apartment / Unit / Flat
2.0
2.0
18 May 2026
11215300000
UNIT 460, 7 EPPING PARK DRIVE Epping, NSWOriginal listing URLhttps://www.domain.com.au/460-7-epping-park-drive-epping-nsw-2121-18104287
Apartment / Unit / Flat
2.0
2.0
5 May 2026
11215300000
UNIT 113, 20 EPPING PARK DRIVE Epping, NSWOriginal listing URLhttps://www.homely.com.au/homes/113-20-epping-park-drive-epping-nsw-2121/13075401
apartment
2.0
2.0
21 April 2026
11215300000
UNIT 374, 5 EPPING PARK DRIVE Epping, NSWOriginal listing URLhttps://www.domain.com.au/374-5-epping-park-drive-epping-nsw-2121-18080571
Apartment / Unit / Flat
2.0
2.0
20 April 2026
11215300000
UNIT 3, 193 MIDSON ROAD Epping, NSWOriginal listing URLhttps://www.domain.com.au/3-193-midson-road-epping-nsw-2121-18046116
How often does one suburb contain opposing housing profiles?
In the specified test, 2,079 of 4,910 eligible suburbs (42.3%) contain two blocks with sharply different bedroom, bathroom or combined room profiles.
This counts suburbs with at least one of the three contrasts below. It does not mean 42% of all homes differ, or that 42% of suburbs have the bedroom contrast specifically.
Contrast required in different blocks
Eligible suburbs meeting it
At least 70% with 0–2 bedrooms in one block, and at least 70% with 4+ bedrooms in another.
1,007 / 4,910
At least 80% with one bathroom in one block, and at least 80% with two or more in another.
1,899 / 4,910
At least 60% with 0–2 bedrooms and one bathroom in one block, and at least 60% with 4+ bedrooms and two or more bathrooms in another.
1,128 / 4,910
Primary eligibility: at least 20 complete profiles per block, 100 complete profiles across the suburb, and two qualifying blocks. 171,195 blocks contain 5,779,724 profiles. Source extract: 7 April 2026; original observation dates unavailable. ABS 2021. Blocks need not adjoin.
The result changes with the minimum sample size
Minimum profiles per block
Eligible suburbs
Suburbs with any specified contrast
Share
Profiles in eligible blocks
10
5,071
2,455
48.4%
6,667,709
20
4,910
2,079
42.3%
5,779,724
30
4,031
1,565
38.8%
3,699,874
50
1,703
455
26.7%
996,506
Requiring more observations drops many small blocks and changes which contrasts can be detected. On the same 1,703 suburbs eligible at the 50-profile threshold, the contrast rate is 74.4% using 20-profile blocks and 26.7% using 50-profile blocks. The headline describes one specified test, not a threshold-independent prevalence.
A separate dated-listing sample, January 2023 to 10 February 2026, finds contrasts in 264 of 567 eligible suburbs (46.6%) at five observations per block, but only 14 of 147 (9.5%) at ten. Its sparse coverage does not independently validate a 42% prevalence rate.
Werribee: different housing even among houses
Selected established and larger-family pockets in the same Melbourne suburb. This comparison restricts the dated source records to houses, excluding apartments, townhouses and vacant land. The photos show examples, not every home.
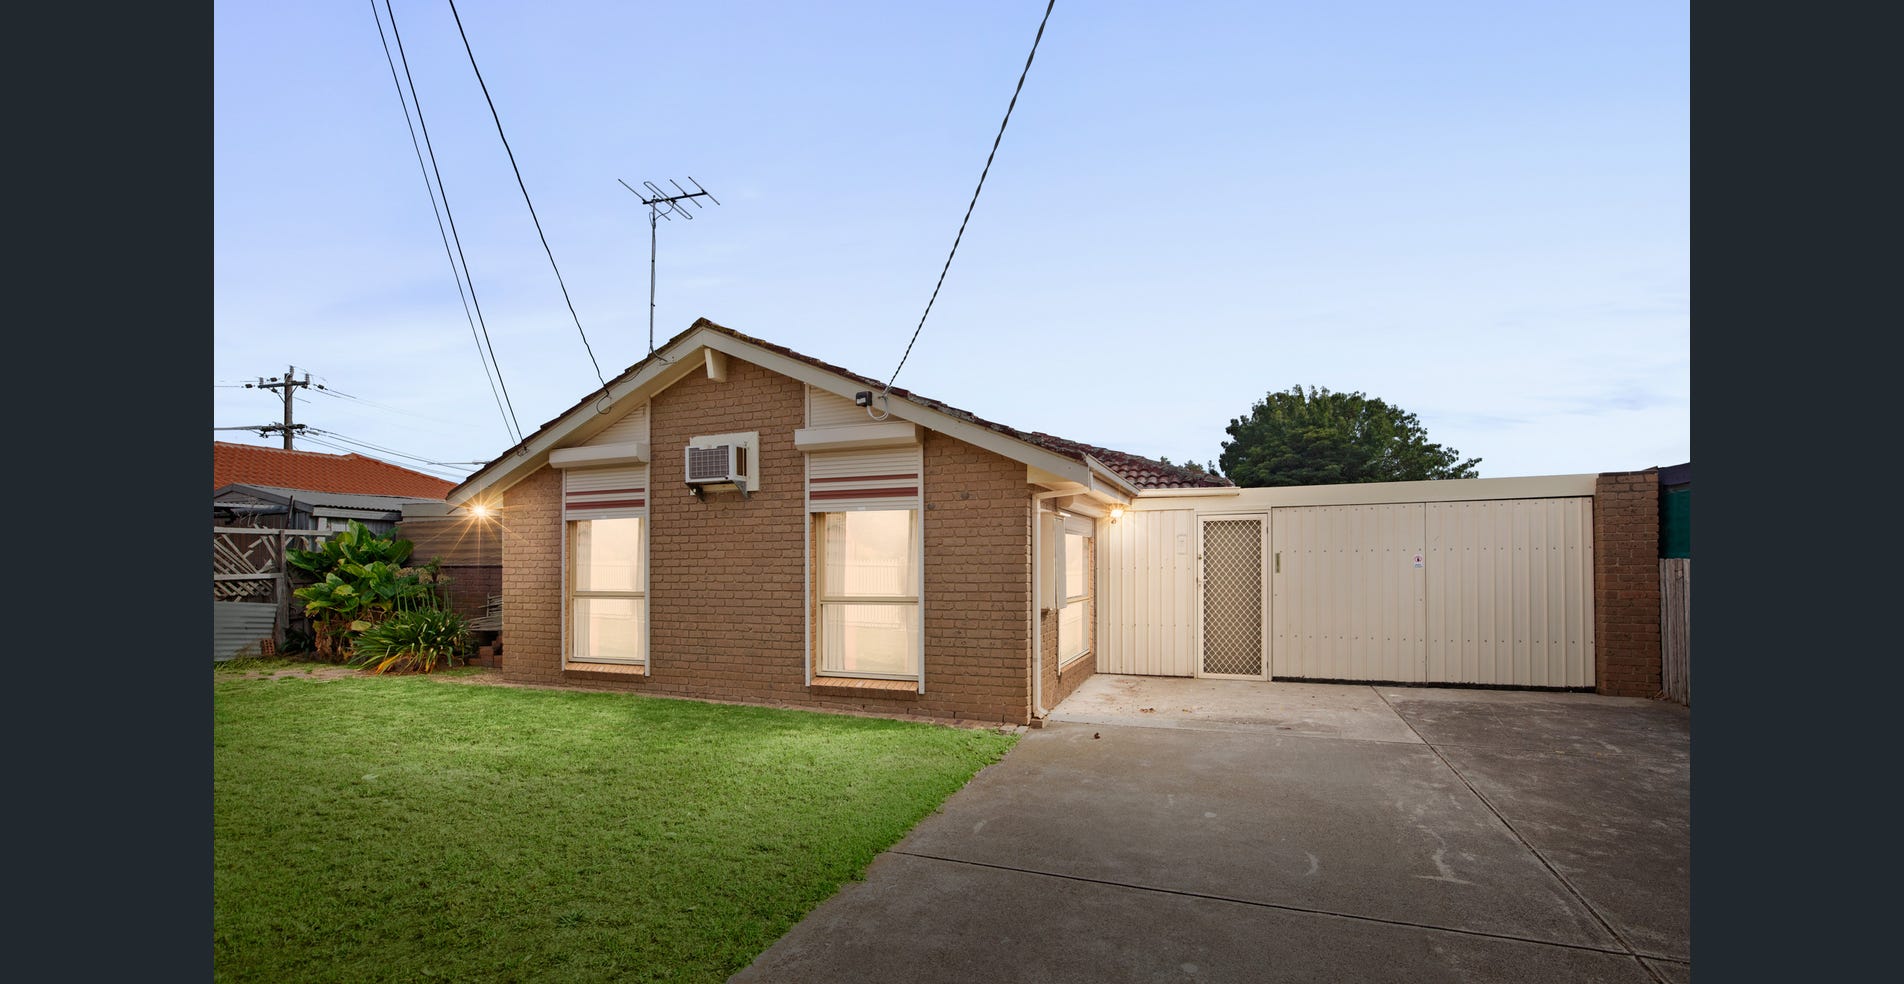
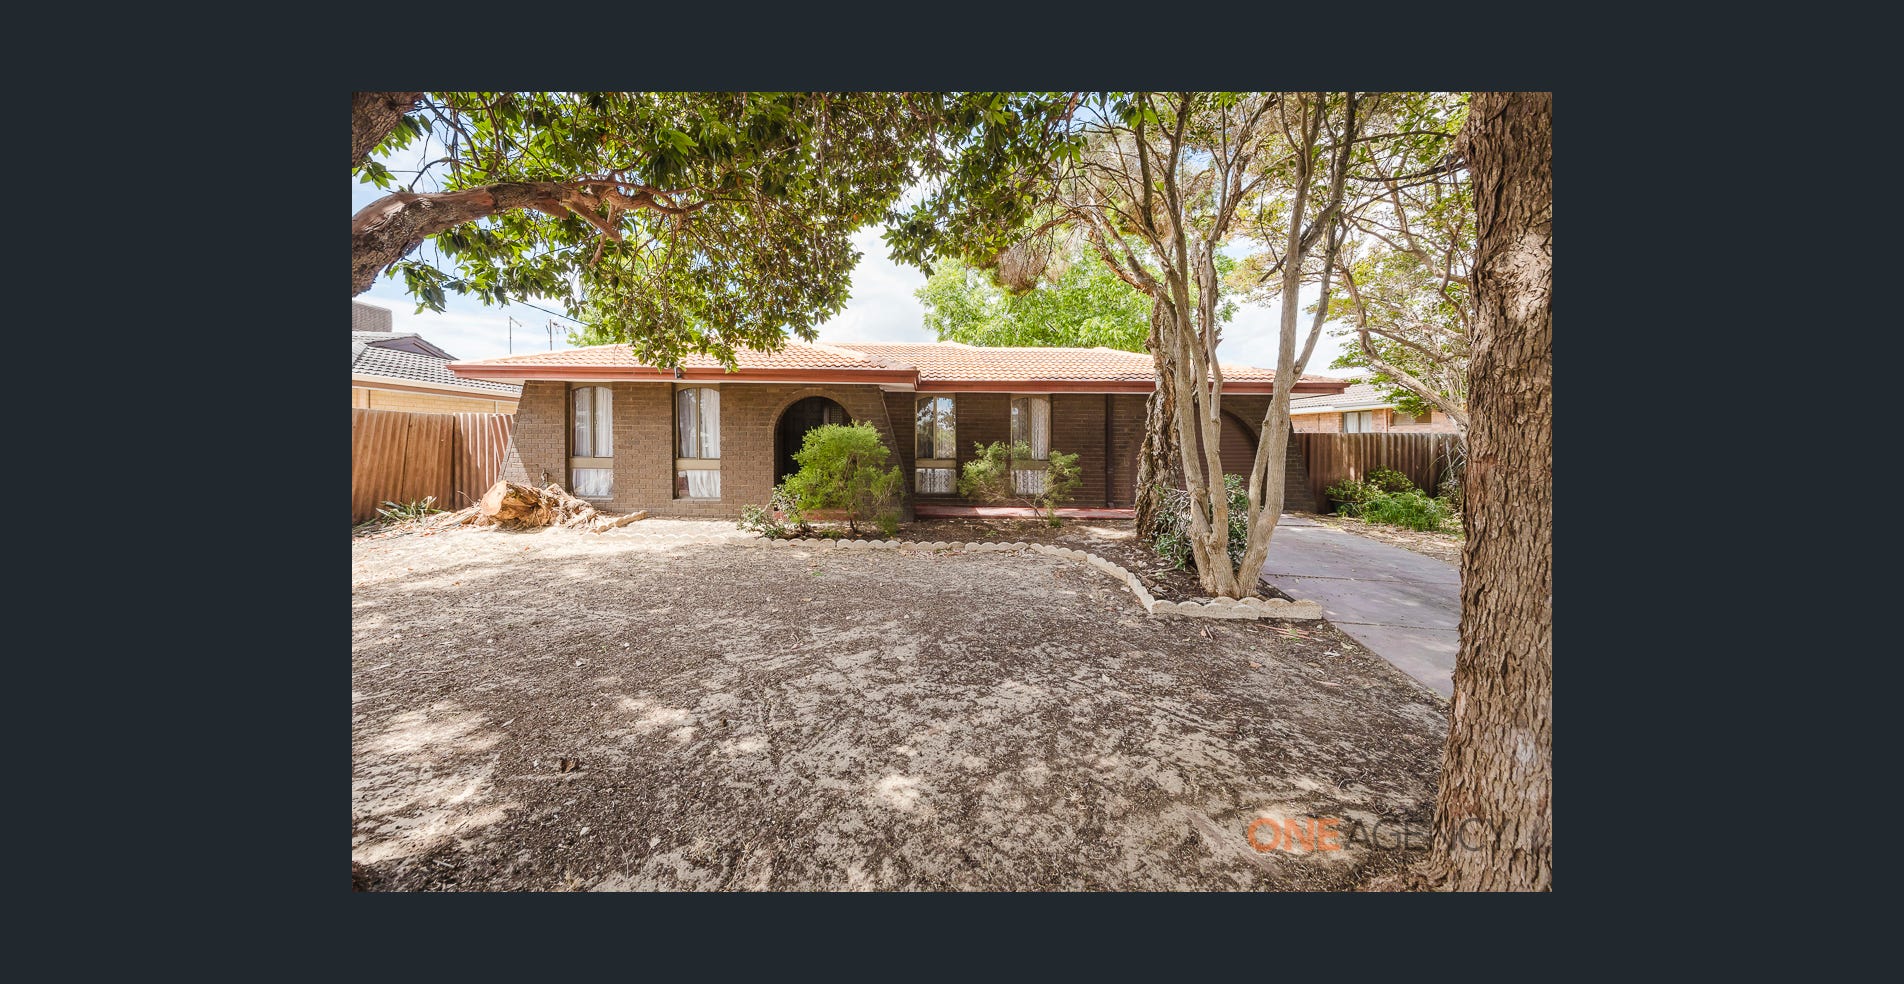
223 Shaws Road, Werribee, VIC. An established detached brick home with a tiled roof, front lawn and a driveway beside the house. 3 bedrooms, 1 bathrooms. Sold $555,000, 2026-05-06. Source: Microburbs, cached listing photograph; camera date unknown. Saved photo and dated listing facts.
A · Established housing
3 of 18 houses (17%) have 4+ bedrooms. 13 have one bathroom; 5 have two or more, among 18 valid bathroom records.
22 recognised houses; one latest dated observation per address. Retained house listing records 2015-09-03 to 2026-04-09. Missing room values excluded.
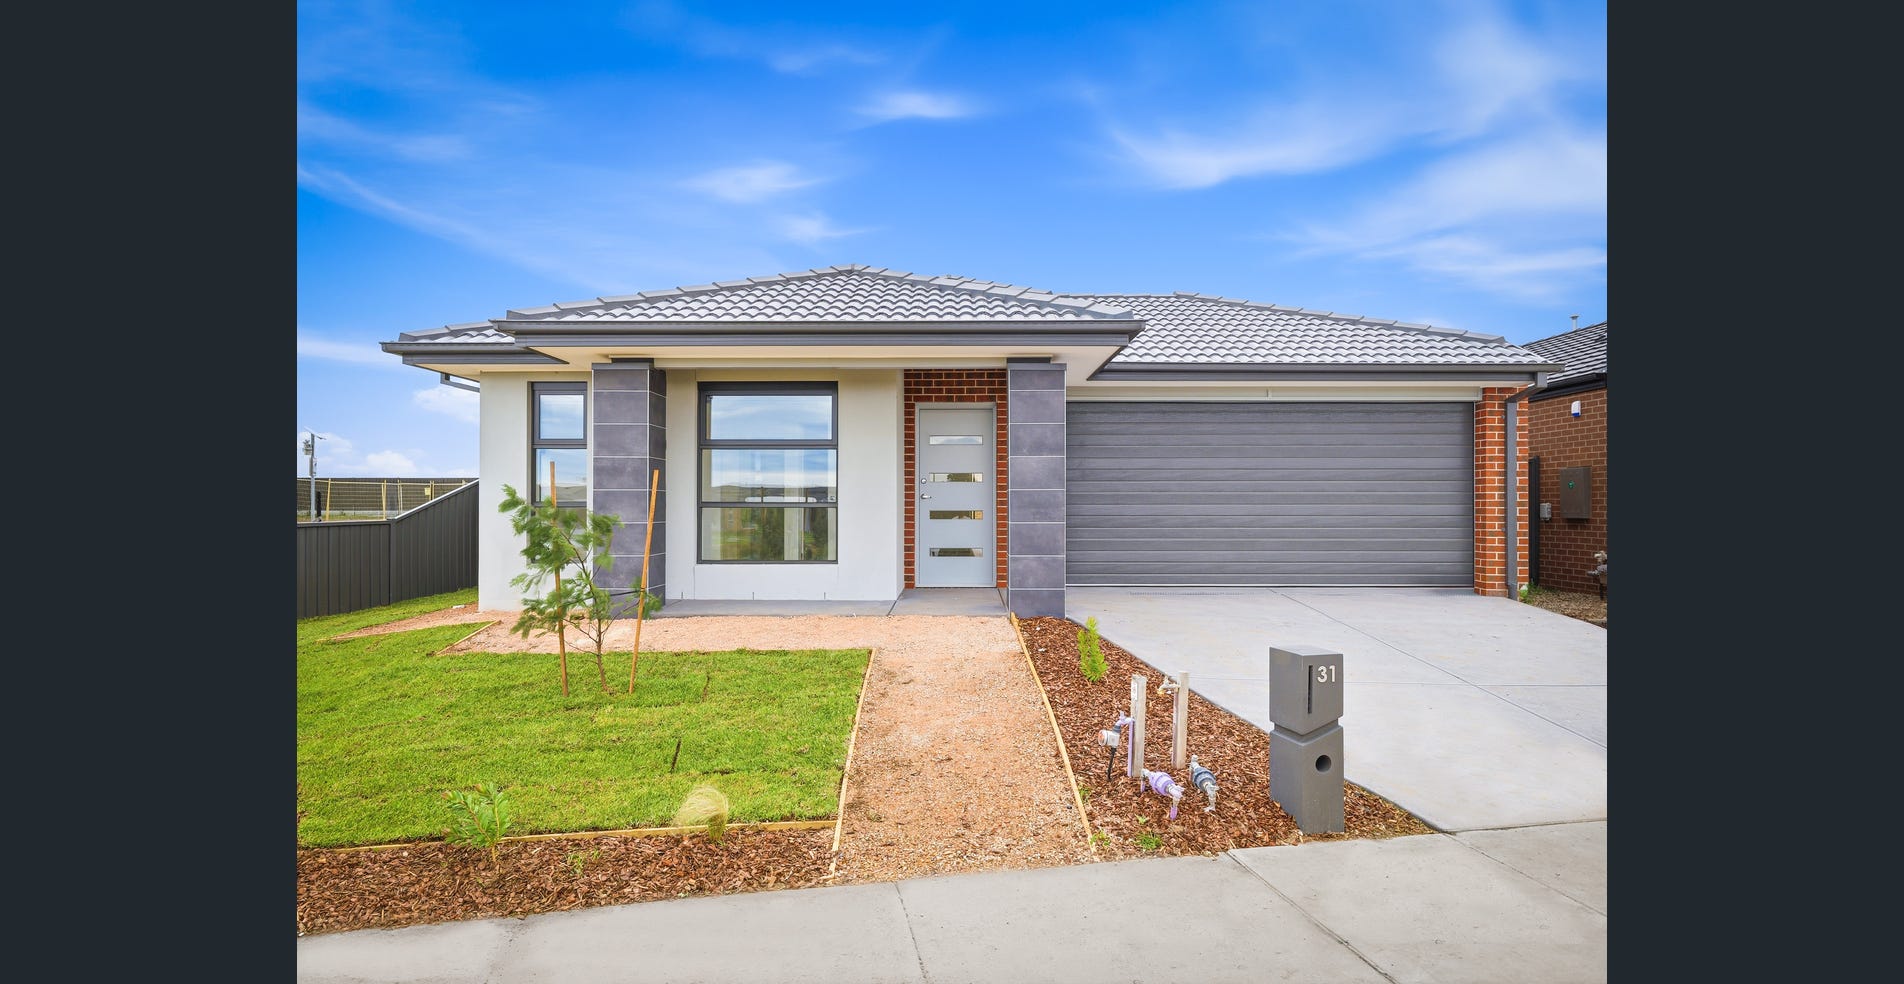
31 Tuff Street, Werribee, VIC. A single-storey home with a double garage, driveway and a small front lawn. 4 bedrooms, 2 bathrooms. Asking $450 per week, 2026-06-28. Source: Microburbs, cached listing photograph; camera date unknown. Saved photo and dated listing facts.
B · Larger family housing
104 of 127 houses (82%) have 4+ bedrooms. 0 have one bathroom; 127 have two or more, among 127 valid bathroom records.
127 recognised houses; one latest dated observation per address. Retained house listing records 2022-02-08 to 2026-07-16. Missing room values excluded.
The two properties are 6.57 km apart in a straight line; these blocks are not adjoining. Source: Microburbs, ABS 2021, OpenStreetMap.
Modelled income can vary substantially inside a suburb
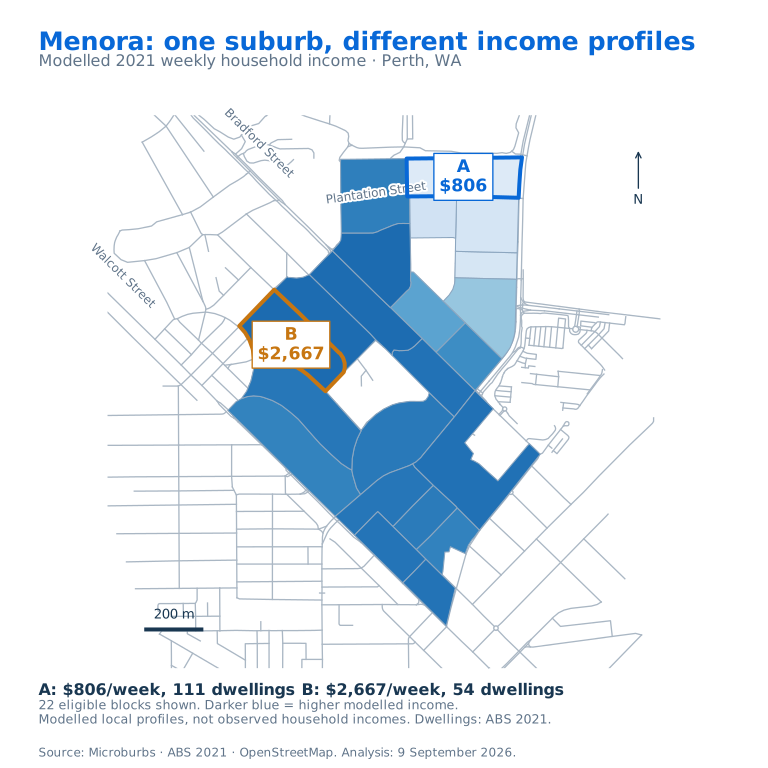
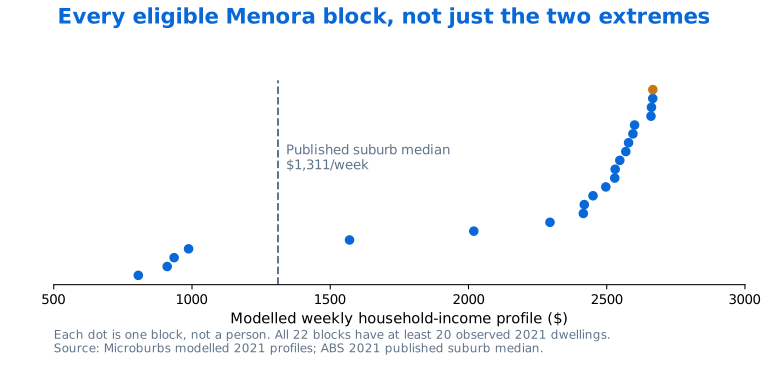
Menora, Perth: modelled local weekly household-income profiles range from about $806 to $2,667 across the two highlighted blocks. The published 2021 suburb median is $1,311.
These block values are estimates trained from 2021 Census areas. They are not observed mesh-block household incomes, the income of each resident, or 2026 income figures.
Selected block contrast, Menora, WA. Blue A: $806 a week, 111 observed 2021 dwellings. Orange B: $2,667 a week, 54 dwellings. Model file dated 10 April 2026, trained from 2021 targets. Source: Microburbs model, ABS 2021 and OpenStreetMap.All 22 eligible block profiles. The selected extremes are 3.31 times apart. The wider distribution is shown to avoid relying on two chosen points. The official suburb median is observed at suburb level; the block values are modelled.
Across the modelled profiles, 784 of 4,716 eligible suburbs (16.6%) contain two blocks where the higher income estimate is at least twice the lower one. This measures the existence of contrasting modelled blocks, not a share of households.
Income definitions, Epping comparison and model limits
Eligibility: residential 2021 blocks with at least 20 observed 2021 dwellings, modelled weekly income of at least $500 and at least five eligible blocks per suburb. The primary comparison excludes modelled incomes below $500 a week. Lower household incomes are still possible.
The two-times suburb rate is 16.77% using all positive estimates, 16.62% with the $500 minimum and 14.65% with a $750 minimum. A different calculation finds only 764 of 218,700 eligible blocks (0.35%) at least twice above or below their published suburb baseline. Do not confuse the suburb and block denominators.
Within Epping, the illustrated house block has a modelled weekly income of $3,041 and the apartment block $2,381, against the published 2021 suburb median of $2,243. Those two estimates are 1.28 times apart, not twice. Housing differences do not automatically imply similarly large income differences.
The source has 12 negative income predictions, which were excluded. No per-block uncertainty or held-out local-income accuracy was supplied. Separately predicted income-band columns are not calibrated household counts, so they are not used to describe percentages of rich or poor households.
Does going closer find more similar homes?
Using the same 16,249 houses for every comparison, the share matching both bedroom and bathroom counts rises from 37% across the suburb to 45% within the mesh block and 50% for the nearest recorded house.
Same bedrooms and bathrooms · 16,249 houses in 560 suburbs · retained listing dates January 2023 to 10 February 2026. Each full track is 100%.
0%50%100%
Other house in suburb
37%
Other house in block
45%
Nearest recorded house
50%
16,249 houses after excluding unit-style addresses · 560 suburbs · 1,705 blocks. Nearest recorded house is over 5 m and at most 100 m away, averaging 41.5 m. At least 30 complete house records per suburb and five other records in the anchor’s block. January 2023 to 10 February 2026 listing source; ABS 2021.
A random-suburb comparison uses every other recorded house in that suburb with equal probability. A random-block comparison uses the other recorded houses in that block and suburb. The nearest house is chosen by distance alone, without looking at its room count or price.
Nearby homes are more likely to share these simple features in this sample. Half of the nearest pairs still differ on bedrooms or bathrooms. The nearest recorded house is not guaranteed to be the true next-door neighbour.
Same-cohort room differences, unit-address sensitivity and the wider 100 m sample
Comparison
Same bedrooms
Same bathrooms
Same beds and baths
Average bedroom gap
Average bathroom gap
Other house in suburb
48.8%
64.6%
37.2%
0.620
0.419
Other house in block
56.1%
71.3%
45.1%
0.521
0.341
Nearest recorded house
60.6%
73.7%
50.0%
0.465
0.310
Including unit-style addresses labelled House gives 17,355 anchors in 615 suburbs, with both-room matching of 35.9% → 44.5% → 49.8%. The cleaner primary sample above has exact rates of 37.16% → 45.10% → 50.02% and bathroom gaps of 0.419 → 0.341 → 0.310. Excluding unit-style labels still does not independently certify every dwelling as a detached house.
The larger two-level test needs no minimum number of same-block companions: 103,684 house anchors in 2,019 suburbs show 17.6% smaller bedroom gaps and 19.6% smaller bathroom gaps for the nearest recorded house within 100 m, compared with a random other house in the same suburb. These are mean absolute room-count gaps, not valuation error. The 95% suburb-resampling intervals are 16.69–18.55% and 18.50–20.59%, respectively.
That larger sample covers 60.6% of complete house records in qualifying suburbs, or 48.3% of all complete house records. Results at 50/100/200 m show bedroom-gap reductions of 24.6% / 17.6% / 14.6%. Without unit-style addresses, the 100 m reductions are 14.5% for bedrooms and 17.7% for bathrooms.
Repeated companions and reciprocal pairs are allowed, so observations are not independent pairs. Confidence intervals resample whole suburbs and retain address weighting. Source dates can differ between neighbours. All 103,684 saved primary distances were recomputed, with 400 nearest choices and random baselines checked against every eligible same-suburb house.
What each source means
Evidence
What is measured
Date and limitation
Broad room profiles
Recorded bedroom and bathroom attributes at registered addresses, all property types combined. No price or synthetic income used.
6,981,204 source profiles after 2021 code agreement; exclude 456 blocks mapped to multiple suburbs (10,247 profiles), leaving 6,970,957. Extract 7 April 2026; source observation dates unavailable.
Dated example listings
Observed property labels and rooms from the latest retained real dated listing for each address.
Epping examples cover 2015–2026 and 2016–2026 separately. Broader dated tests use January 2023–10 February 2026. These are listing samples, not all dwellings.
Direct nearby-home test
Bedroom/bathroom differences and exact matches for the same anchor houses at suburb, block and nearest-recorded-house levels.
2023–February 2026 listing extract. Distinct printed addresses; geodesic distance over 5 m. Source-labelled House records; a no-unit-label sensitivity is supplied.
Modelled block income
Estimated local weekly household-income profile trained from 2021 SA1 targets.
Model file dated 10 April 2026. Neither observed block incomes nor 2026 incomes; no per-block uncertainty supplied.
Official population/dwelling totals
Observed 2021 Census block totals.
Counts support area context and sample eligibility; they do not describe each person or validate synthetic income values.
The source property-feature extractor takes bedrooms and bathrooms directly from the listing-feature table and does not fill these room values. It selects a row using its source date field but does not preserve that date in the final profile file. Use “recorded room profiles”, not “current Australian housing census”.
Where the smaller area helps
Use
Why the whole suburb can mislead
What still matters
Rental valuation
An apartment complex and detached-house pocket can have different room mixes and competition.
Property type, rooms, condition, asking versus achieved rent and observation date. No rental-accuracy improvement is measured here.
Home valuation and comparable sales
The suburb label can combine unlike housing. Local stock helps find or reject candidate sales.
Sale date, land, building size, condition and location demand. A physical match is not proof of equal value.
Safety and environmental research
Major-road exposure, access and local surroundings can change over short distances.
Use direct hazard and environmental evidence at its supported resolution. Demographic or income profiles do not measure safety.
Development and service planning
Suburb-wide demand can combine distinct housing and modelled household contexts.
Check the source period, actual capacity and planning/building evidence. Modelled profiles are estimates.
API and portfolio reporting
An official small-area code preserves local detail across many addresses.
Keep the geography edition and source dates; data fields differ in reliability.
Suburb orientation
The suburb still helps explain city access and the broad location of shopping centres and transport.
Local housing, household mix and a property’s precise access need finer evidence.
Mesh blocks are part of the ABS standard
Mesh blocks are the smallest part of the Australian Statistical Geography Standard. In the main hierarchy they combine into SA1, SA2, SA3, SA4, states or territories, then Australia. Other ABS structures use them for their own areas and release schedules.
Named suburbs and postcodes remain familiar ways to find a place. A mesh-block code and boundary edition give data systems a precise small-area reference. The code is statistical geography, not a property title or a legal planning boundary.
2026 boundaries are available; Census periods remain separate
Microburbs holds the 2026 mesh-block boundaries. The ABS released the Edition 4 main structure on 22 July 2026. The current tests on this page use 2021 boundaries, keeping the reported room and Census contexts separate from the new geography.
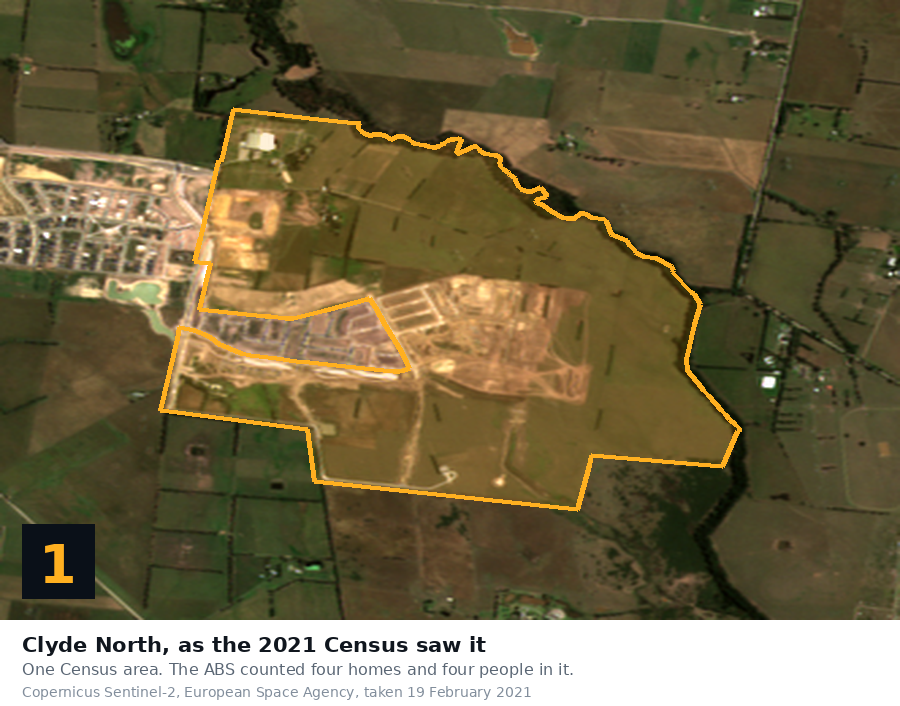
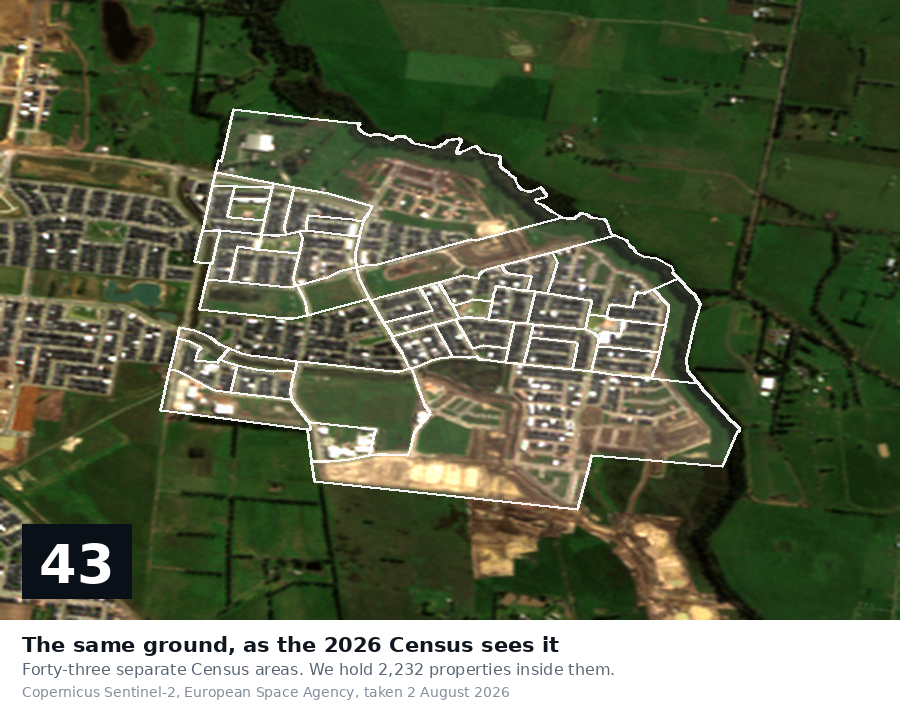
Clyde North, VIC: satellite acquisition 19 February 2021, 2021 boundary context.Same area: acquisition 2 August 2026, 2026 boundary context. Source: Microburbs, Sentinel-2 and ABS.
The official correspondence contains 43 successor rows for selected 2021 block 21327400000. That is a boundary correspondence count, not 43 observed developments or new Census income figures.
The ABS design guidance considers land use, dwellings, roads, access, complexes and physical barriers. Mesh blocks are not equal squares. Long strips can group homes sharing a road frontage or access pattern.
Footscray, VIC: selected 2021 residential block beside Buckley Street, roughly 560 by 70 m in its enclosing rectangle. Source: ABS 2021 and OpenStreetMap.Doubleview, WA: a selected block between a main road and a rear lane. Source: ABS 2021 and OpenStreetMap.
These maps show real shapes and surroundings. They do not, by themselves, measure traffic, noise, safety or a boundary-caused price effect.
Earlier construction-year and independent tests
The earlier reported-year research found 20% smaller construction-year gaps within adjoining blocks. Separate held-out bedroom and matched-distance tests found 10.7% lower attribute error and 3.3% smaller room differences, respectively. These are different samples and questions from the direct neighbour-home comparison above. None measures valuation accuracy.
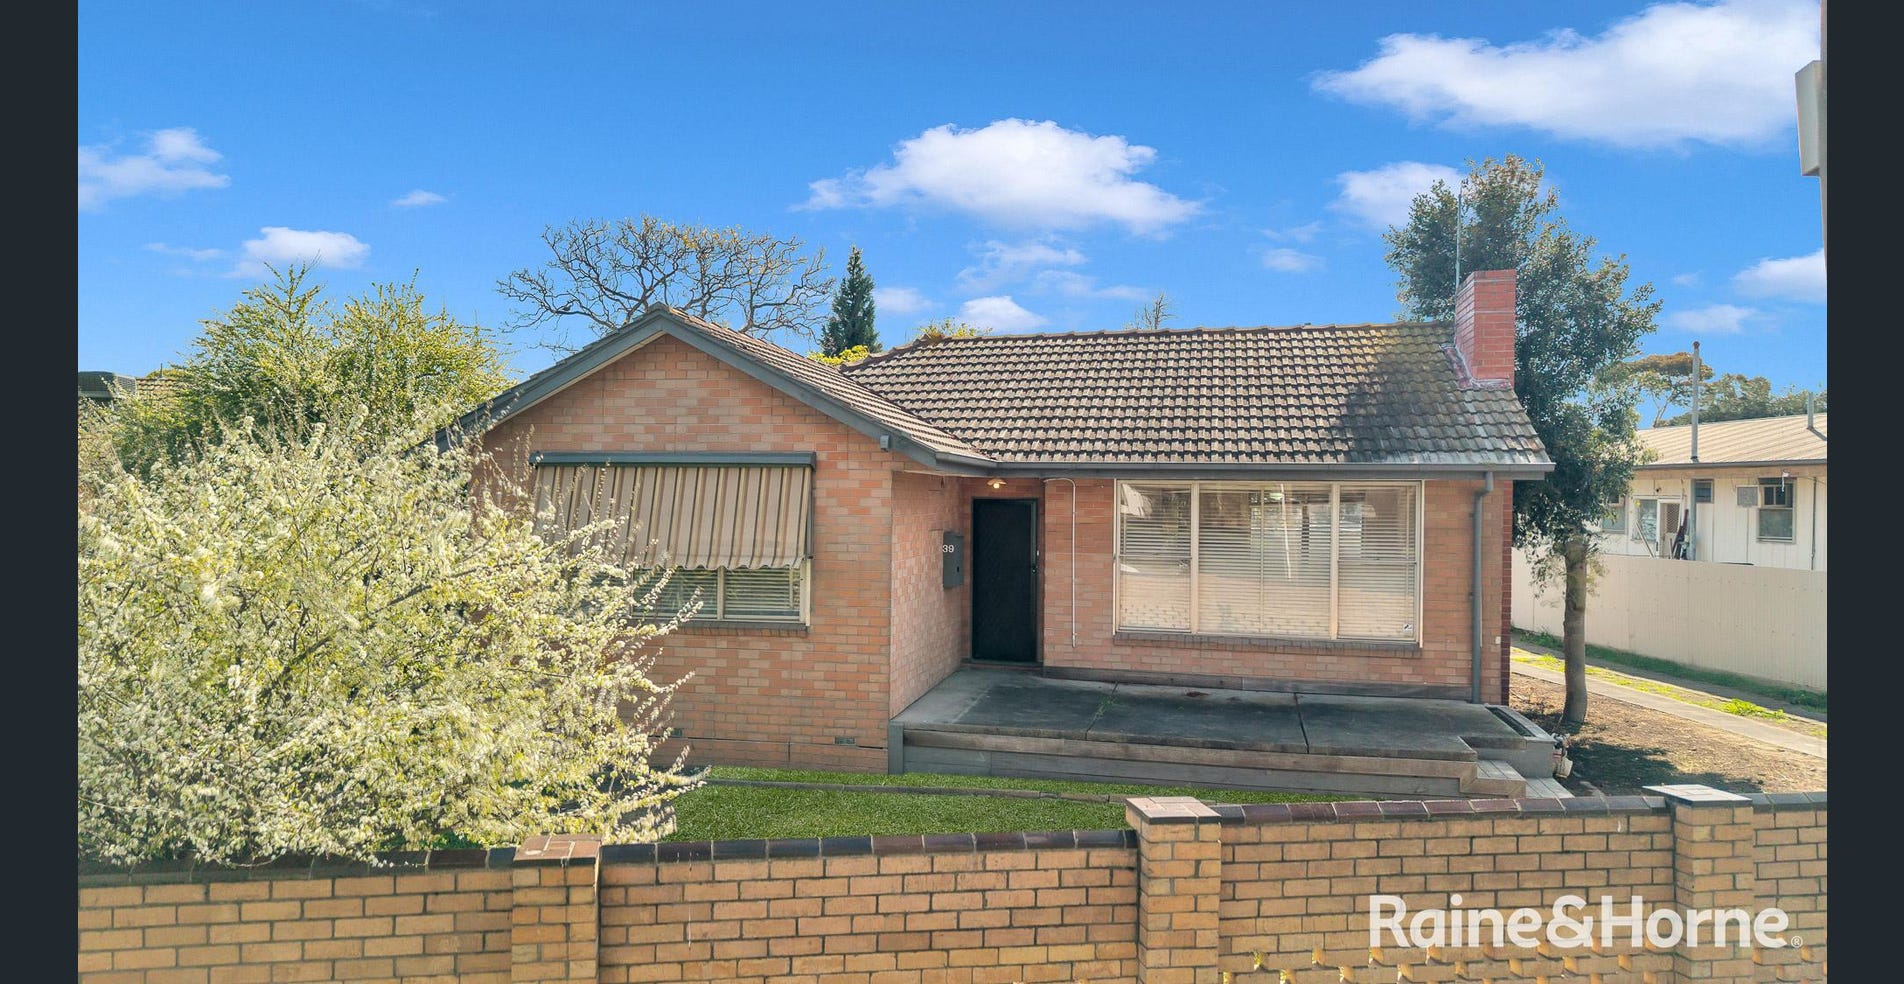
These mapped blocks in Armadale, Perth, and Corio, Geelong, both have a majority of recorded houses with three bedrooms and one bathroom. The selected photos make a shared building form visible. That supports looking beyond the suburb name for physical housing comparisons, while prices and local demand remain separate.
13 of 19 complete house profiles (68%) have three bedrooms and one bathroom. 19 houses have dated source observations in this block. Retained listing dates 2016-08-16 to 2026-07-15.
20 of 23 complete house profiles (87%) have three bedrooms and one bathroom. 25 houses have dated source observations in this block. Retained listing dates 2015-04-29 to 2026-06-16.