Melbourne's 1,412 Hidden Property Bargains (And How Much You Could Save)
We checked 9,329 Melbourne properties against sales data, census records, and neighbourhood statistics. 1,412 passed. Average saving: $93,714.

Most property 'bargain' lists are junk. They find a cheap listing, compare it to a suburb average, and call it a deal. Nobody checks whether the valuation is actually right.
We built an algorithm that checks. It pulls neighbourhood sales history, census data, comparable properties, crime stats, and more. Then it answers one question: is this discount real, or is the valuation just wrong?
Out of 9,329 Melbourne properties, only 1,412 passed. Average saving per property: $93,714. The biggest single saving was $504,659.
How Much Could You Save?
The average saving across all 1,412 genuine bargains is $93,714. But the range is wide.
At the top end, a 4-bed home on Burwood Highway in Vermont South showed a $504,659 saving. A 32% discount, with 83.9% confidence from the algorithm. At the other end, smaller deals in the $30,000 to $50,000 range still add up across a portfolio.
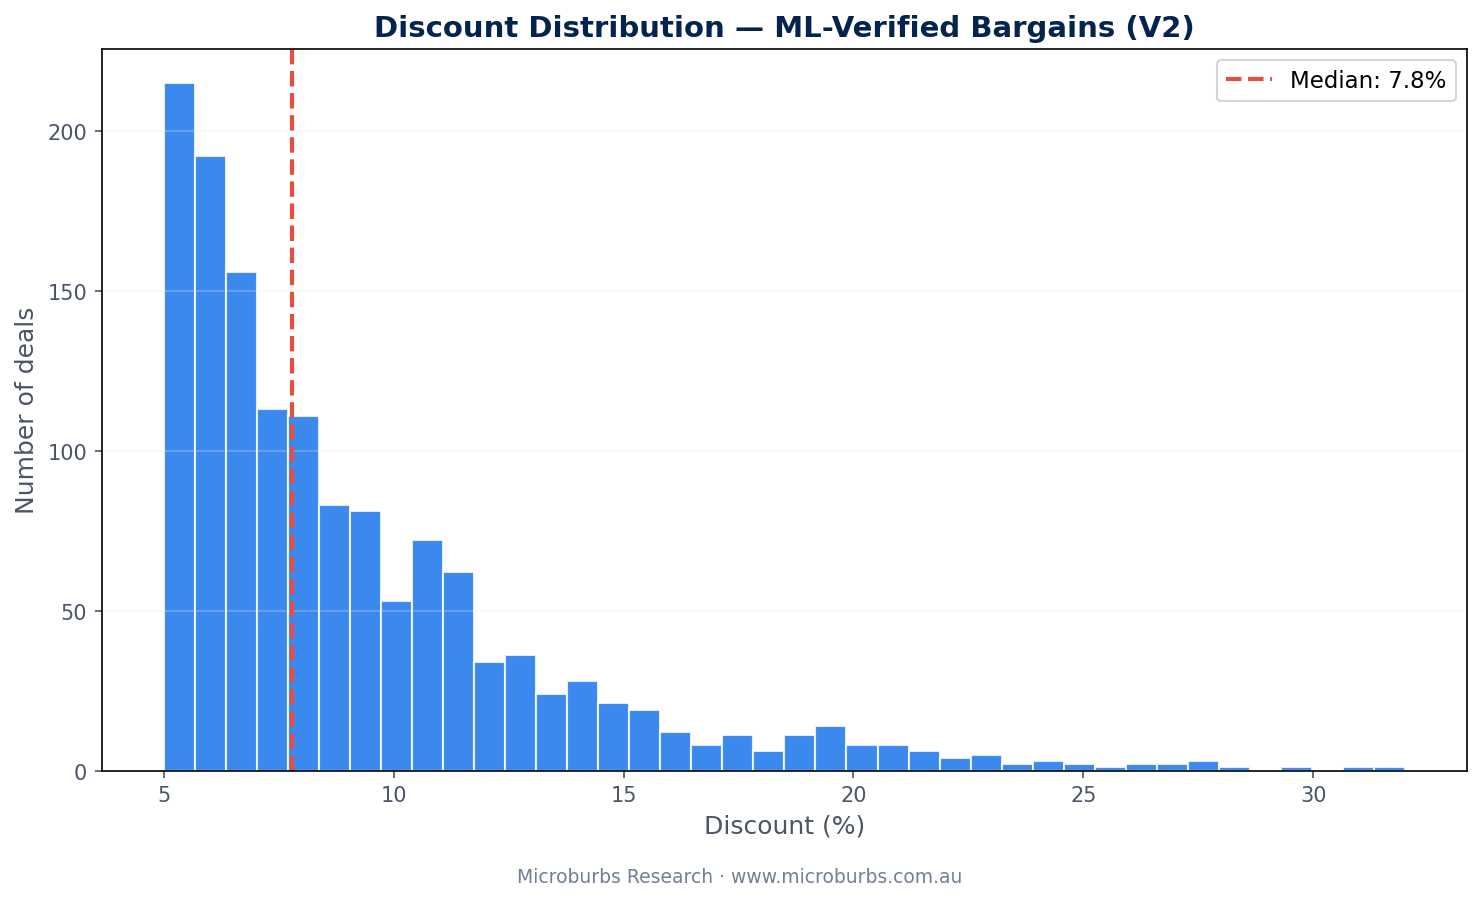
Most deals cluster in the 5% to 15% discount range. That is the sweet spot. Big enough to matter. Small enough that the valuation is still trustworthy.
Discounts above 30% do exist. But they are rare. And the algorithm treats them with extra scrutiny, because very large discounts are more likely to signal a valuation error than a genuine deal.
Are These Deals Real?
When the algorithm says a deal is genuine, it is right 94% of the time.
We tested this against 2,000 hand-checked properties. Not a backroom test. Real properties with real prices, verified by humans. The algorithm got it right on 94 out of every 100 calls.
And 90% of the 1,412 deals have a confidence score above 80%. That means 1,277 properties where the algorithm is strongly certain. Not guessing. Certain.
75.6% of deals (1,067 properties) have confidence above 99%. The algorithm knows when it knows.
Only 1 result out of 1,412 looked suspicious. A property at 14 Gibbs Rd, Montrose showing 0 bedrooms and 0 bathrooms with a 22.4% discount. The missing attributes suggest a data quality issue, not a real deal. One suspicious result out of 1,412. That is the kind of hit rate investors can act on.
Where Are the Best Deals?
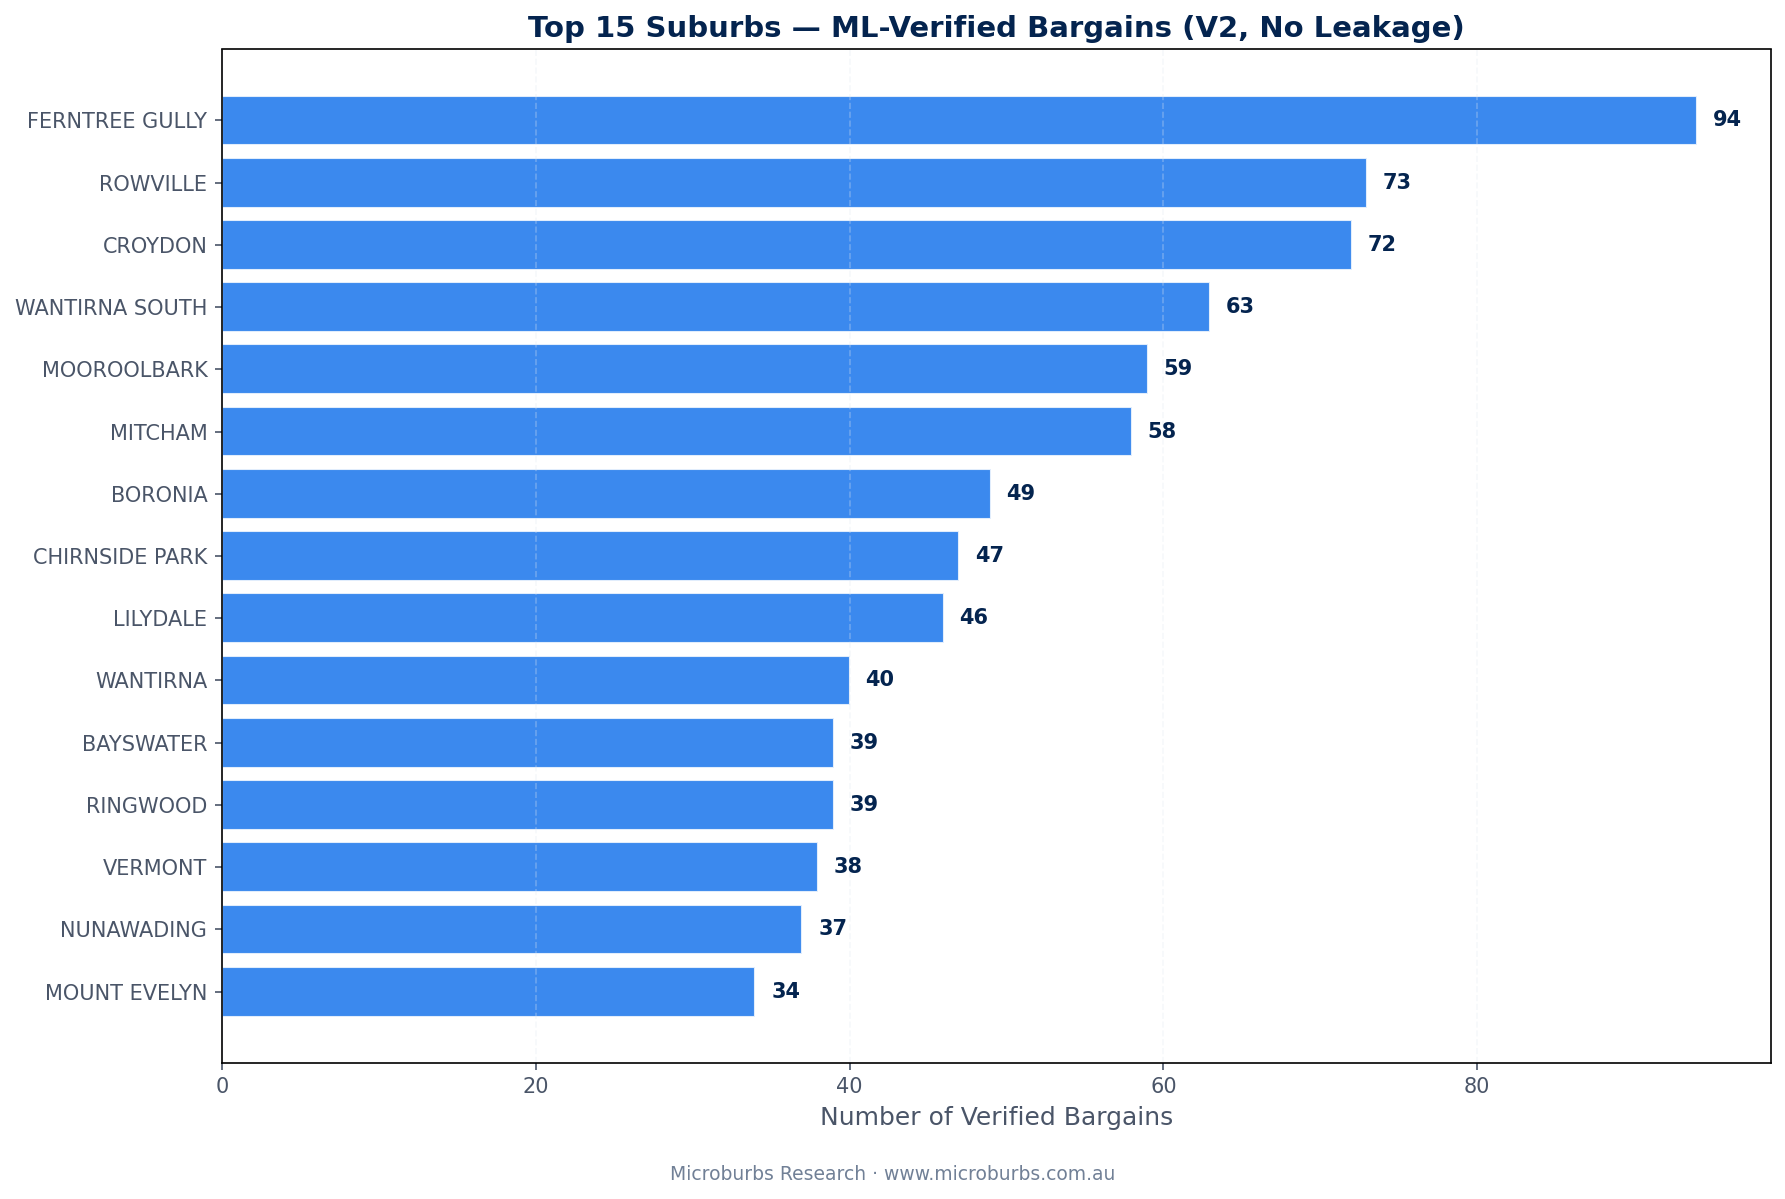
Melbourne's eastern suburbs dominate. The outer east has the highest concentration of genuine bargains by a wide margin.
| Rank | Suburb | Deals | Avg Discount | Avg Savings | Avg Confidence |
|---|---|---|---|---|---|
| 1 | Ferntree Gully | 94 | 8.9% | $82,292 | 93% |
| 2 | Rowville | 73 | 9.1% | $95,803 | 96% |
| 3 | Croydon | 72 | 9.1% | $88,666 | 99% |
| 4 | Wantirna South | 63 | 9.0% | $109,468 | 97% |
| 5 | Mooroolbark | 59 | 8.9% | $82,210 | 95% |
| 6 | Mitcham | 58 | 8.8% | $98,984 | 96% |
| 7 | Boronia | 49 | 10.0% | $89,150 | 98% |
| 8 | Chirnside Park | 47 | 8.0% | $75,033 | 99% |
| 9 | Lilydale | 46 | 10.2% | $91,498 | 92% |
| 10 | Wantirna | 40 | 9.1% | $106,140 | 94% |
| 11 | Bayswater | 39 | 9.2% | $82,558 | 97% |
| 12 | Ringwood | 39 | 8.8% | $89,100 | 94% |
| 13 | Vermont | 38 | 8.5% | $104,555 | 96% |
| 14 | Nunawading | 37 | 10.6% | $119,884 | 95% |
| 15 | Mount Evelyn | 34 | 9.8% | $86,746 | 95% |
Why the eastern suburbs? Two reasons.
First, these areas have high sales volumes. When more properties sell nearby, the valuation has more real sales to draw on. More data means a more reliable estimate. And a reliable estimate means a discount against it is more likely genuine.
Second, these suburbs sit in a price range ($600,000 to $1.1 million) where even a small percentage discount translates to meaningful dollar savings. A 9% discount on a $900,000 home is $81,000. That is real money.
Three Properties Worth a Look
Real addresses. Real savings. Each one passed our checks with high confidence.
Ferntree Gully and Mitcham both appear here and in the top suburbs table above. That is not a coincidence. These areas have stable valuations backed by high sales volumes. When our algorithm sees a discount in these suburbs, it trusts it.
How We Find These Deals
No gut feelings. No opinions dressed up as data. We check thousands of data points per property across seven different sources.
How We Check
We analyse neighbourhood sales history, comparable properties, census data, crime statistics, socioeconomic indexes, public housing ratios, and regional growth trends. Every property is checked against what is actually happening in its local area. Not the suburb average. The actual neighbourhood.
The algorithm was tested against 2,000 hand-checked properties. When it says a deal is genuine, it is right 94% of the time.
- Neighbourhood sales history. How many properties sold nearby in the past 6 to 24 months? More sales means a more reliable valuation. Fewer sales means more guesswork.
- Price stability. Are nearby sale prices consistent, or do they swing wildly? Stable prices mean reliable valuations. Wild swings mean the estimate could be off.
- Census and demographic data. Income levels, household types, owner-occupier rates. These ground-truth a suburb's real character.
- Crime statistics. Crime rates at the local level, not the suburb level. A street-level view, not a postcode-level guess.
- Socioeconomic indexes. ABS advantage and disadvantage scores for each area.
- Regional growth trends. Capital growth rates and yields at the regional level, so every deal is set in context.
What This Means for You
Every property listing that looks cheap is making a claim. It says the seller will accept less than the property is worth. Most of the time, that claim is wrong. The valuation is the thing that is off, not the price.
We checked 9,329 properties. Only 1,412 passed. Average saving: $93,714. When the algorithm flags a deal, it is right 94% of the time.
The property industry does not lack data. It lacks honesty about what the data actually tells us.
Data-Driven Property Research
No gut feelings. No opinions dressed up as data. Hyper-local analysis for every street in Australia.