We Trained a Model on 1,651 Features to Find Real Property Bargains
9,329 Melbourne properties. 1,651 data points each. One question: is that discount real or is the data wrong?

Most property 'bargain' tools work backwards. They find a cheap listing, compare it to a suburb median, and call it a deal. Nobody checks whether the valuation data is even correct.
We built a machine learning model that checks. It analyses 1,651 features per property and answers one question: is this discount caused by a genuine bargain or by bad data?
The model gets it right 98.6% of the time. It found 1,541 genuine deals across Melbourne. Average savings: $89,028 per property.
Why Hand-Tuned Rules Do Not Work
Our first attempt used a penalty scoring system. It was rules based. We wrote 12 hand-coded rules that checked for data quality issues. Missing bedrooms cost 30 penalty points. Missing land size cost 25. High price volatility cost 20.
The weights were arbitrary. No evidence behind any of the numbers. We picked them because they felt right.
Worse, the rules only checked 5 or 6 attributes out of 1,651 available. That is like diagnosing a patient by checking their temperature and ignoring every other vital sign.
The result: the old system missed 219 data errors that looked clean on the surface. Properties with complete attribute records but unreliable AVMs slipped through every time. The penalty system had no way to catch them.
How We Built the Model
We labelled 2,000 properties by hand. Each one got a binary label: genuine bargain or data error. This training set took weeks to build. There is no shortcut for ground truth.
We fed all 1,651 features to a LightGBM gradient boosted tree classifier. LightGBM is fast and handles mixed data types well. It does not require feature scaling. It is the right tool for tabular data with many columns.
What goes into 1,651 features?
- 1,559 AVM statistics: Price estimates at 12 geographic radii (100m to 50km) across 7 time windows (1 to 10 years). Medians, means, standard deviations, counts, and confidence intervals at each combination.
- 89 census variables: ABS 2021 data at SA1 level. Income, education, occupation, transport mode, household composition, age distribution.
- 3 derived features: Price-to-AVM ratio, property attribute completeness score, and neighbourhood volatility index.
The model decided for itself which features matter. We did not tell it what to look for.
What the Model Discovered
The feature importance results surprised us. Some of our strongest assumptions turned out to be wrong.
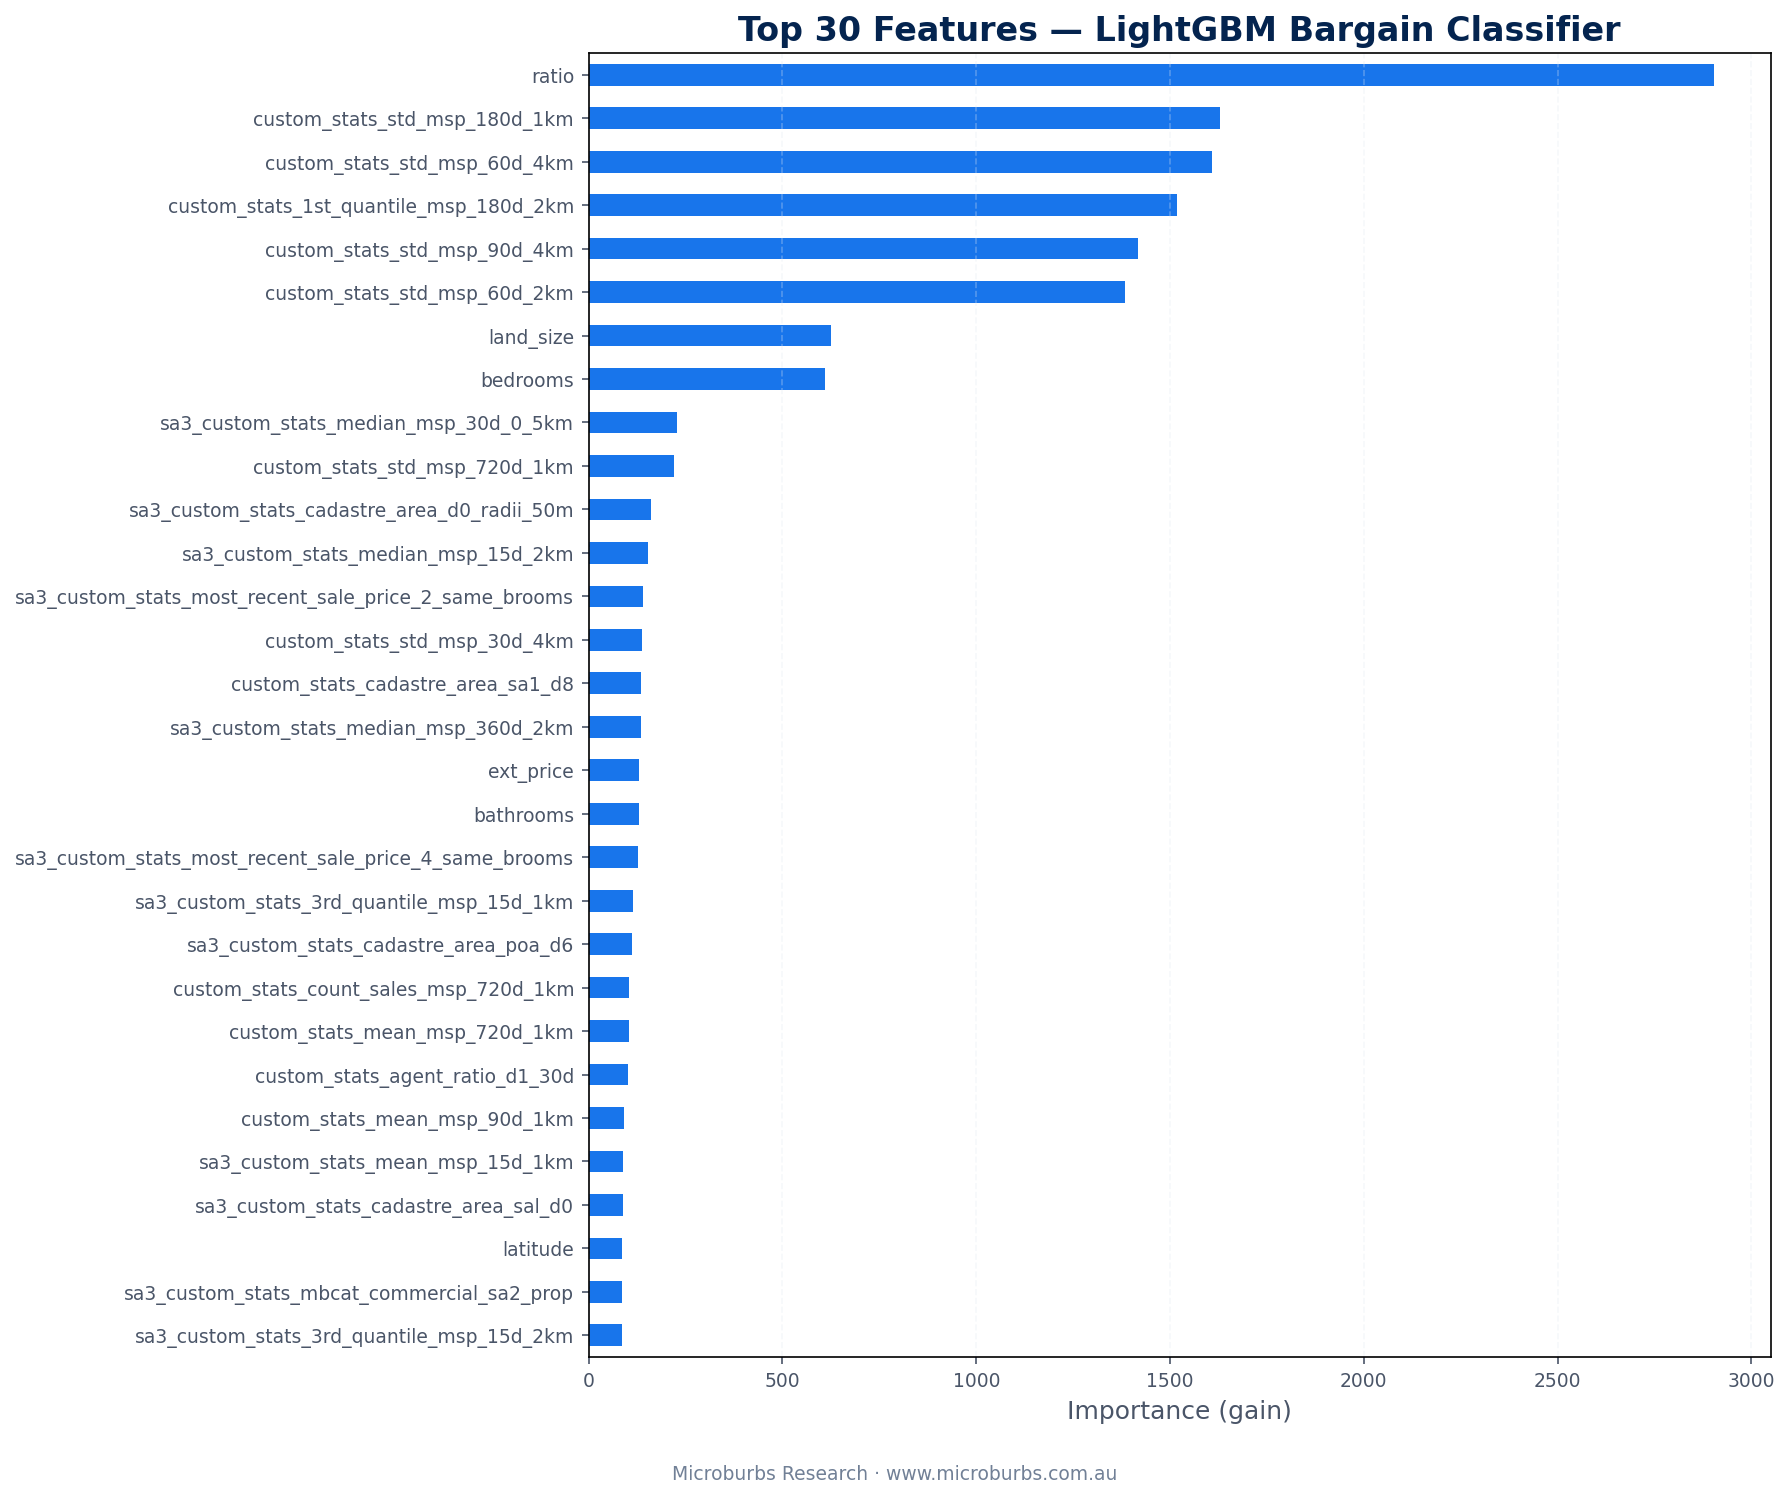
- 1Price-to-AVM ratio (the discount itself). The most important feature. Obvious. But the model uses it differently from a simple threshold. A 30% discount in a stable suburb means something different from a 30% discount in a volatile one. The model learns this interaction automatically.
- 2Local price standard deviations. This was the real discovery. High price volatility in the neighbourhood is the strongest signal that an AVM is unreliable. If comparable sales show a standard deviation of $200,000 or more, the AVM itself is uncertain. A 'discount' against an uncertain AVM is not a real discount.
- 3Property attribute completeness. Missing bedrooms and land size data track closely with AVM errors. When the AVM lacks basic inputs, its output is less trustworthy. The model picked this up on its own.
- 4Census variables added almost no value. Occupation types, transport modes, education levels. None of them predict data quality. This was a useful negative result. We can drop 89 features without losing accuracy.
Real Properties the Model Found
Three genuine bargains from the model's output. Each one passed all 1,651 feature checks with high confidence.
Ferntree Gully appears twice. Not a coincidence. The suburb shows up consistently because its AVM data is stable and well-supported by comparable sales. More on that below.
Where the Deals Are
Genuine bargains cluster in Melbourne's eastern suburbs. The outer east dominates the top 10.
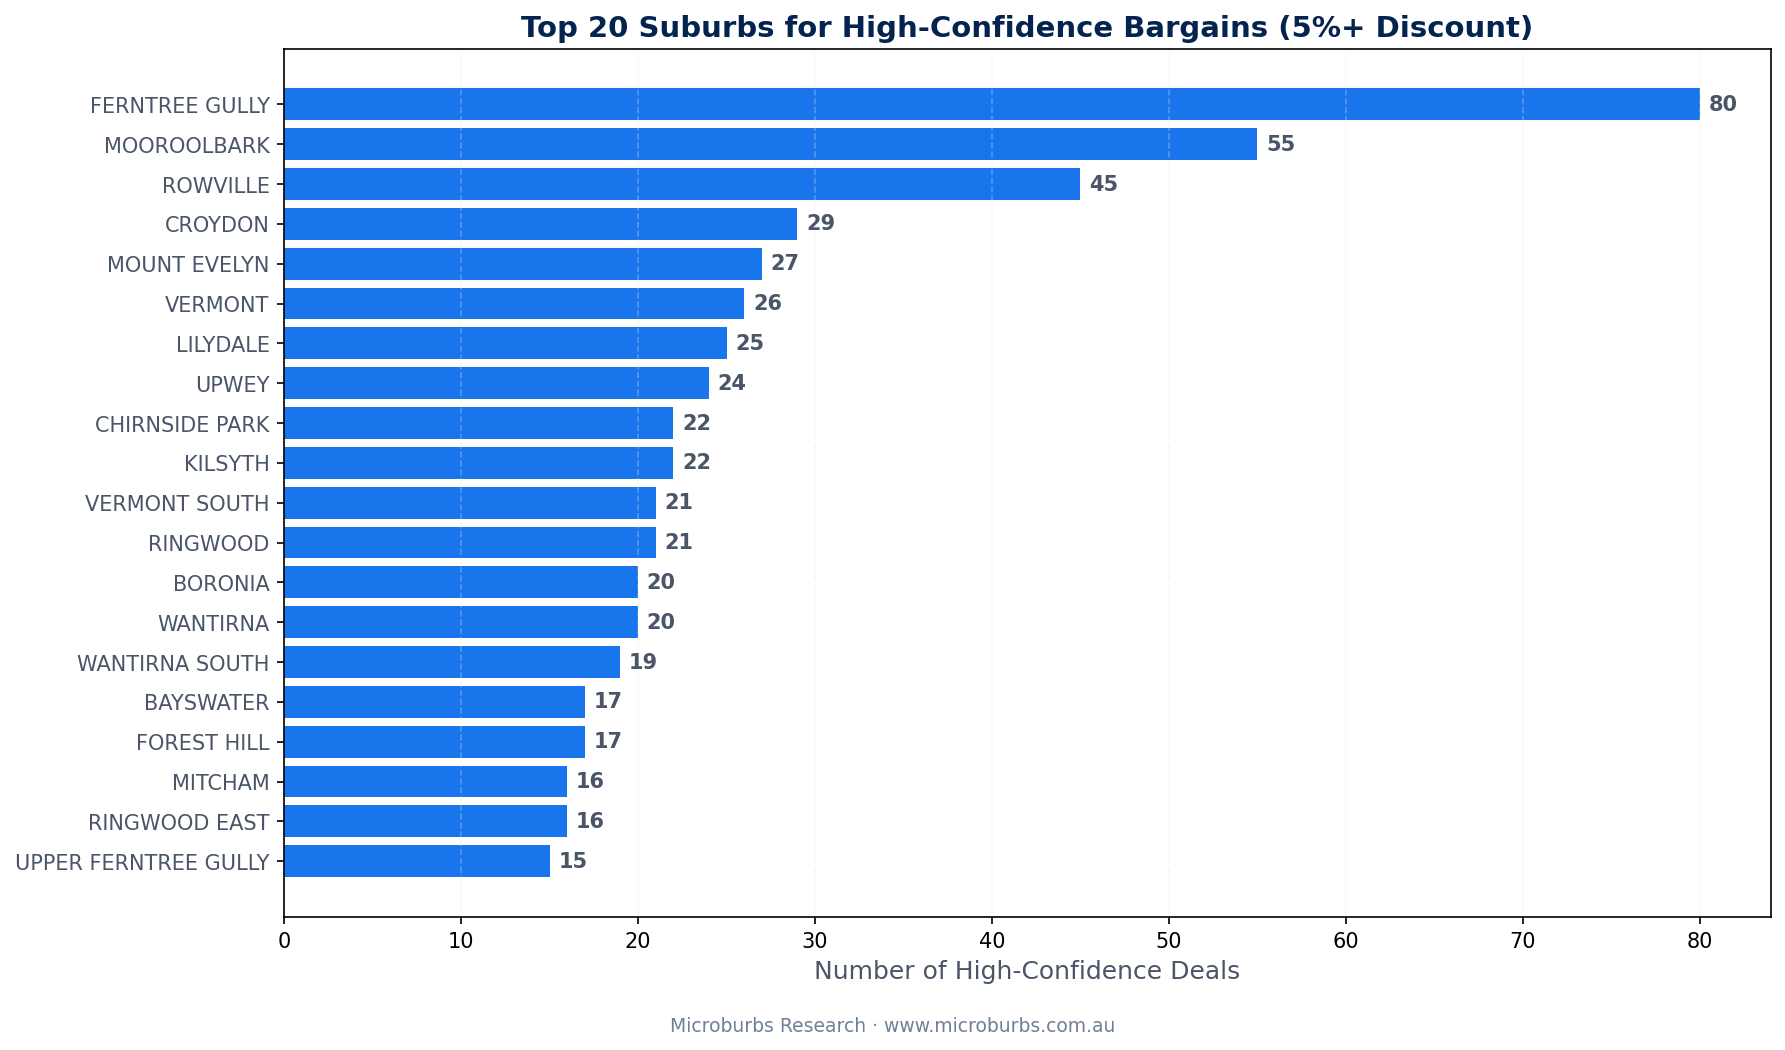
| Rank | Suburb | Genuine Deals |
|---|---|---|
| 1 | Ferntree Gully | 103 |
| 2 | Rowville | 90 |
| 3 | Croydon | 78 |
| 4 | Mooroolbark | 74 |
| 5 | Wantirna South | 63 |
| 6 | Mitcham | 55 |
| 7 | Chirnside Park | 53 |
| 8 | Boronia | 51 |
| 9 | Ringwood | 47 |
| 10 | Lilydale | 47 |
Why the eastern suburbs? Two reasons. First, these areas have high sales volumes. The AVM has plenty of comparable sales to work with. More data equals a more reliable valuation. Second, these suburbs sit in a price range ($600k to $1.1m) where small percentage discounts translate to meaningful dollar savings.
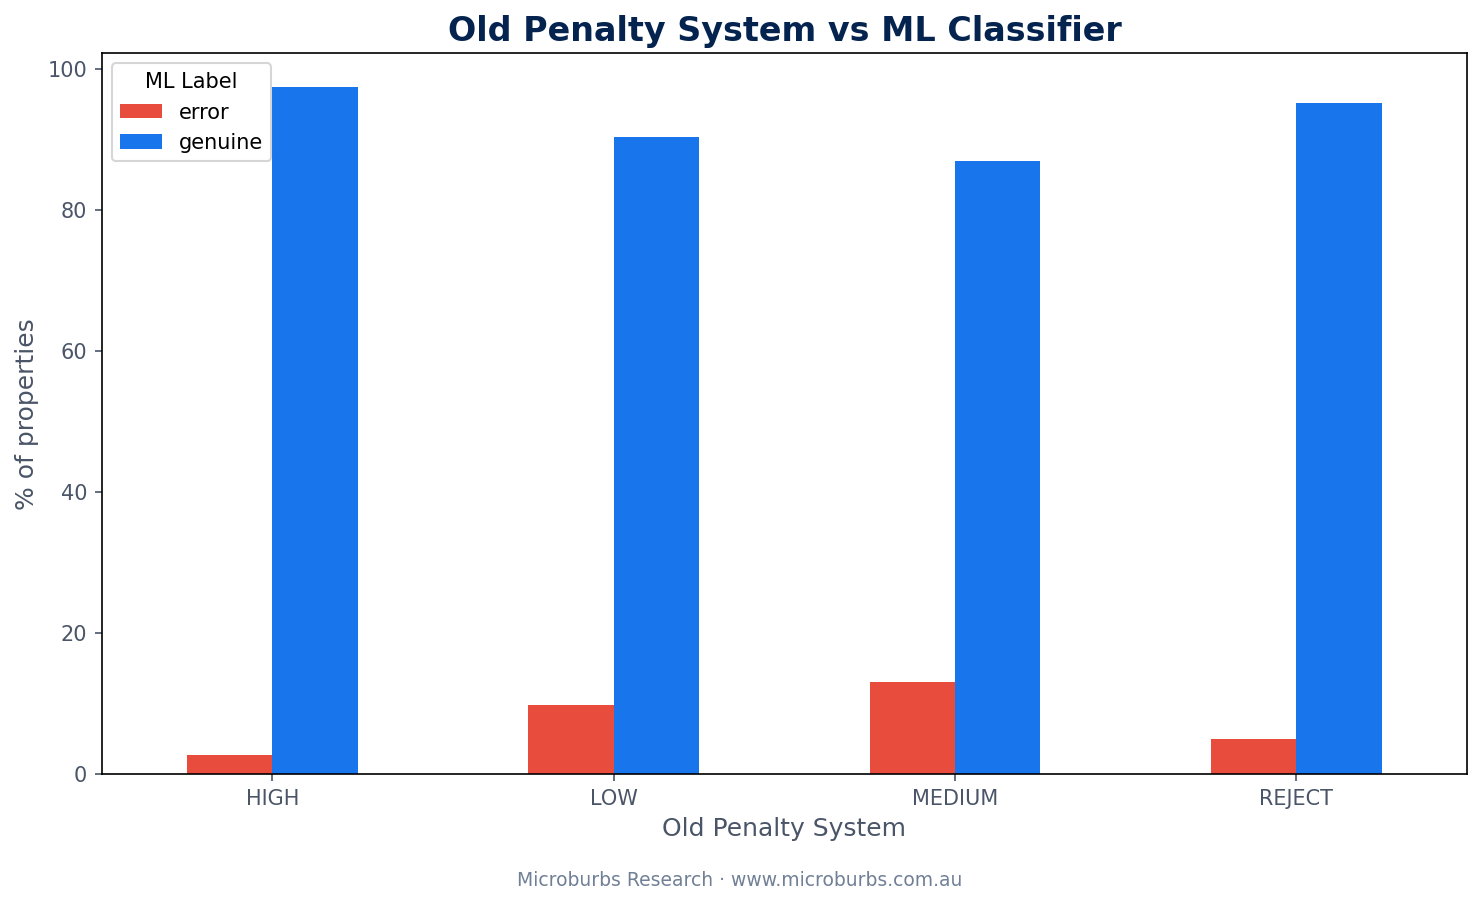
The Old System Got It Wrong in Both Directions
The penalty scoring system was not just worse. It was wrong in two opposite ways at the same time.
Old Penalty System
- Rated 8,386 properties as HIGH confidence
- 219 of those were actually data errors
- Rejected 41 properties outright
- 39 of those 41 were genuine bargains
ML Model
- Caught all 219 hidden errors
- Recovered 39 wrongly rejected bargains
- Uses 1,651 features instead of 6
- F1 score: 0.9864
Too lenient on one side. Too harsh on the other. This is the classic failure mode of rules-based systems. The rules are rigid. They cannot adapt to context.
A property with complete attribute data and a 28% discount might look perfect to the rule system. But if comparable sales in the area show a standard deviation of $250,000, the AVM is unreliable. The rule system has no way to know this. The ML model does.
How the Discounts Are Distributed
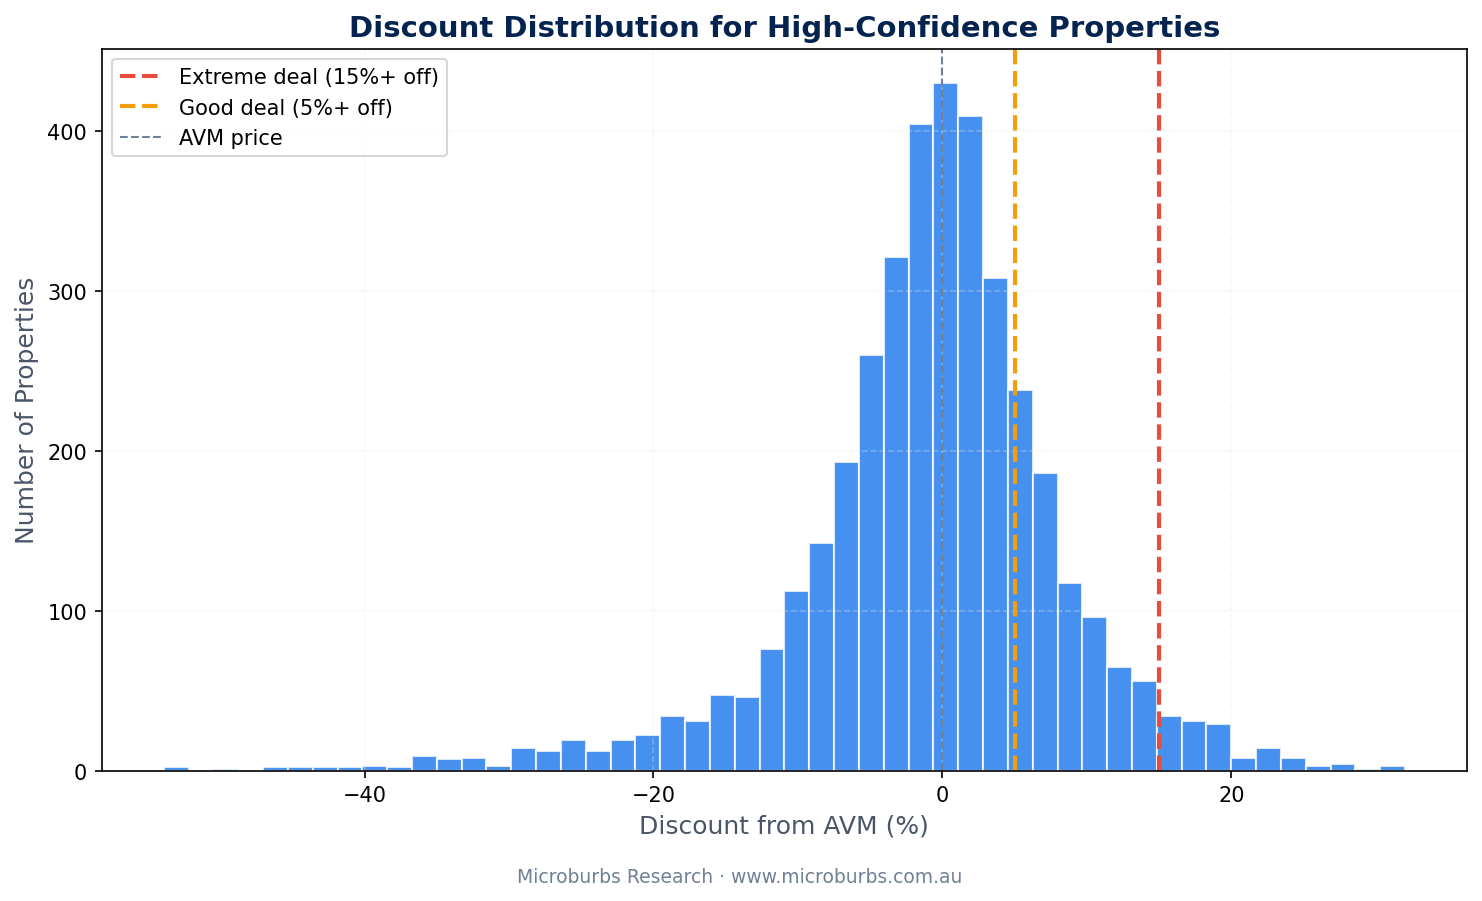
The distribution tells its own story. Very large discounts (over 40%) are more likely to be data errors. The model catches most of these. But the sweet spot for genuine bargains sits in the 15% to 30% range. Large enough to matter. Small enough to be plausible.
How We Validated This
Technical Specification
LightGBM binary classifier trained on 2,000 hand-labelled properties. Evaluated with 5-fold stratified cross-validation to prevent data leakage and ensure balanced class representation in each fold.
Census data sourced from ABS 2021 at SA1 level. Geographic joining via GNAF mesh block codes. AVM statistics computed from 90 million historical listings across all Australian capital cities.
An F1 of 0.9864 means the model almost never makes mistakes in either direction. It catches genuine errors and does not reject real bargains. The AUC of 0.9855 confirms that the model separates the two classes cleanly across all probability thresholds.
We did not cherry-pick these numbers. Five-fold cross-validation means the model was tested on data it never saw during training. Five times. The scores are averaged across all five folds.
What This Means for Investors
Every property listing that looks like a bargain is making a claim. It is claiming the seller will accept less than the property is worth. Most of the time, that claim is wrong. The AVM is the one making the error, not the seller.
A model that can tell the difference is worth having. Not because it is perfect. But because it checks 1,651 things that no human investor could check manually.
The property industry does not lack data. It lacks rigour.
Data-Driven Property Research
No gut feelings. No opinions dressed up as data. Hyper-local analysis for every street in Australia.