Can Investors Pick Capital Growth?
Testing whether suburbs searched on Microburbs experience higher capital growth in the months after those searches. With a deep look at how lookback period changes the relationship between past and future growth.
25 February 2026 · microburbs.com.au
Contents
Methodology
The temporal ordering problem
To test whether search activity predicts growth, the growth must be measured after the searches. Microburbs search data runs from February 2025 to February 2026. Price data ends at February 2026. If we correlate total searches with total-period growth, the growth is concurrent with the searches, not subsequent. Any positive correlation could simply mean users search suburbs that are currently growing.
Solution: split the timeline
We split the data at a cutoff date. Searches before the cutoff form the "search signal". Growth after the cutoff is the "outcome". The primary analysis uses an August 2025 cutoff: searches from February to July 2025 (40,111 events across 2,273 suburbs), with subsequent growth measured from August 2025 to February 2026 (6 months).
Multiple lookback periods
Past growth is measured at five lookback periods: 1 month, 3 months, 6 months, 1 year, and 3 years, all ending at August 2025. This reveals whether the relationship between past and future growth depends on the time horizon.
Data sources
- Search events: Microburbs platform (free user GENERATION and VISIT events)
- Suburb prices: Smart median hedonic prices (SAL-level, houses only)
- Geographic mapping: ABS concordance (SAL to GCCSA)
- Correlation method: Spearman rank (non-parametric, robust to outliers)
Past Growth Lookback: Reversion vs Momentum
The relationship between past growth and subsequent growth depends heavily on the lookback period. Short lookbacks show strong mean reversion. Longer lookbacks show momentum. The crossover point is between 1 year and 3 years.
| Past Growth Period | Suburbs | Spearman r | Significance | Pattern |
|---|---|---|---|---|
| Past 1mo | 2,272 | -0.1417 | p<0.001 | reversion |
| Past 3mo | 2,273 | -0.2631 | p<0.001 | reversion |
| Past 6mo | 2,272 | -0.3093 | p<0.001 | reversion |
| Past 1yr | 2,269 | -0.1648 | p<0.001 | reversion |
| Past 3yr | 2,268 | +0.1706 | p<0.001 | momentum |
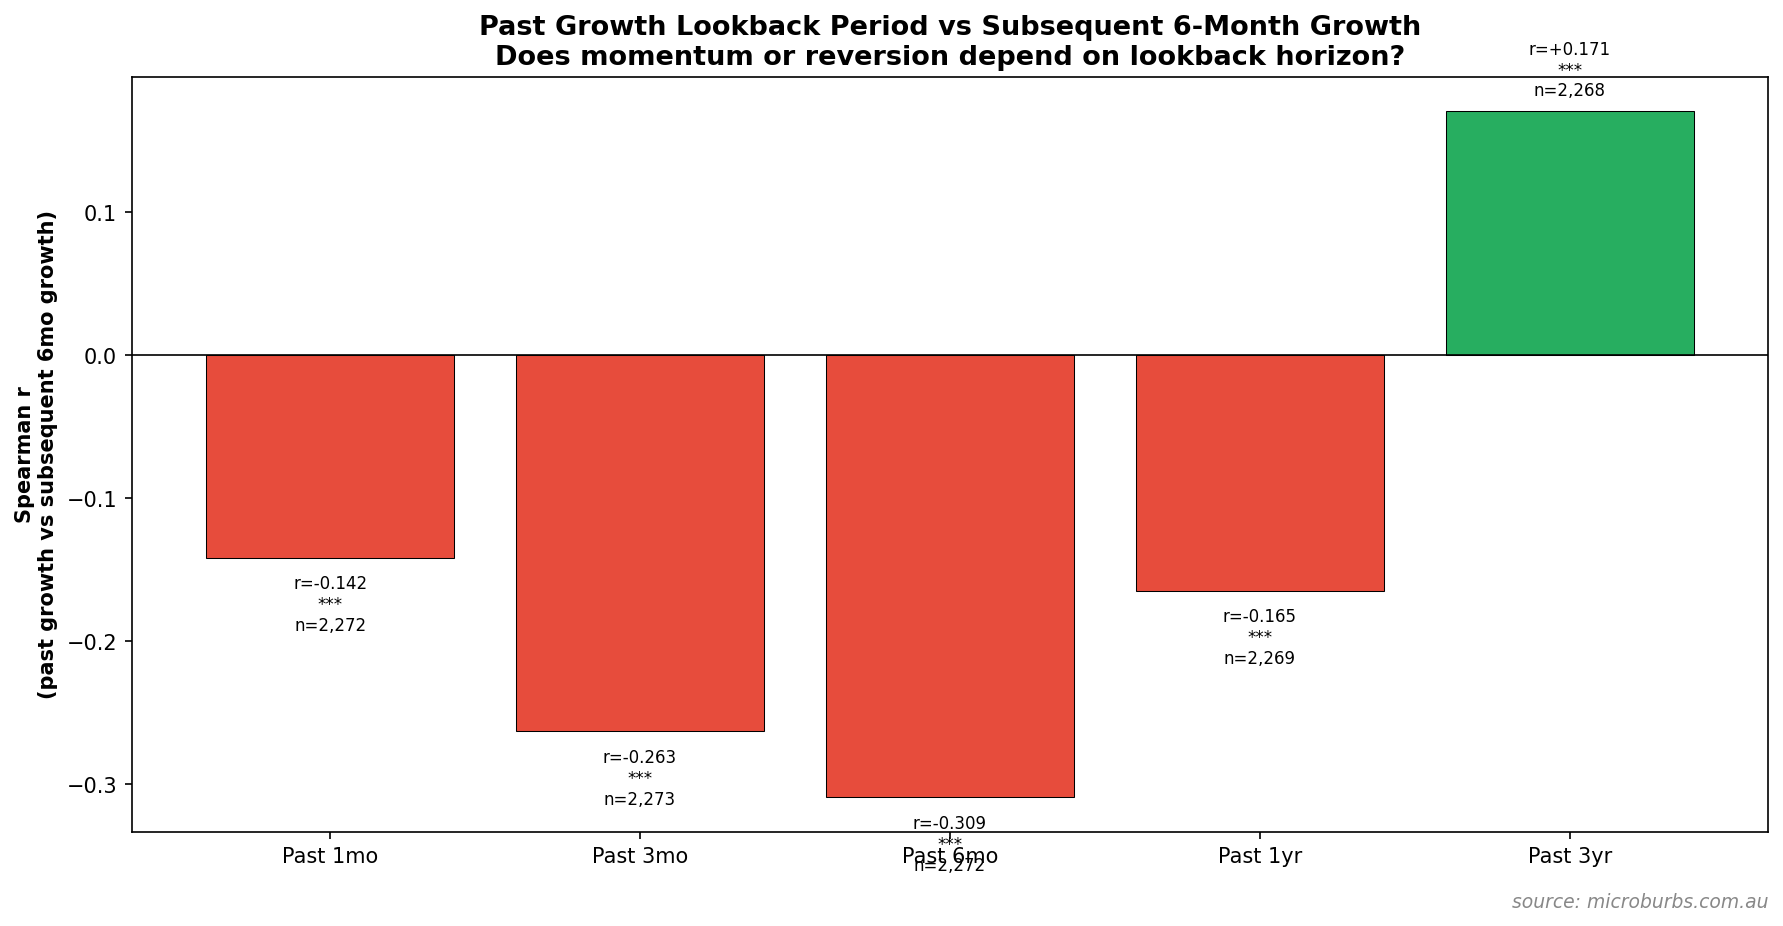
Short-term reversion, long-term momentum
All lookback periods up to 1 year show statistically significant mean reversion (p < 0.001). The strongest effect is at 6 months (r = -0.309): suburbs that grew most in the prior 6 months subsequently grew least. At 3 years the pattern flips to momentum (r = +0.171): long-term winners keep winning.
The 6-month lookback is the strongest predictor
A 6-month lookback produces the strongest negative correlation with subsequent growth. D1 suburbs (worst prior 6-month growth at -7.1%) rebounded to +11.9% over the following 6 months. D10 suburbs (best prior 6-month growth at +19.1%) grew only +1.8%. That is a 10.1 percentage point gap.
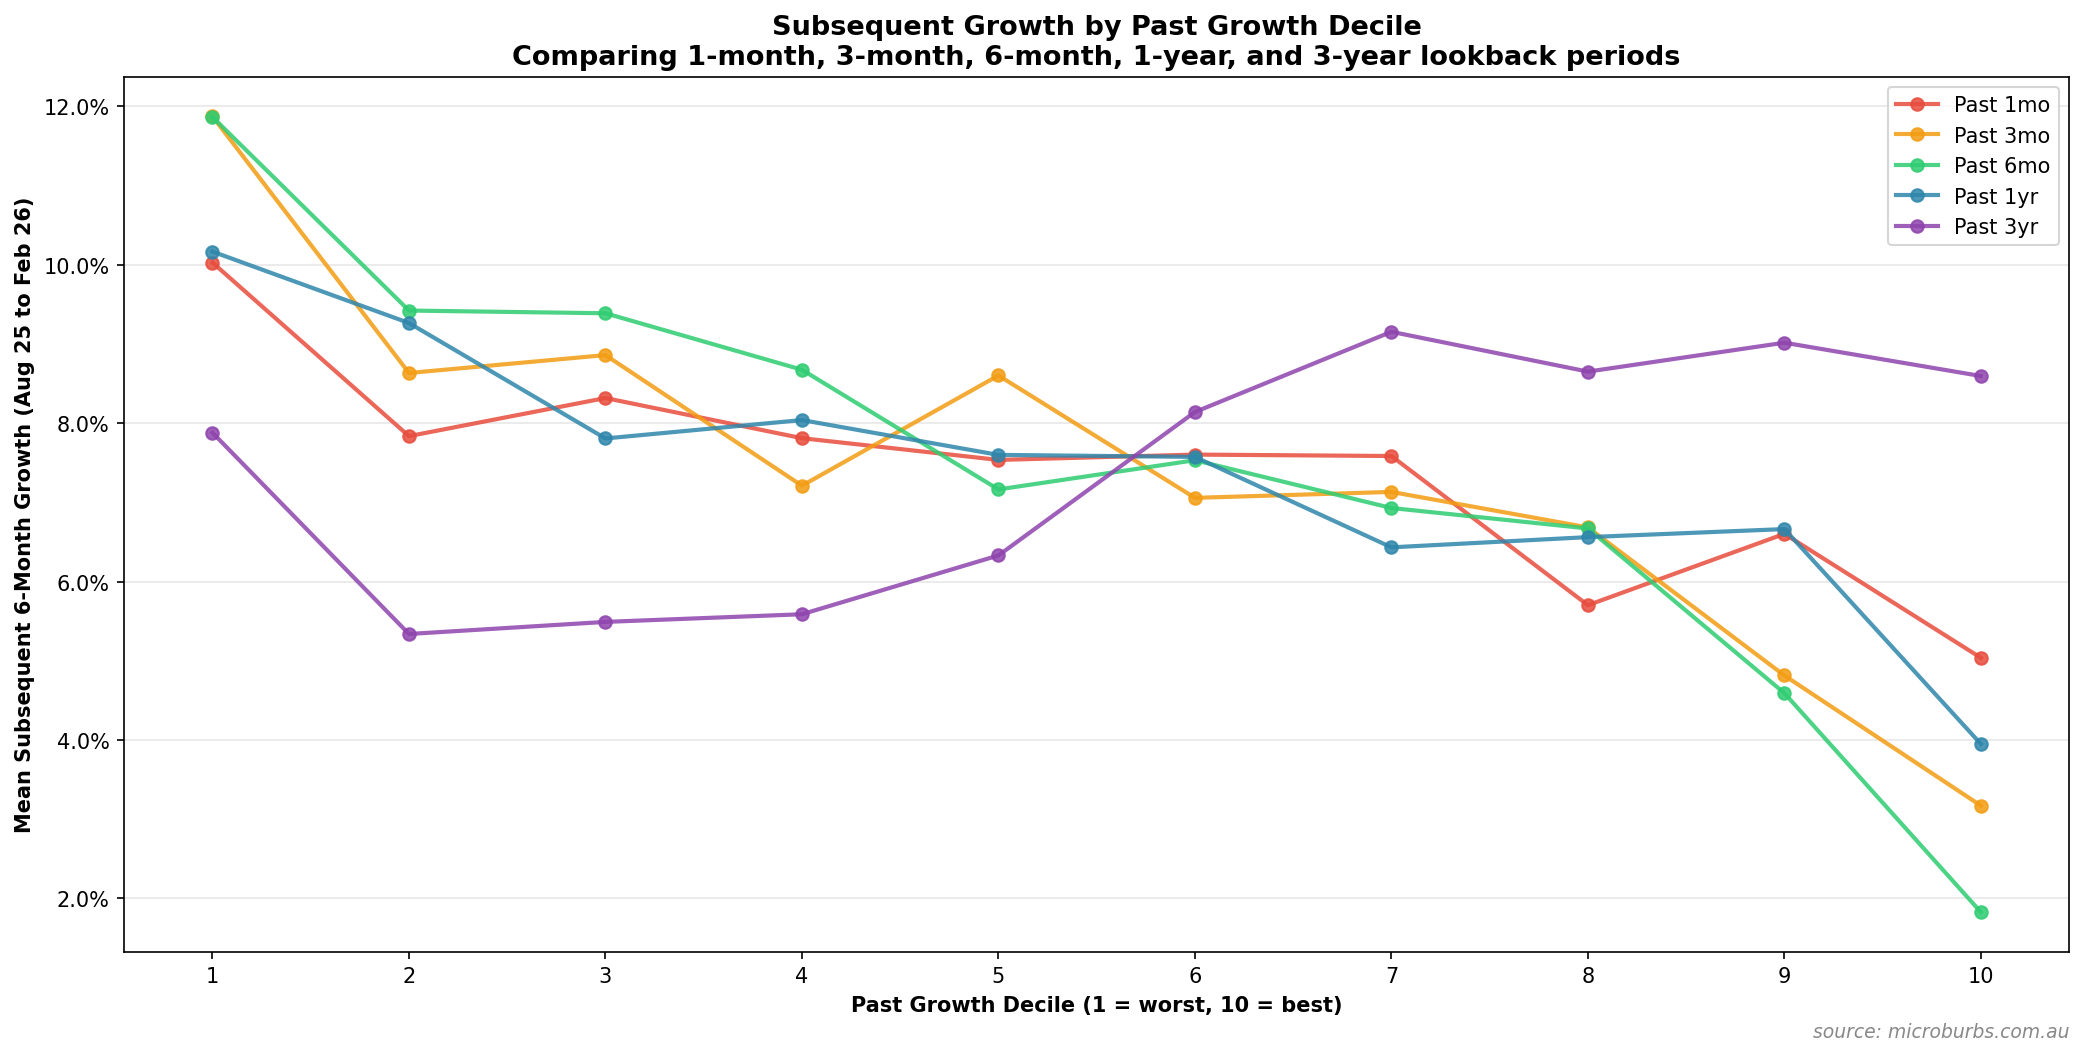
Decile Analysis by Lookback Period
The chart below shows subsequent 6-month growth for each past-growth decile, at each lookback period. Downward-sloping lines indicate mean reversion. The 6-month line shows the steepest downward slope.
Detailed decile table
| Past 6mo Decile | Suburbs | Past Growth | Subsequent 6mo | Searches |
|---|---|---|---|---|
| D1 (worst) | 228 | -7.1% | +11.9% | 7 |
| D2 | 227 | -1.8% | +9.4% | 9 |
| D3 | 227 | +0.4% | +9.4% | 12 |
| D4 | 227 | +2.3% | +8.7% | 13 |
| D5 | 227 | +4.0% | +7.2% | 14 |
| D6 | 227 | +5.5% | +7.5% | 13 |
| D7 | 227 | +7.3% | +6.9% | 14 |
| D8 | 227 | +9.3% | +6.7% | 20 |
| D9 | 227 | +12.0% | +4.6% | 17 |
| D10 (best) | 228 | +19.1% | +1.8% | 17 |
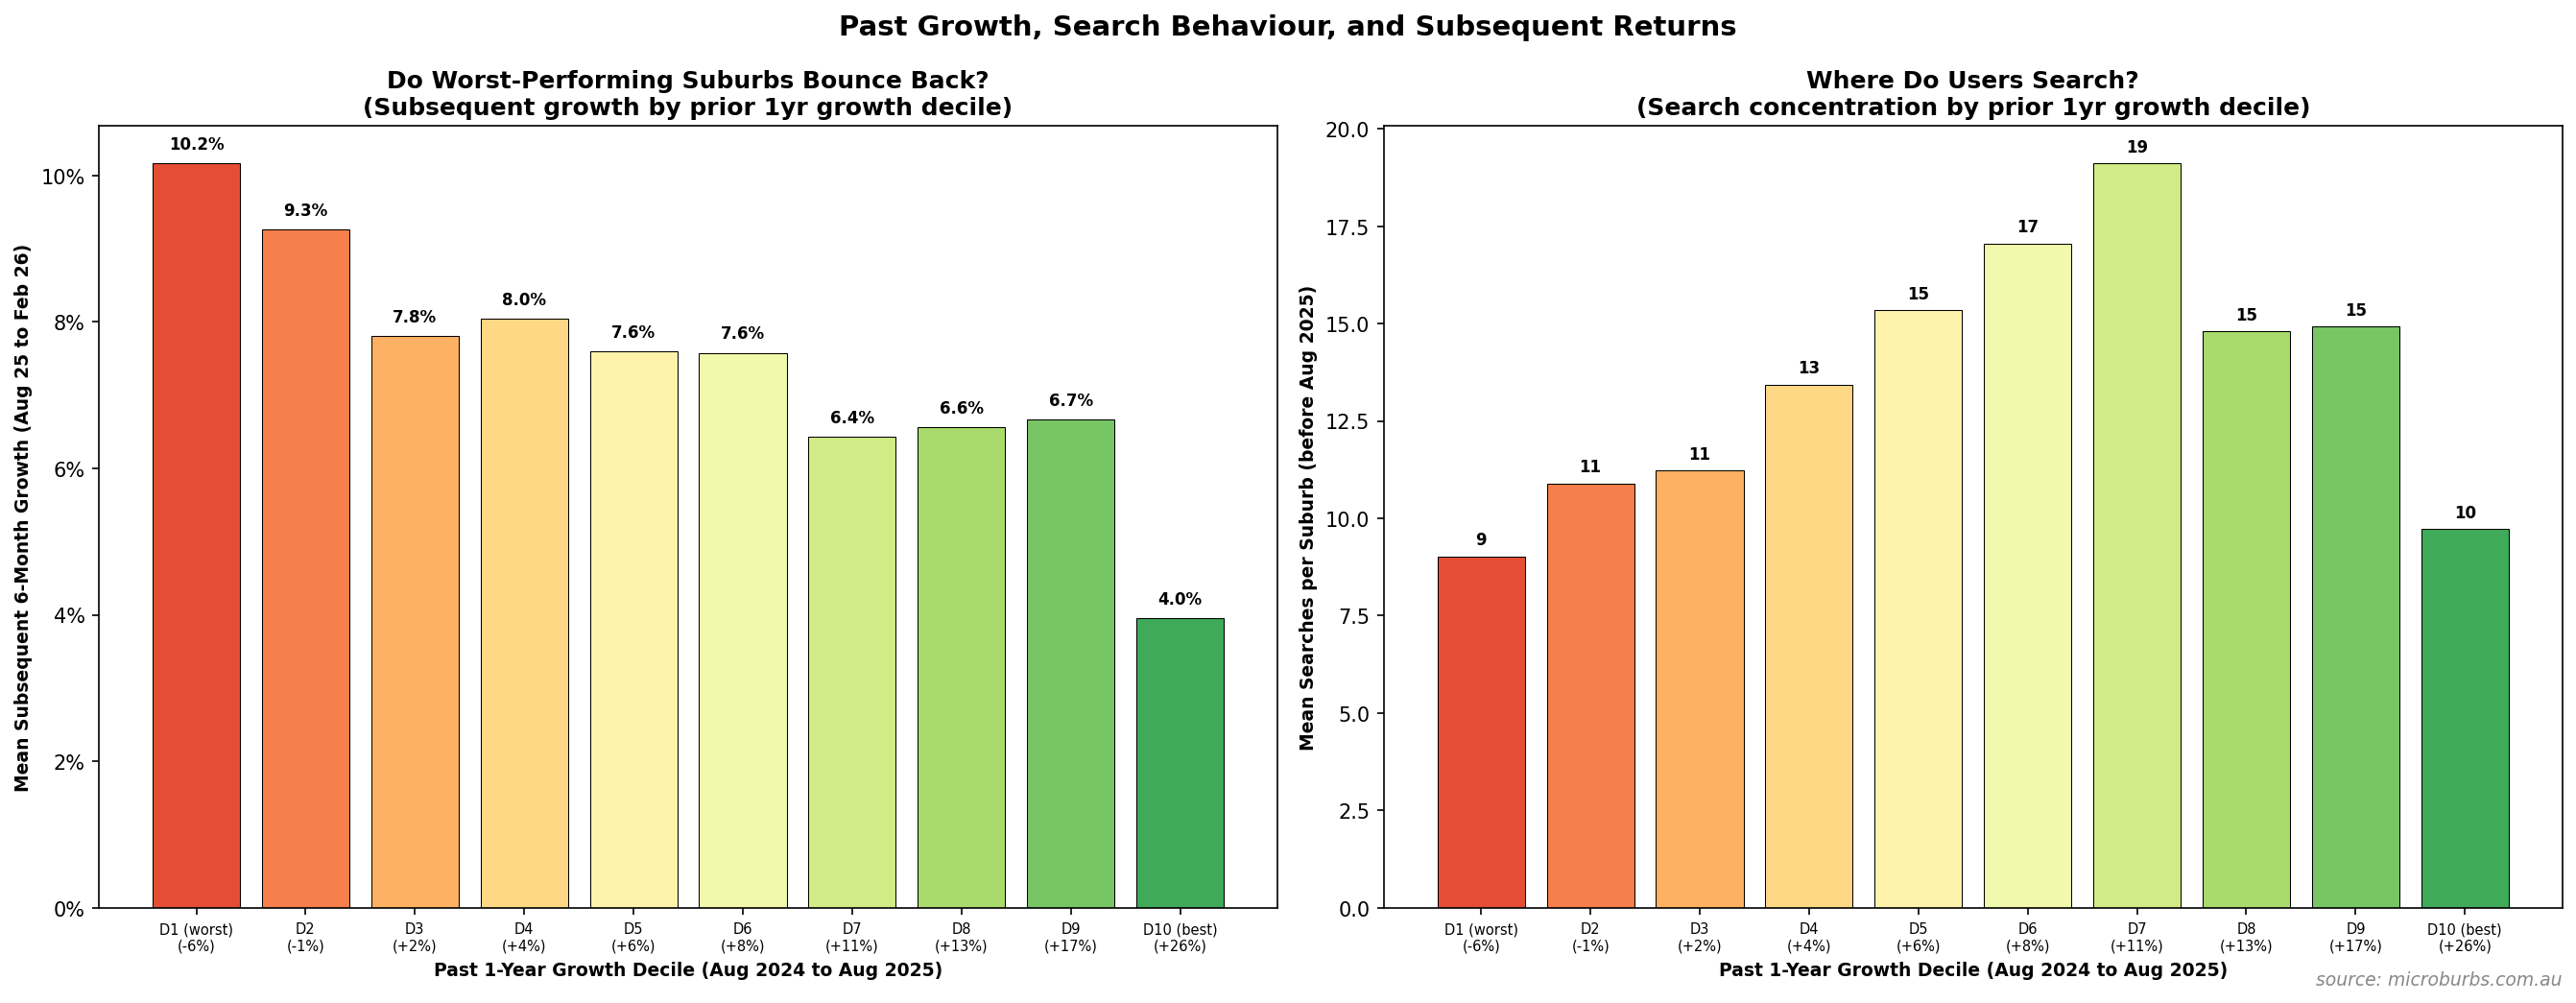
Users search the middle, not the extremes
At the 1yr lookback, Microburbs users concentrated searches in deciles 5-7 (moderate growth suburbs). The fastest-growing deciles (D9-D10) attracted the fewest searches. Users are not chasing past winners. At shorter lookbacks, search intensity is flat across deciles, suggesting users do not actively target short-term dips either.
Search Intensity vs Subsequent Growth
Each row tests a different timeline split. Spearman rank correlation tests whether suburbs with more searches experienced higher subsequent growth. The correlation is tested at five different cutoff points to check consistency.
| Search / Growth Window | Searches | Suburbs | Spearman r | Significance | Mean Growth |
|---|---|---|---|---|---|
| Before Jun 25 → Jun-Feb | 1,270 | 433 | -0.0326 | n.s. | +8.8% |
| Before Aug 25 → Aug-Feb | 40,111 | 2,273 | -0.0267 | n.s. | +7.4% |
| Before Oct 25 → Oct-Feb | 107,864 | 4,432 | -0.0169 | n.s. | +4.2% |
| Before Nov 25 → Nov-Feb | 153,945 | 4,434 | -0.0609 | p<0.001 | +2.6% |
| Before Dec 25 → Dec-Feb | 179,864 | 4,415 | -0.0733 | p<0.001 | +1.5% |
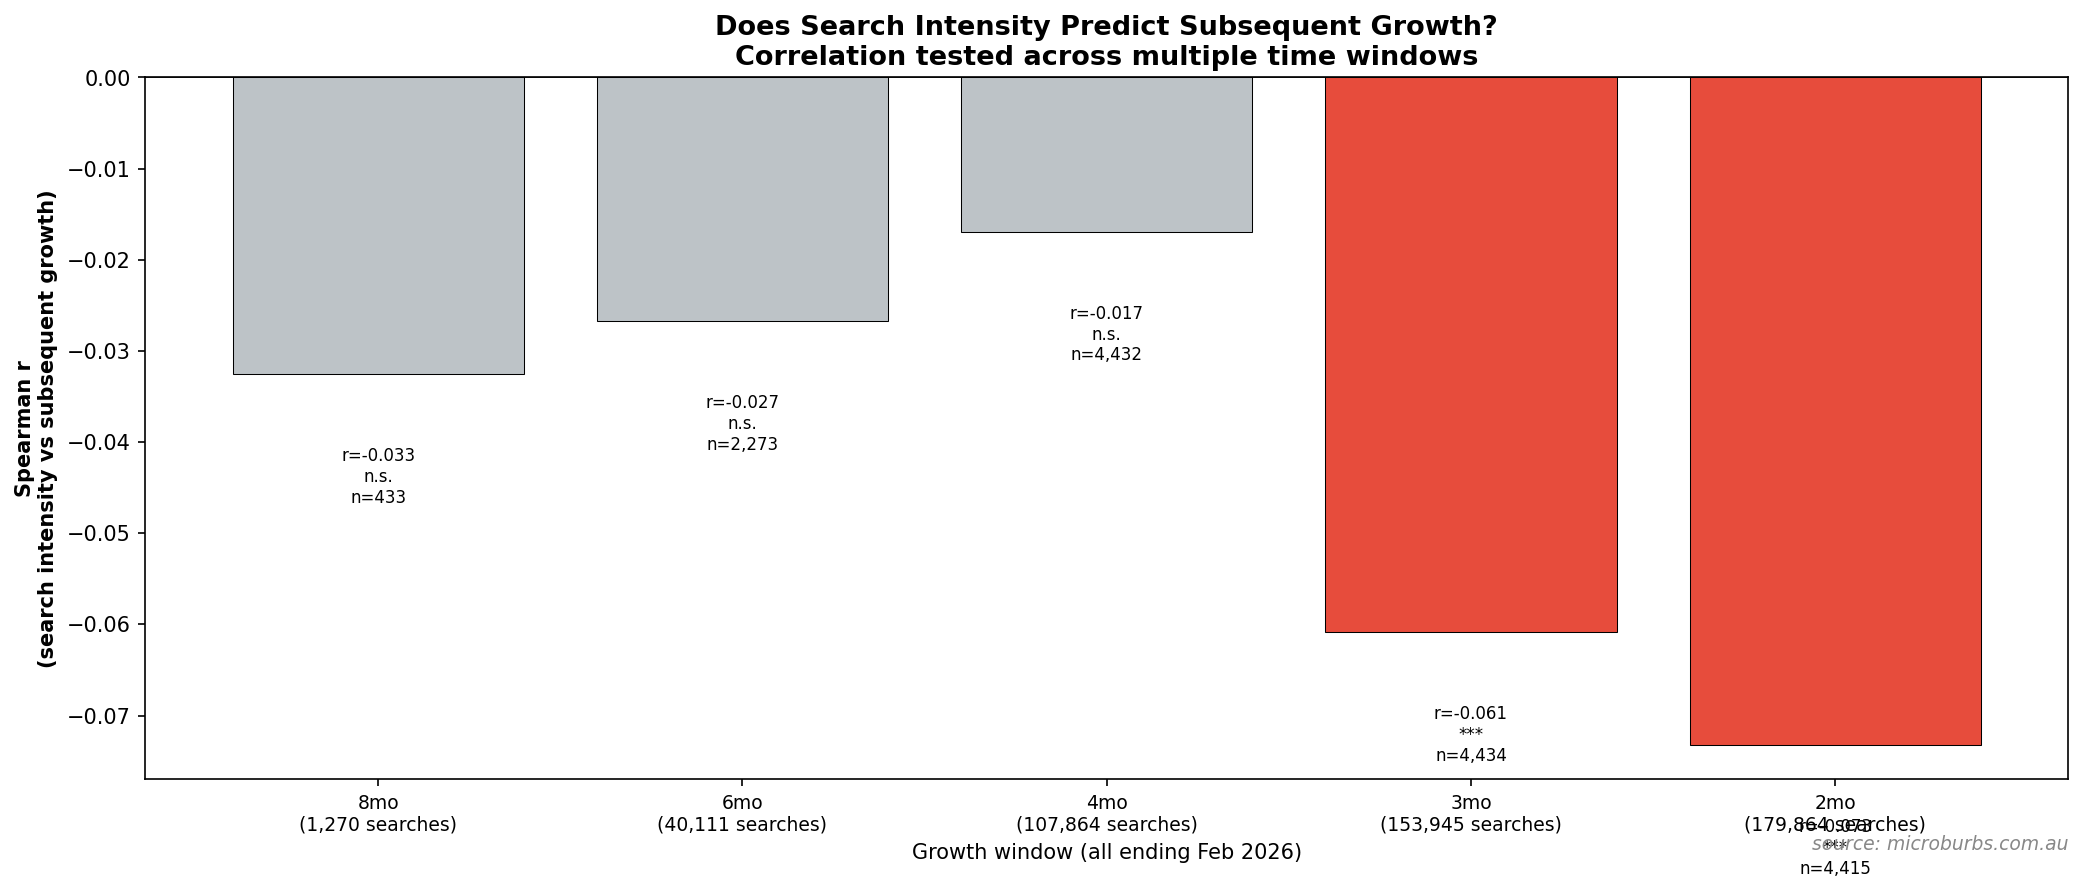
No overall search-predicts-growth signal
The correlation between search intensity and subsequent growth is consistently slightly negative across all five windows. It becomes statistically significant at shorter windows (3 and 2 months), where larger sample sizes (4,400+ suburbs) provide more power. More-searched suburbs do not subsequently outgrow less-searched suburbs overall.
By Greater Capital City Region
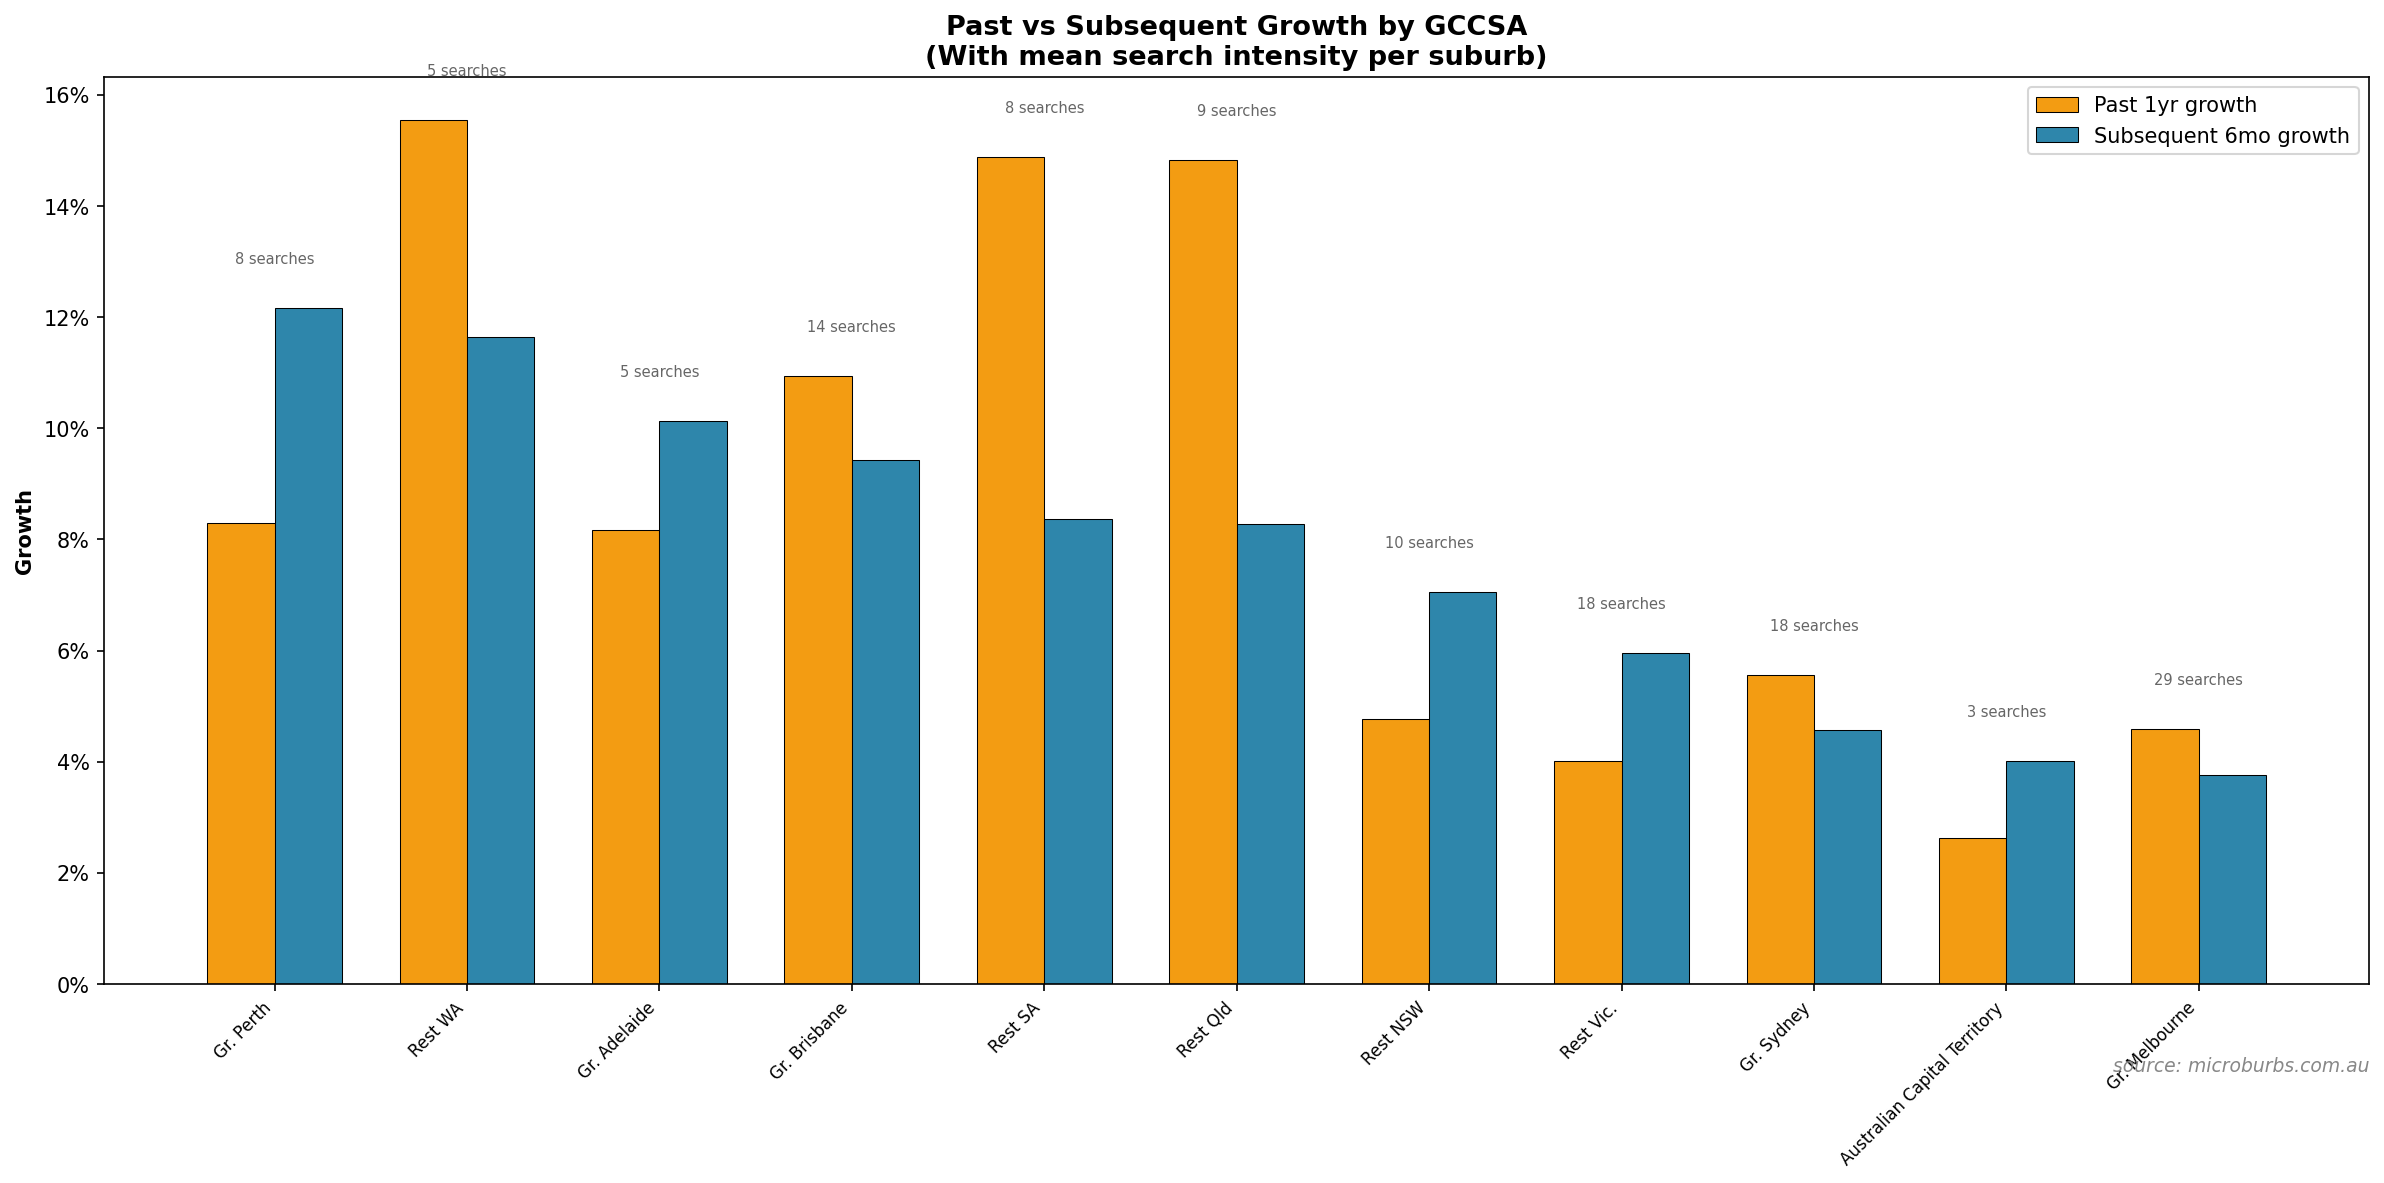
Growth rates vary substantially by region. This table shows past and subsequent growth at the GCCSA level, along with mean search intensity per suburb.
| GCCSA | Suburbs | Past 1yr Growth | Subsequent 6mo | Mean Searches |
|---|---|---|---|---|
| Greater Perth | 207 | +8.3% | +12.2% | 8 |
| Rest of WA | 59 | +15.5% | +11.7% | 5 |
| Greater Adelaide | 205 | +8.2% | +10.1% | 5 |
| Greater Brisbane | 240 | +10.9% | +9.4% | 14 |
| Rest of SA | 41 | +14.9% | +8.4% | 8 |
| Rest of Qld | 303 | +14.8% | +8.3% | 9 |
| Rest of NSW | 355 | +4.8% | +7.1% | 10 |
| Rest of Vic. | 173 | +4.0% | +6.0% | 18 |
| Greater Sydney | 360 | +5.6% | +4.6% | 18 |
| Australian Capital Territory | 51 | +2.6% | +4.0% | 3 |
| Greater Melbourne | 271 | +4.6% | +3.8% | 29 |
Within each GCCSA: does search intensity predict growth?
| GCCSA | Suburbs | Spearman r | Significance |
|---|---|---|---|
| Rest of NSW | 355 | +0.1398 | p<0.01 |
| Greater Brisbane | 240 | +0.1340 | p<0.05 |
| Rest of Vic. | 173 | +0.1084 | n.s. |
| Rest of Qld | 303 | +0.1083 | n.s. |
| Australian Capital Territory | 51 | +0.0979 | n.s. |
| Greater Perth | 207 | +0.0415 | n.s. |
| Rest of WA | 59 | +0.0177 | n.s. |
| Greater Adelaide | 205 | -0.0042 | n.s. |
| Greater Sydney | 360 | -0.0541 | n.s. |
| Greater Melbourne | 271 | -0.0604 | n.s. |
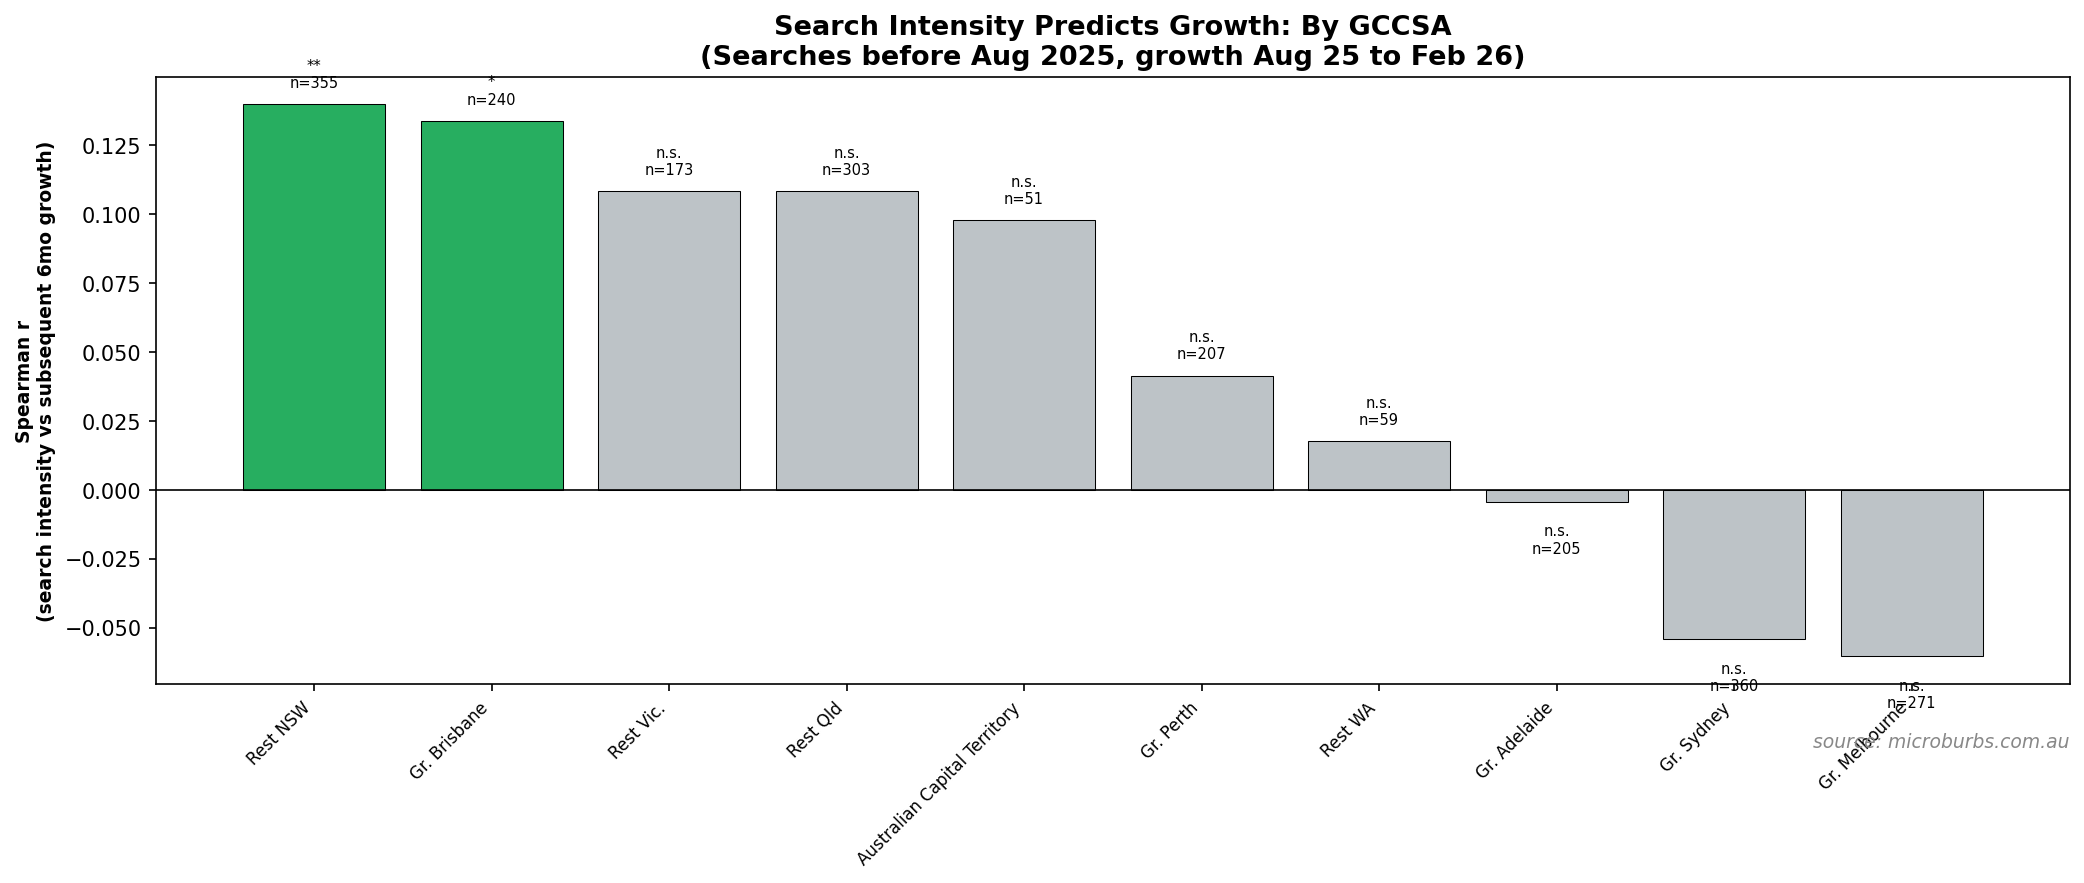
Regional winners: Brisbane and regional NSW
Within Greater Brisbane, more-searched suburbs grew more in the subsequent 6 months (r = +0.134, p = 0.038). Rest of NSW shows an even stronger signal (r = +0.140, p = 0.008). These are the two regions where Microburbs search activity meaningfully predicts subsequent suburb-level capital growth.
Within-Region Relative Performance
For each suburb, we compute growth relative to its GCCSA median. "Lagging" suburbs grew less than their region in the past year. Do they then catch up?
| Relative Performance | Suburbs | Rel Past 1yr | Rel Subseq 6mo | Abs Subseq | Searches |
|---|---|---|---|---|---|
| Q1 most lagging | 454 | -10.7pp | +3.5pp | +11.2% | 9 |
| Q2 | 454 | -3.9pp | +1.0pp | +8.3% | 11 |
| Q3 | 453 | +0.0pp | +0.5pp | +7.6% | 14 |
| Q4 | 454 | +4.0pp | -1.4pp | +5.8% | 17 |
| Q5 most leading | 454 | +11.8pp | -3.7pp | +4.1% | 16 |
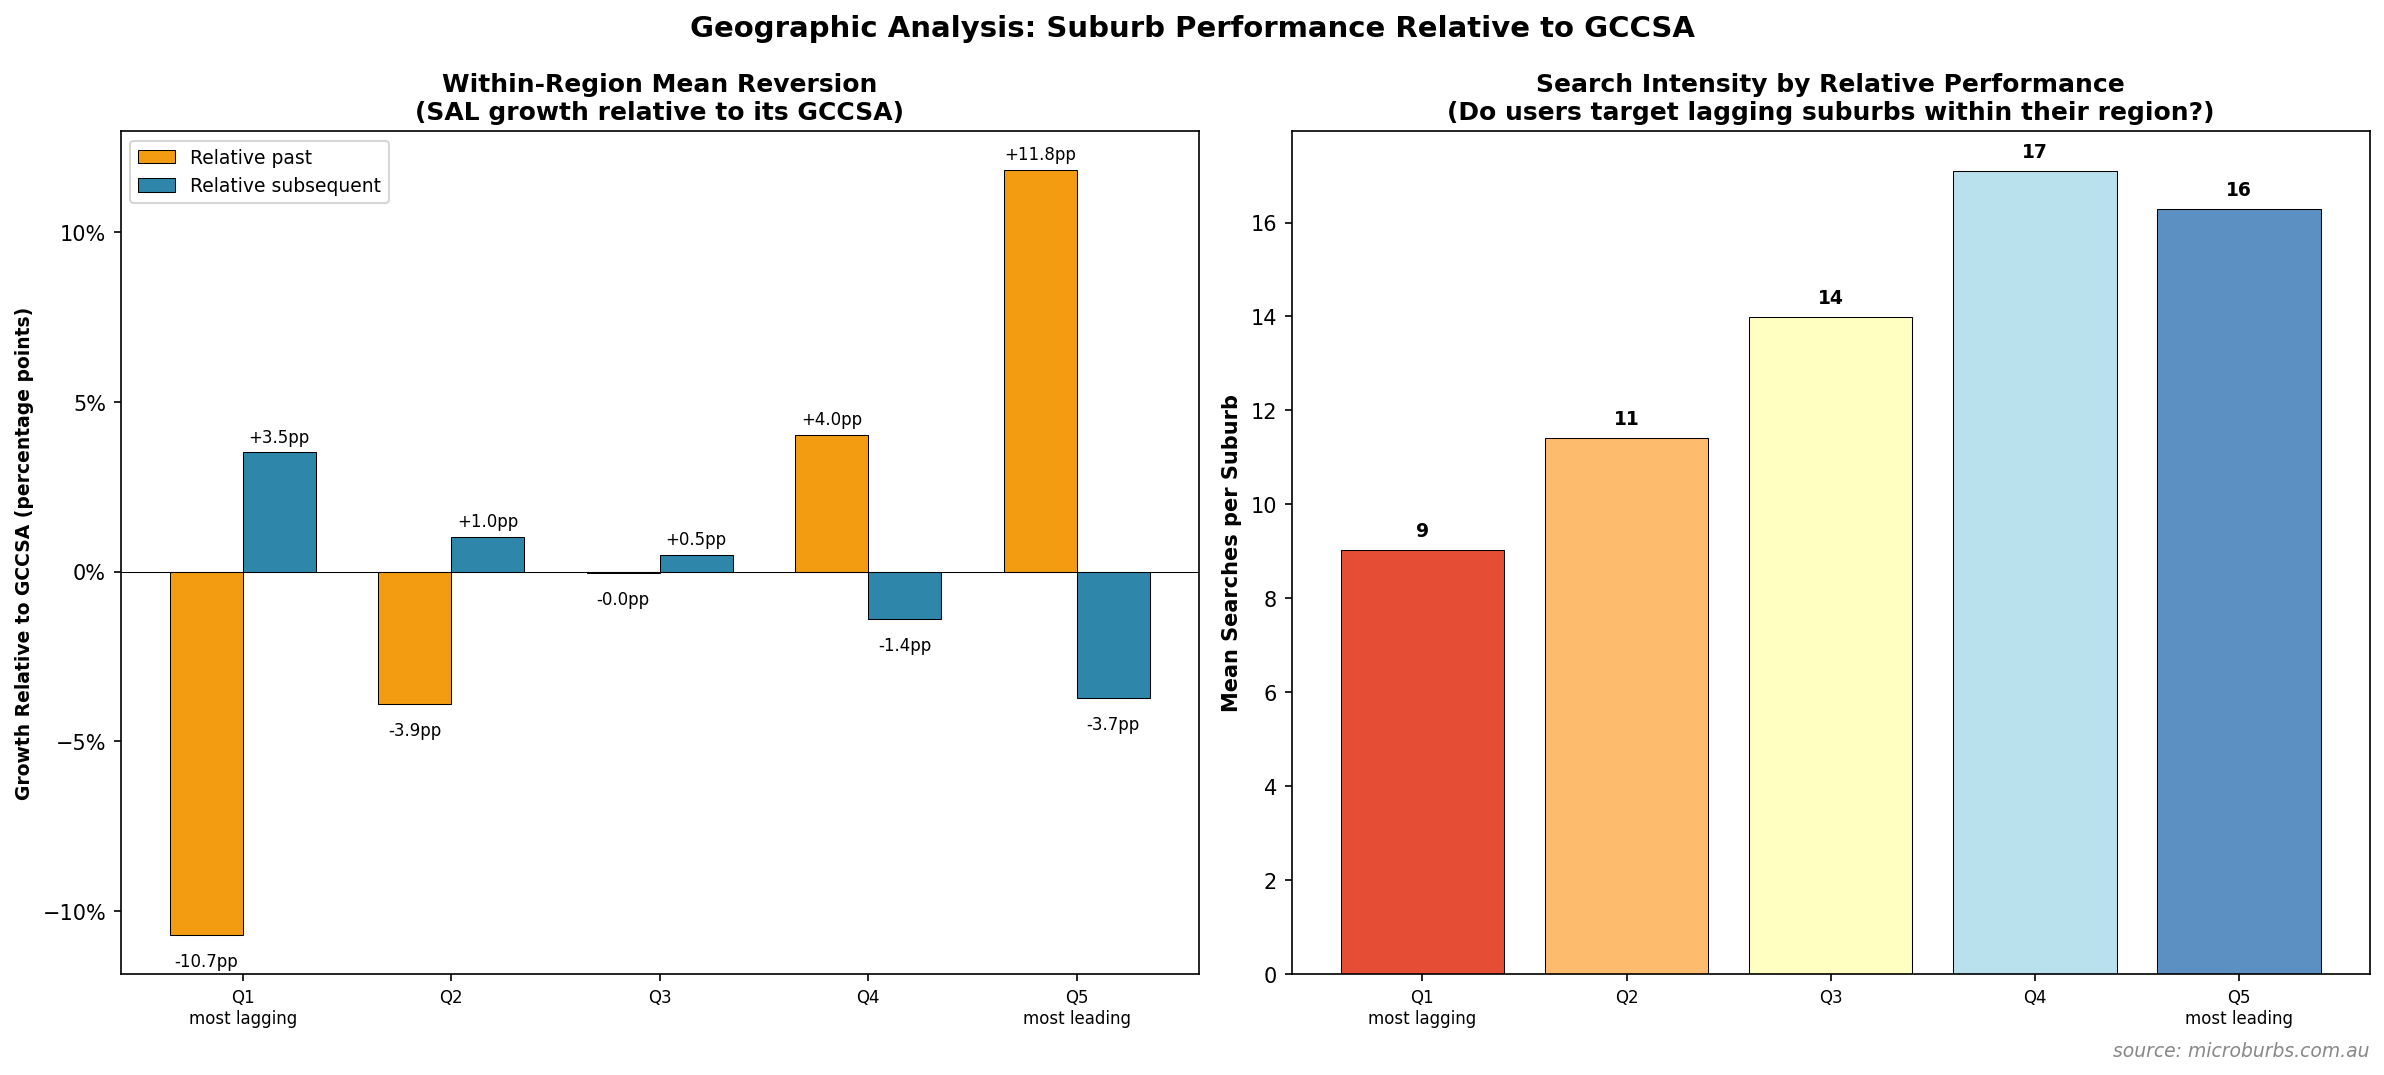
Strong within-region mean reversion
Spearman r = -0.334 (p < 0.001) between relative past and relative subsequent growth. Suburbs that lagged their GCCSA by -10.7pp subsequently outperformed by +3.5pp. Suburbs that led by +11.8pp subsequently underperformed by -3.7pp. This 7.2pp swing is a strong within-region reversion signal.
Users search relative outperformers
Spearman r = +0.111 (p < 0.001) between search intensity and relative past growth. Users tend to search suburbs that have outperformed their region, not lagging ones. This runs counter to a contrarian mean-reversion strategy, though the absolute growth difference is modest.
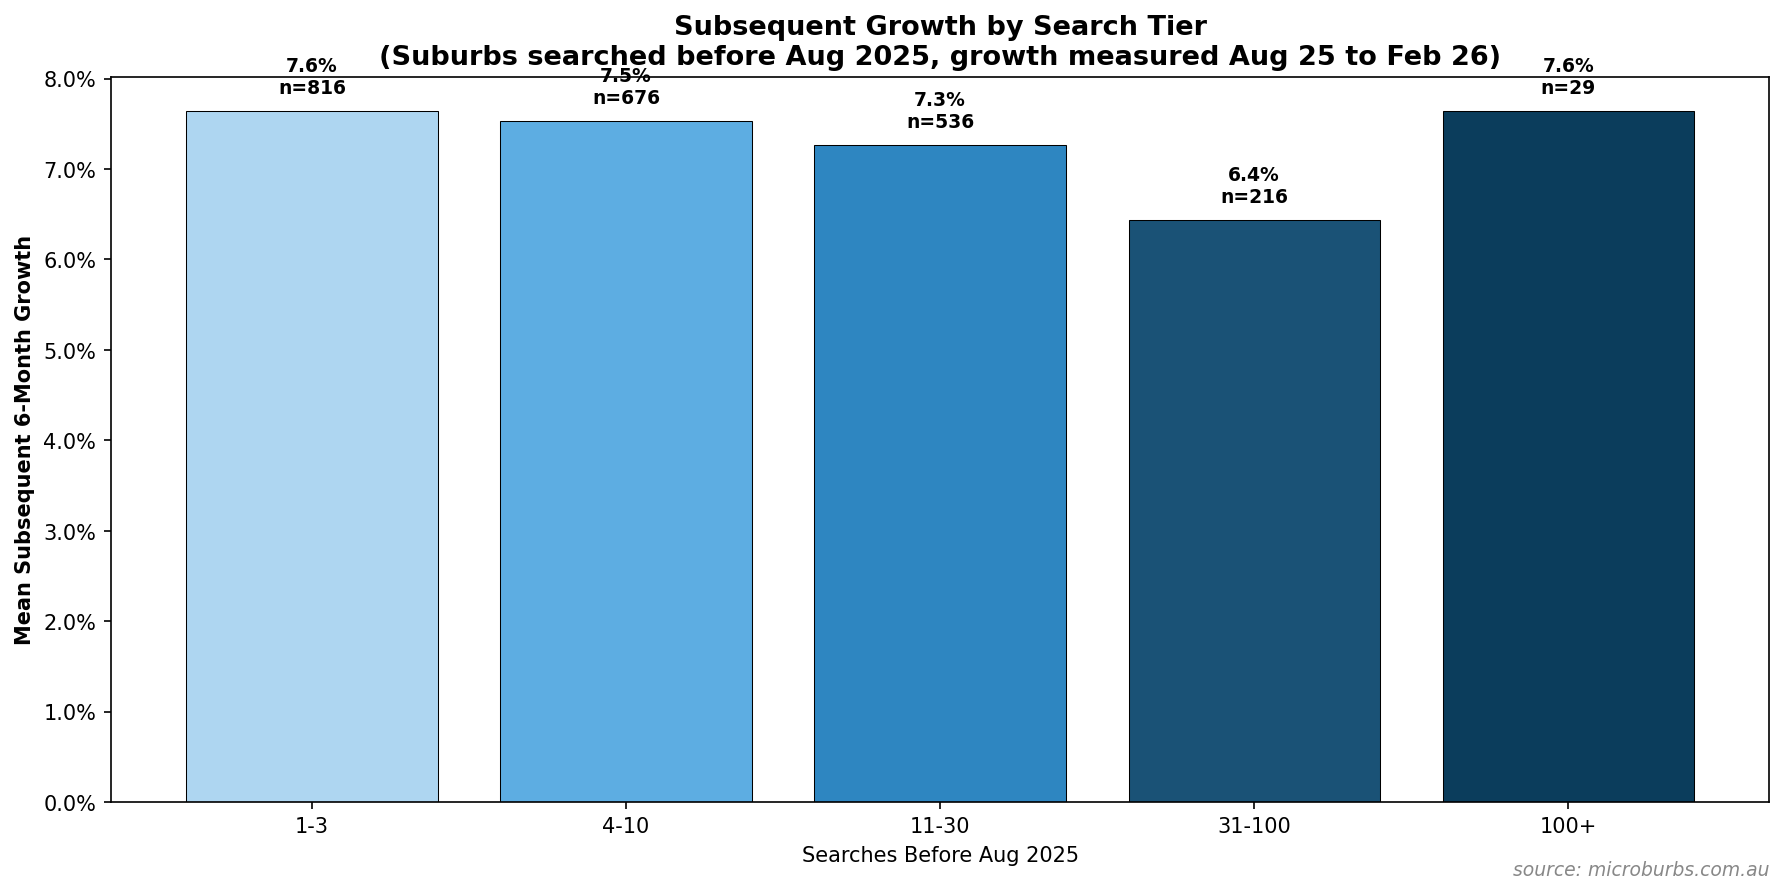
By Search Intensity Tier
Grouping suburbs by how many times they were searched before August 2025, and comparing their subsequent 6-month growth.
| Searches (before Aug 25) | Suburbs | Mean Subsequent Growth | Median Subsequent Growth | Mean Past 1yr |
|---|---|---|---|---|
| 1-3 | 816 | +7.6% | +7.2% | +7.5% |
| 4-10 | 676 | +7.5% | +7.4% | +8.3% |
| 11-30 | 536 | +7.3% | +7.1% | +8.6% |
| 31-100 | 216 | +6.4% | +6.5% | +8.2% |
| 100+ | 29 | +7.6% | +6.1% | +9.8% |
Summary
Key findings
- Short-term mean reversion is real and strong. Suburbs that grew most over the prior 1-6 months grew least in the subsequent 6 months. The 6-month lookback is the strongest predictor (r = -0.309, p < 0.001). D1 suburbs bounced back +11.9% while D10 suburbs managed only +1.8%.
- Long-term momentum also exists. The 3-year lookback shows the opposite pattern (r = +0.171, p < 0.001). Long-term outperformers continue to outperform.
- Within-region reversion is even stronger. Relative to their GCCSA, lagging suburbs catch up by +3.5pp while leaders fall back by -3.7pp (r = -0.334, p < 0.001).
- Users do not chase short-term winners. Search intensity is flat across short-term growth deciles. At the 1yr lookback, users concentrate searches in moderate-growth deciles and avoid top performers.
- Regional bright spots for search prediction. Within Greater Brisbane (r = +0.134, p = 0.038) and Rest of NSW (r = +0.140, p = 0.008), more-searched suburbs did grow more.
- Melbourne concentration skews the overall result. Greater Melbourne attracts 29 searches per suburb on average (more than double any other region) but delivered the weakest subsequent growth (+3.8%).
Limitations
- Short observation period: Only 12 months of search data and 6 months of subsequent growth. Results may not generalise to longer horizons.
- Suburb-level proxy: We match searches to suburbs, not individual buyers. A suburb being searched does not mean the searcher bought there.
- Concurrent confounds: Early searches may partly reflect existing growth trends that continue into the subsequent window.
Research the suburbs that matter to you
Microburbs gives you 900+ data points per suburb. Make your next property decision with the most comprehensive suburb data available in Australia.