Filtering AVM Bargains from Data Errors
A confidence-scoring method for separating genuine property bargains from data quality problems in Automated Valuation Model comparisons. Applied to 9,329 residential properties in Melbourne Outer East.
By Luke Metcalfe · Microburbs Research · February 2026

Executive Summary
Comparing asking prices to AVM valuations produces a list of apparent bargains. But many of those bargains are not real. They are data errors dressed up as discounts.
We built a 12-rule confidence scoring system across three categories: property data quality, AVM reliability, and price plausibility. We applied it to 9,329 residential properties in Melbourne Outer East (SA4). The system assigns each property a penalty score. Zero points means high confidence. Thirty-one or more means reject.
Of 218 extreme deals (15% or more below AVM), 129 passed at HIGH confidence and 46 at MEDIUM. That is 80.3% of extreme deals surviving the filter. The remaining 20 were flagged as likely data errors. Across all deals 5% or more below AVM, 1,321 properties survived as actionable. The average savings on those properties was $100,752.
The goal is not to find every bargain. The goal is to never present a data error as a bargain.
The Problem
AVMs estimate a property's market value using comparable sales, land size, bedroom count, and location. When an asking price sits 20% or 30% below the AVM, it looks like a bargain. Sometimes it is. Sometimes it is not.
The problem is data quality. Property listing data is messy. Bedrooms get recorded as zero or -1000 (a sentinel value meaning 'unknown'). Land sizes go missing. A 4-bedroom house on 600 sqm gets listed with 0 bedrooms and no land size. The AVM, missing two of its most important inputs, produces a guess. That guess happens to be $300,000 higher than the asking price. And now a data error looks like the deal of the decade.
This is not a rare problem. In our Melbourne Outer East dataset, 21.9% of all properties have a missing or invalid land size. Missing bedrooms affect 1.2% of all listings. These numbers are small in the general population but they concentrate heavily in extreme deal lists.
The core question: When a property appears 25% below its AVM valuation, is that a genuine pricing opportunity or is the AVM wrong because its inputs are wrong?
Investors who screen for AVM bargains without filtering for data quality are essentially sorting by 'most likely to have bad data.' That is the opposite of what they want.
The Method: Confidence Scoring
We built a penalty-based confidence score. Every property starts at zero. Each data quality issue adds penalty points. More points means less confidence in the deal. The system is additive. Penalties stack.
This is not a binary pass/fail filter. A property with one minor issue (say, a missing garage count) gets 5 penalty points and stays at MEDIUM confidence. A property with missing bedrooms, missing bathrooms, and missing land size accumulates 65 or more points and gets rejected. The score preserves information that a binary flag system throws away.
Think of it like a credit check. A single late payment does not destroy your score. But three missed payments, a default, and a CCJ will. The system is designed so that one bad data point raises a flag. Multiple bad data points trigger a rejection.
Rule Categories
These rules check whether the property's own attributes are valid. If the AVM's inputs are wrong, its output cannot be trusted.
Category A: Property Data Quality (7 rules)
| Rule | Check | Penalty |
|---|---|---|
| A1 | Missing Bedrooms Sentinel -1000 or 0 | 30 pts |
| A2 | Missing Bathrooms Sentinel -1000 or 0 | 20 pts |
| A3 | Missing Land Size Houses only, not units | 15 pts |
| A4 | Extreme Land Size Over 10,000 sqm | 20 pts |
| A5 | Tiny Land for House Under 100 sqm, not a unit | 15 pts |
| A6 | Extreme Bedrooms More than 8 bedrooms | 15 pts |
| A7 | Missing Garage Garage sentinel -1000 | 5 pts |
Even when property data is clean, the AVM itself might be unreliable. These rules check whether the model had enough information to produce a trustworthy valuation.
Category B: AVM Reliability (3 rules)
| Rule | Check | Penalty |
|---|---|---|
| B1 | Few Comparables Under 10 sales within 2 km in 360 days | <10: 25 pts, <30: 10 pts |
| B2 | High Price Variance CV above 0.5 or above 0.35 | >0.5: 20 pts, >0.35: 10 pts |
| B3 | AVM Outlier Prediction far from regional median | >2x or <0.4x: 15 pts |
These rules look at the asking price itself. A price that is far below everything else in the area warrants extra scrutiny.
Category C: Price Plausibility (2 rules)
| Rule | Check | Penalty |
|---|---|---|
| C1 | Price Far Below Local Under 50% or 65% of local median | <50%: 15 pts, <65%: 5 pts |
| C2 | Compounding Issues 3 or more Category A flags | 3+ A-flags: 20 pts |
Confidence Levels
The penalty score maps to four confidence levels. These are the labels investors see when browsing filtered results.
| Level | Points | Meaning |
|---|---|---|
| HIGH | 0 points | No issues detected. All property data present and valid. |
| MEDIUM | 1 to 15 points | Minor concern. One or two small data gaps. |
| LOW | 16 to 30 points | Multiple concerns. The discount may not be real. |
| REJECT | 31+ points | Likely data error. AVM valuation is unreliable. |
Why the cutoffs are where they are. A single missing bedroom (30 points) puts a property at LOW. Add a missing bathroom (20 more points) and it hits REJECT at 50 points. This is deliberate. If the AVM does not know the bedrooms or bathrooms, its valuation is a guess. Presenting a guess as a bargain is worse than missing a real deal.
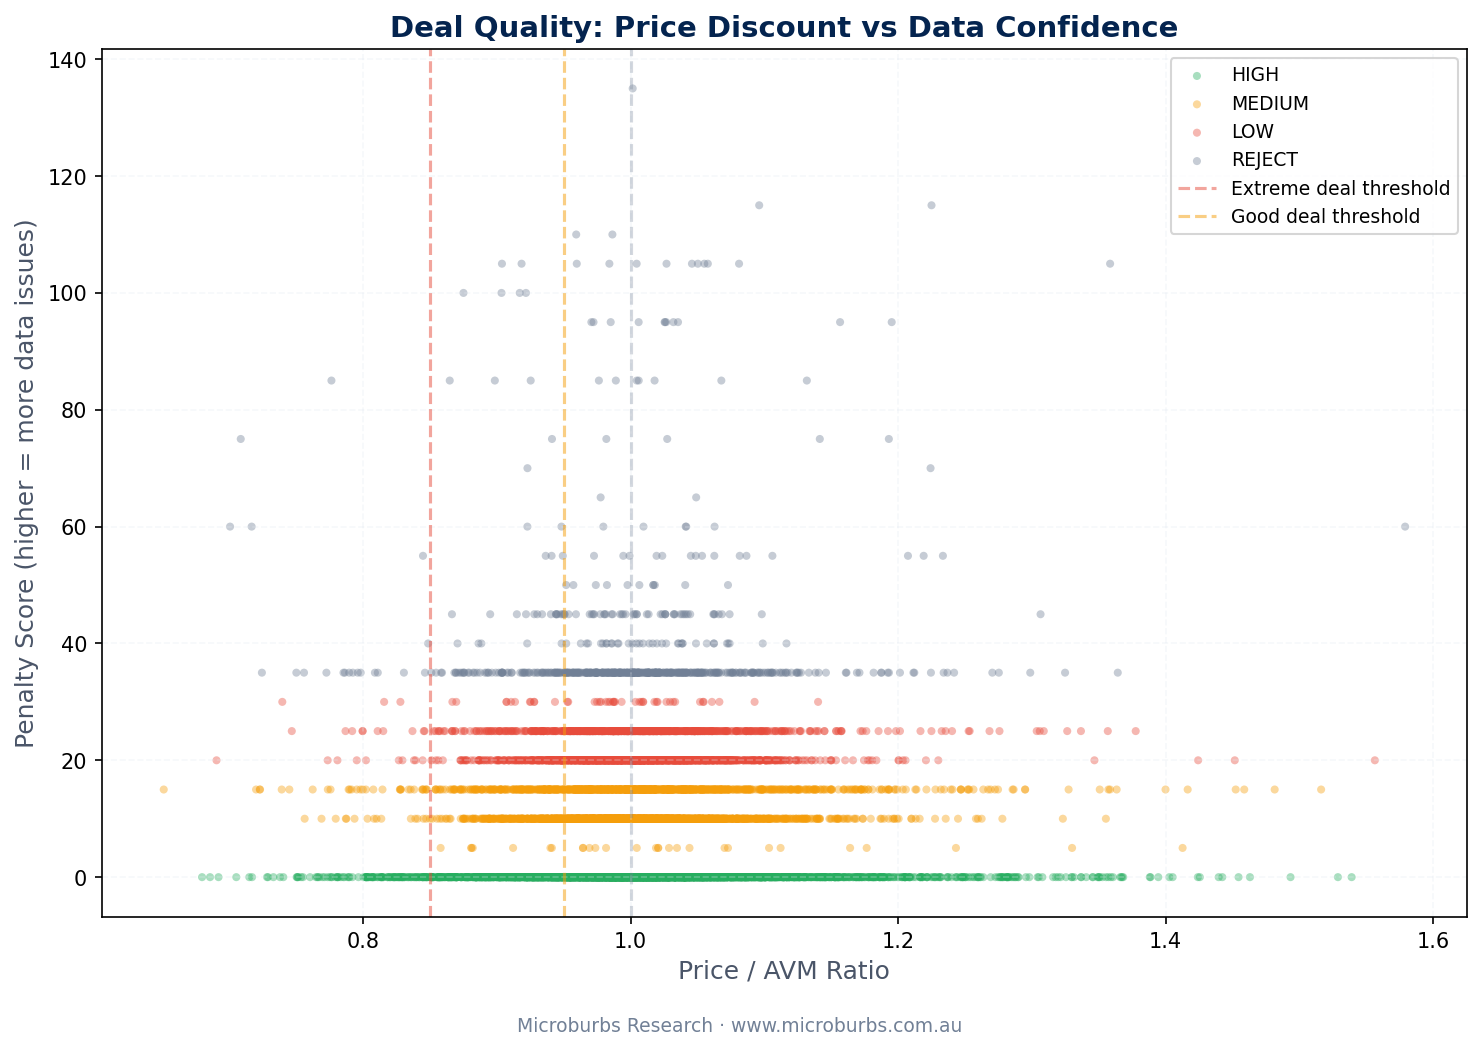
Properties with 5% or more discount distribute across confidence levels. Most pass at HIGH or MEDIUM.
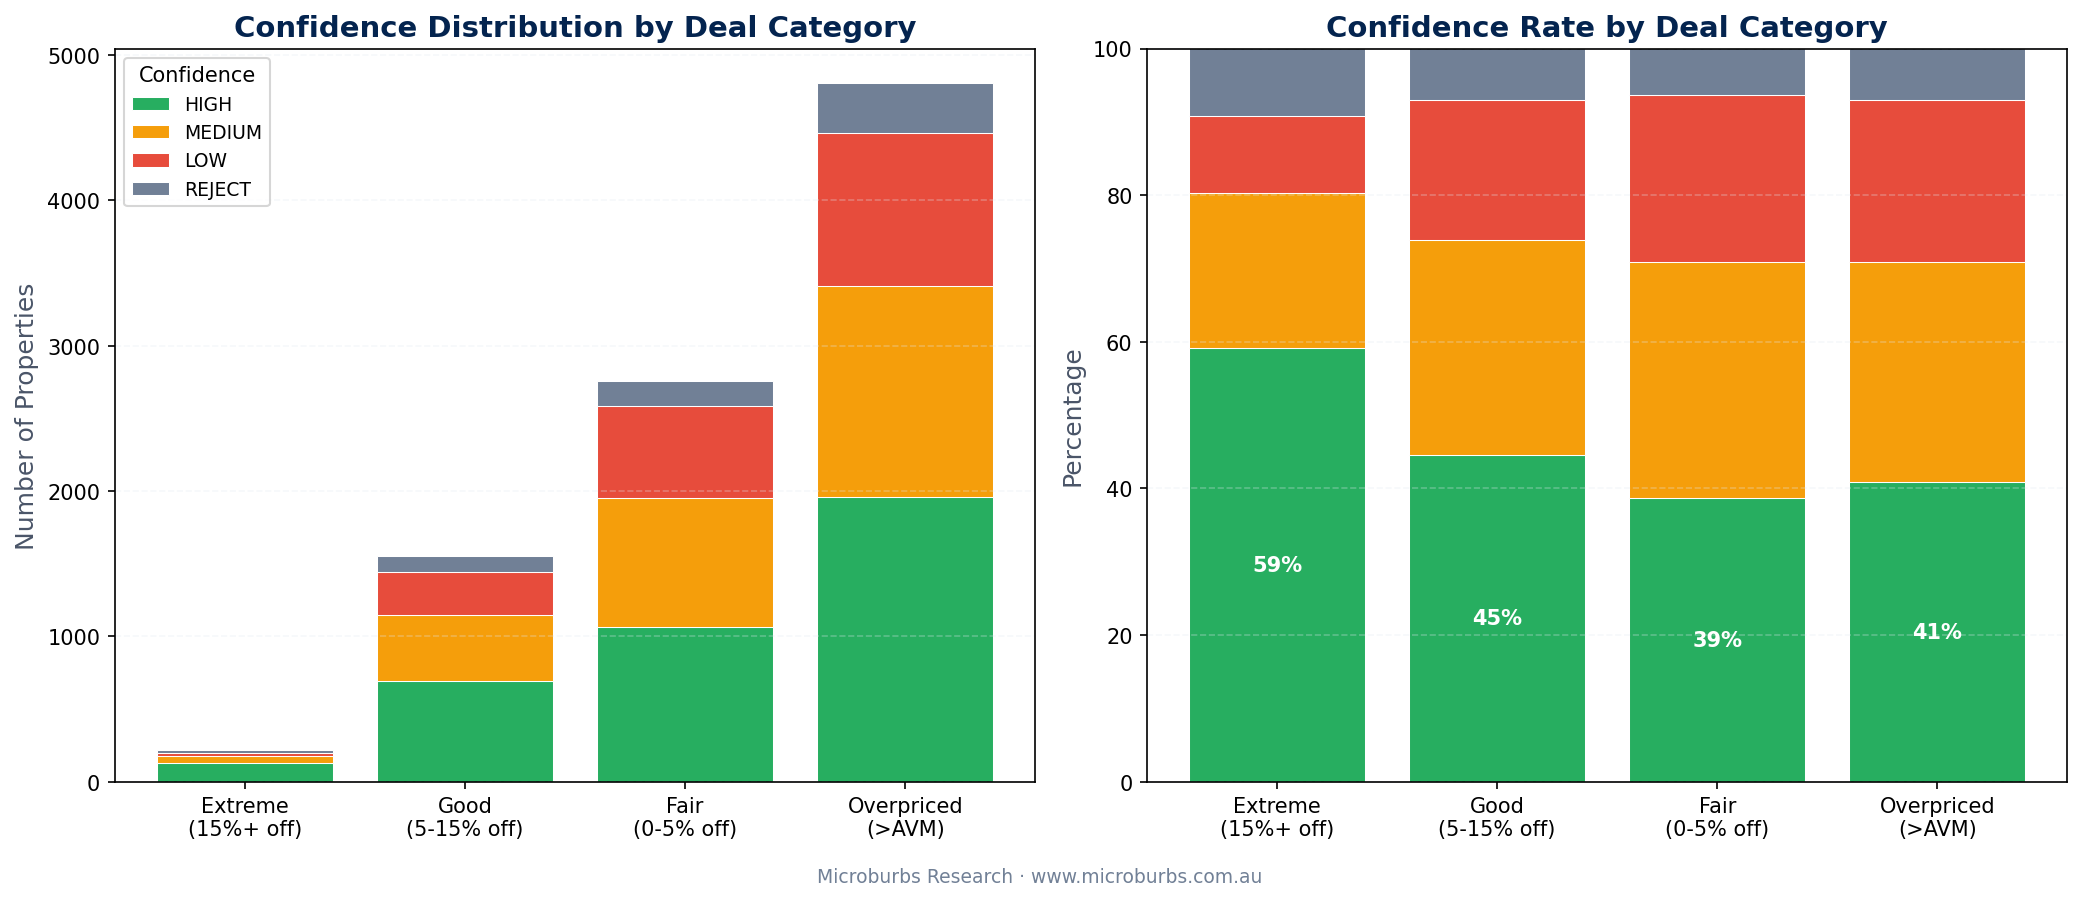
Confidence distribution by deal category, Melbourne Outer East. Source: Microburbs Research, February 2026.
Results
We applied the confidence scoring system to 9,329 residential properties in Melbourne Outer East (SA4 region). Every property had both an asking price and an AVM valuation.
Extreme deals (15% or more below AVM)
218 properties sat 15% or more below their AVM valuation. Here is how they scored.
80.3% of extreme deals survived the filter at HIGH or MEDIUM confidence. That means the majority of 15%+ discounts are genuine pricing opportunities, not data errors. But 9.2% were rejected outright. Without the filter, those 20 properties would have appeared alongside the genuine deals.
Good deals (5% to 15% below AVM)
1,551 properties sat between 5% and 15% below their AVM.
| Confidence | Count | Percentage |
|---|---|---|
| HIGH | 692 | 44.6% |
| MEDIUM | 454 | 29.3% |
| LOW | 297 | 19.1% |
| REJECT | 108 | 7% |
The rejection rate drops from 9.2% for extreme deals to 7.0% for moderate deals. This makes sense. The bigger the apparent discount, the more likely it is driven by bad data rather than genuine pricing.
Actionable output
Combining both categories, 1,321 properties passed at HIGH or MEDIUM confidence with 5% or more discount. These are the actionable deals. The average savings across these properties was $100,752.
The distribution of discounts shows a clear concentration between 5% and 15%, with a long tail of extreme discounts that need careful filtering.
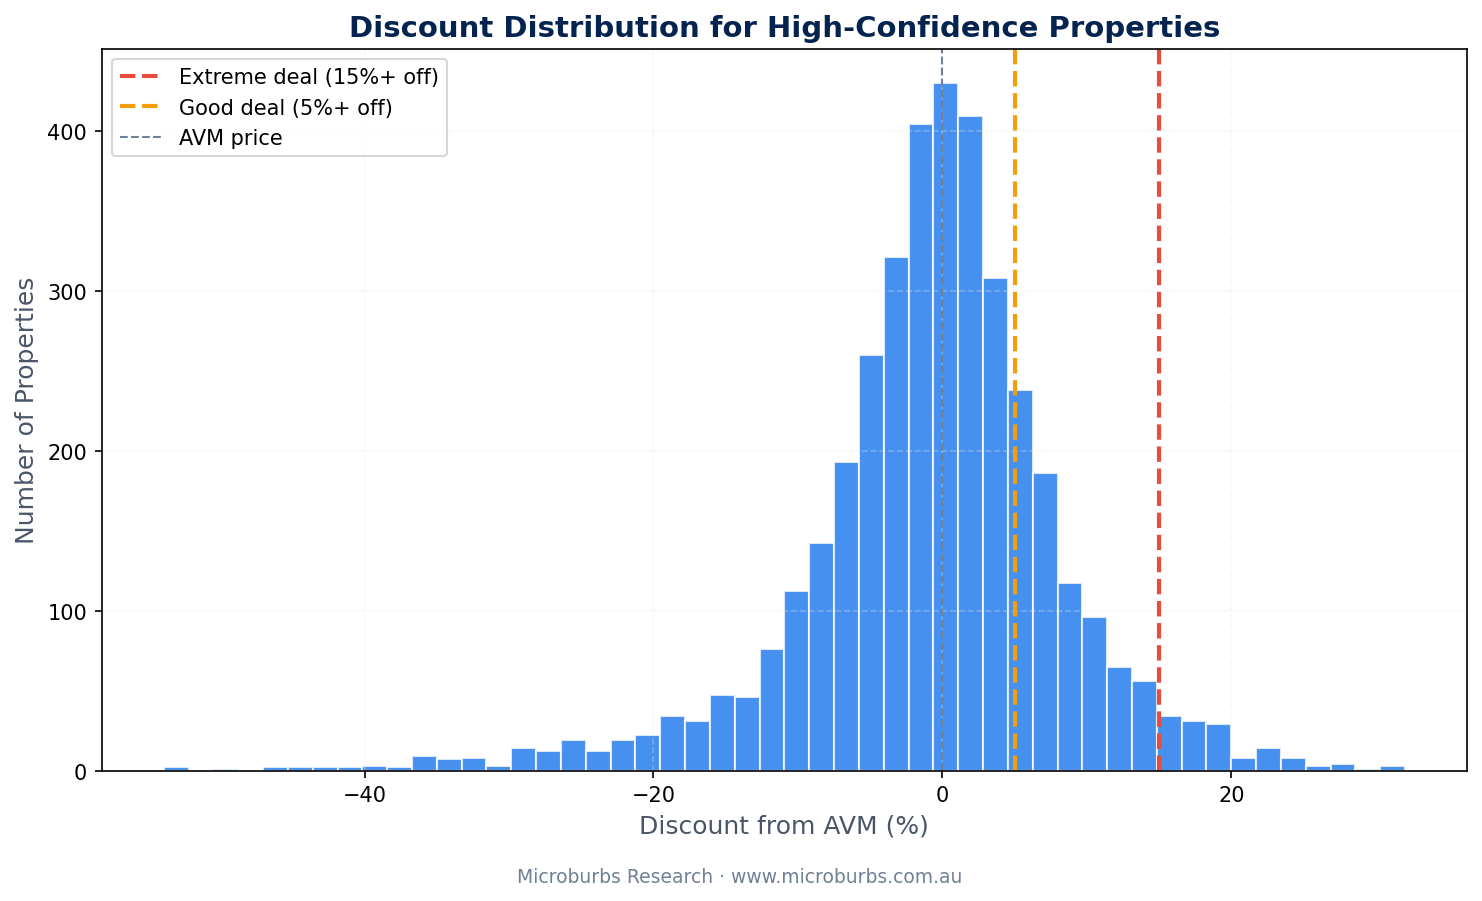
Discount distribution across all properties, Melbourne Outer East. Source: Microburbs Research, February 2026.
Most common flags
Missing land size is the most common data issue overall, but missing bedrooms drives the most rejections in extreme deals.
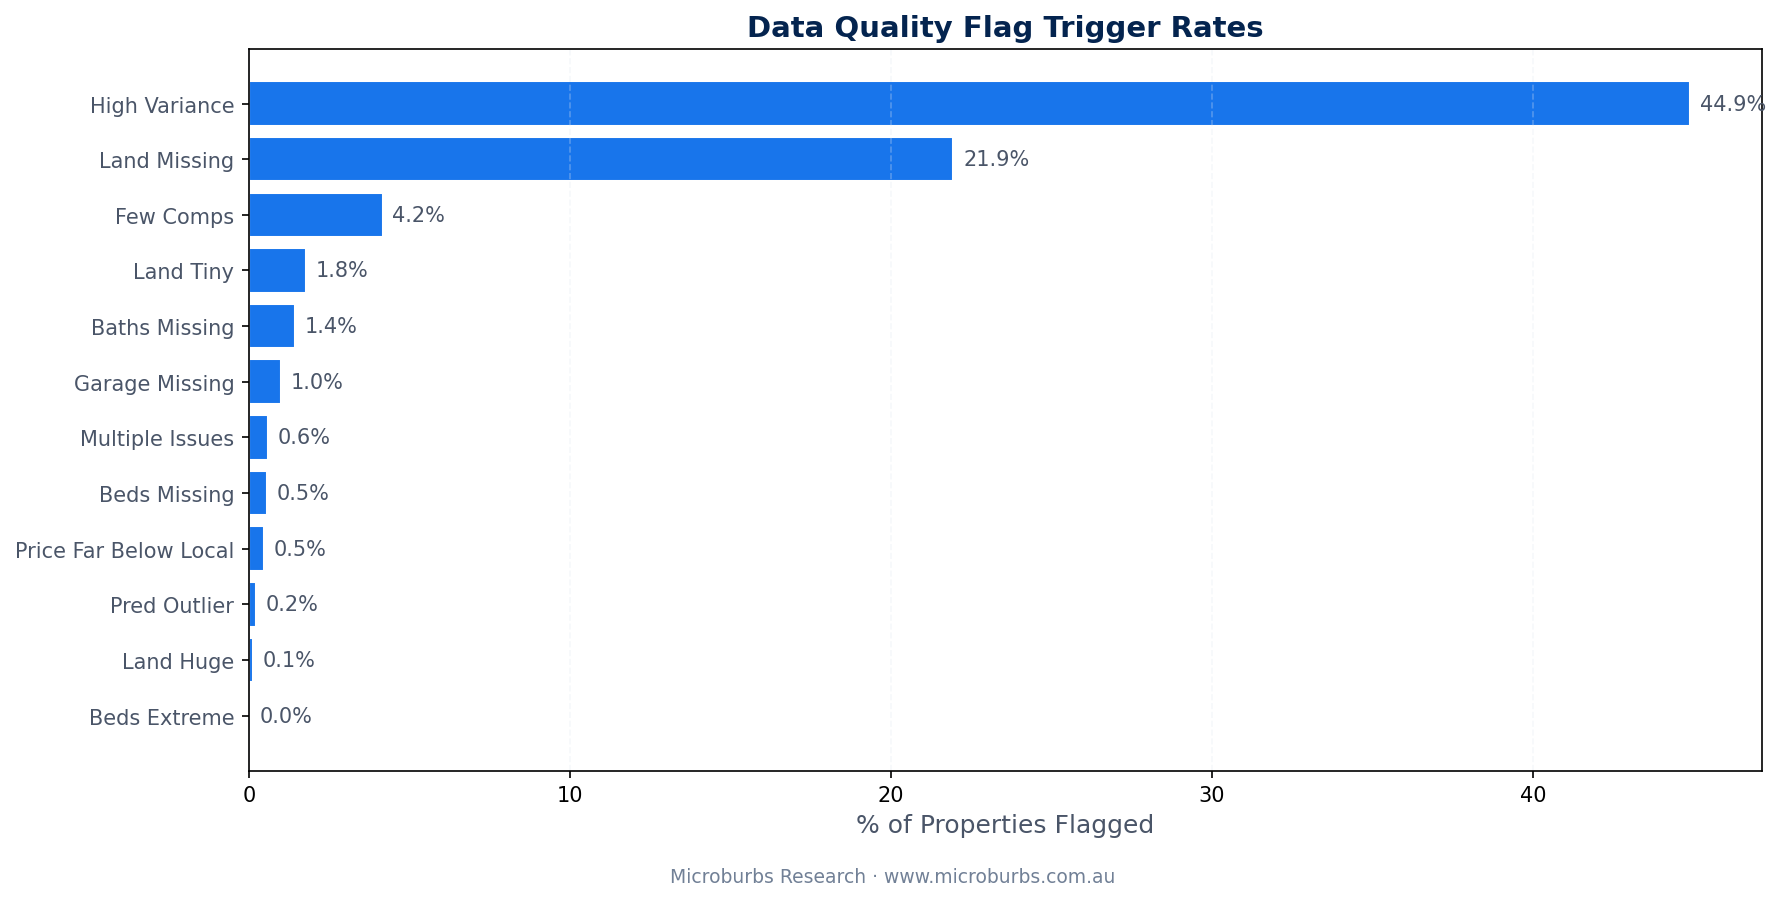
Flag trigger rates by rule, general population vs extreme deals. Source: Microburbs Research, February 2026.
Missing land size affects 21.9% of all properties. But only 3.2% of extreme deals have zero land size. The flag that matters most for extreme deals is missing bedrooms. It affects 1.2% of the general population but 6.4% of extreme deals. That 5x concentration ratio is why the bedroom penalty (30 points) is the highest single-rule penalty in the system.
Concrete Examples
Three properties from the dataset show how the confidence score works in practice.
571 Burwood Hwy, Vermont South
HIGHAll property attributes present. Good local comparable count. The AVM had clean inputs and still produced a valuation $504,659 above the asking price. This is a genuine bargain candidate. Penalty score: 0 points.
5 Kirkwood Ct, Montrose
REJECTThe 35% discount looks attractive. But the land size is recorded as -1000, a sentinel value meaning 'unknown.' In the Montrose area, land size is a primary driver of property value. The AVM cannot produce a reliable valuation without it.
14 Queens Rd, Silvan
REJECTAll key inputs are missing. Bedrooms: -1000. Bathrooms: -1000. The AVM is working with almost no property-specific information. Its $735,806 valuation is essentially a guess based on location alone. Penalty score: 70+ points.
The pattern is clear. Vermont South has clean data and a genuine discount. Montrose is missing one critical input. Silvan is missing nearly everything. The confidence score correctly separates all three.
Top Suburbs for High-Confidence Bargains
Where do the actionable deals concentrate? These suburbs produced the most HIGH or MEDIUM confidence deals with 5% or more discount below AVM.
| Rank | Suburb | Deals |
|---|---|---|
| 1 | Rowville | 41 |
| 2 | Croydon | 39 |
| 3 | Lilydale | 31 |
| 4 | Mooroolbark | 30 |
| 5 | Ferntree Gully | 29 |
| 6 | Bayswater | 27 |
| 7 | Boronia | 25 |
| 8 | Nunawading | 24 |
| 9 | Wantirna | 22 |
| 10 | Mitcham | 22 |
Rowville leads with 41 actionable deals. These are established middle-ring suburbs with high transaction volumes. More comparable sales means the AVM has better calibration data. And better calibration means the discounts are more likely to reflect genuine pricing rather than model error.
Rowville and Croydon dominate the actionable deal count. These suburbs combine high listing volume with strong AVM reliability.
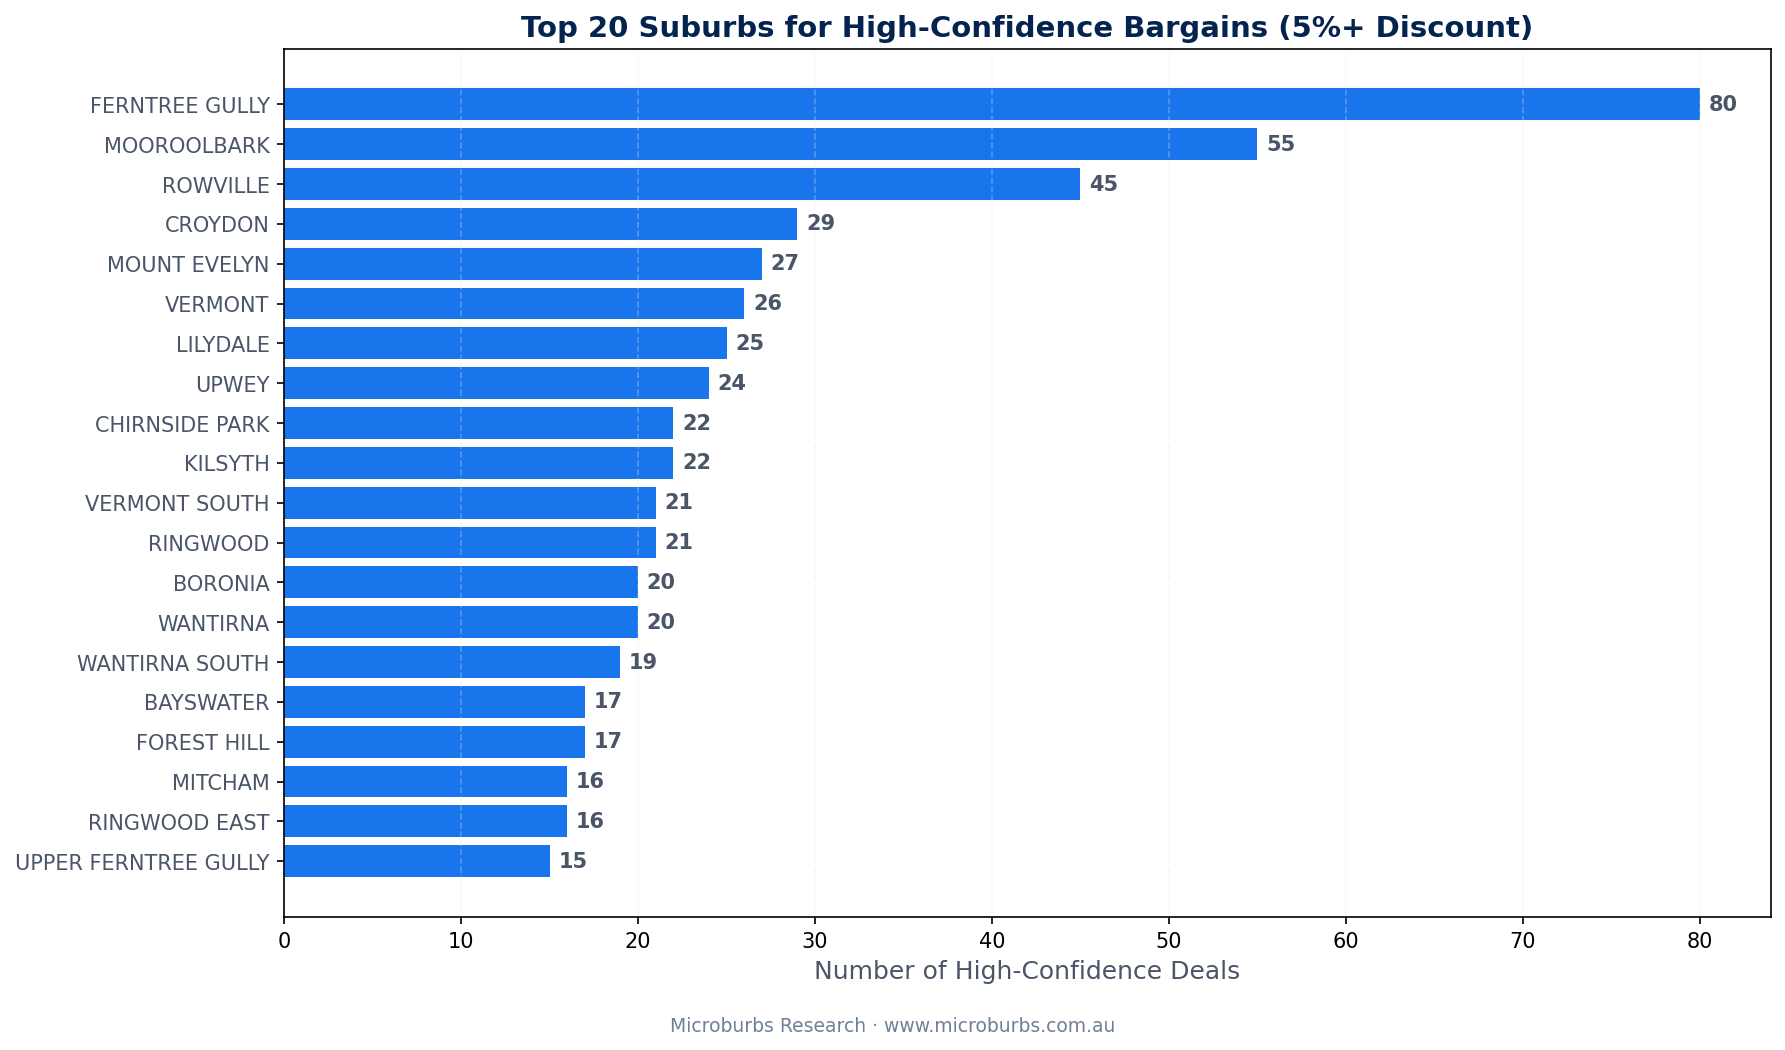
Top 10 suburbs by actionable deal count. Source: Microburbs Research, February 2026.
Why Conservative Scoring
The scoring system is deliberately conservative. A single missing field can push a property from HIGH to LOW. Multiple missing fields trigger REJECT. Some genuine bargains will be caught in that net. We accept that trade-off.
False positives vs false negatives
There are two kinds of errors the system can make. A false positive flags a genuine bargain as suspect. A false negative presents a data error as a bargain. The costs of these errors are not equal.
A false positive means an investor does extra research on a property that turns out to be fine. That costs time. A false negative means an investor buys a property based on a valuation that was wrong. That costs money. Potentially hundreds of thousands of dollars.
Missing a good deal costs you nothing. Acting on a bad one costs you everything.
How penalty weights were calibrated
The penalty weights are not arbitrary. We calibrated them by comparing flag rates between extreme deals (15%+ below AVM) and the general population.
Missing bedrooms appear in 6.4% of extreme deals but only 1.2% of all properties. That 5.3x concentration ratio tells us that missing bedrooms are strongly associated with apparent bargains that are actually data errors. So the penalty is high: 30 points.
Missing garage data appears at roughly equal rates in extreme deals and the general population. It does not predict data-error bargains. So the penalty is low: 5 points.
Flags that concentrate in extreme deals get higher penalties. Flags that appear uniformly get lower ones.
Concentration ratio vs penalty weight for each scoring rule. Source: Microburbs Research, February 2026.
Why additive, not binary
A binary flag system would mark a property as 'good' or 'bad.' That throws away information. A property with a missing garage count and a property with missing bedrooms, bathrooms, and land size would both be 'bad.' But they are very different kinds of bad.
The additive scoring system preserves that distinction. A MEDIUM deal with 5 points (missing garage) is a minor data gap that probably does not affect the valuation. A REJECT with 70 points (missing beds, baths, and land) is a property where the AVM had almost nothing to work with.
Investors can set their own threshold. Conservative investors filter for HIGH only. Opportunistic investors include MEDIUM. Nobody should be looking at REJECT.
Limitations
What we do not know yet
- No outcome validation. We do not yet know which HIGH-confidence bargains actually sold below AVM. Tracking sale prices against asking prices and AVM valuations would provide ground truth for the confidence thresholds.
- Single region. This analysis covers Melbourne Outer East only. Flag rates and concentration ratios may differ in other SA4 regions.
- Static weights. The penalty weights were calibrated once against this dataset. They are not dynamically adjusted as data quality changes over time.
- AVM model opacity. We treat the AVM as a black box. We know its inputs but not its internal weighting.
Known gaps in the scoring system
- No renovation or condition check. A property asking 30% below AVM might be in poor condition. The scoring system does not capture this because condition data is not available in listing feeds.
- No deceased estate or distressed sale flag. Some genuine bargains are priced low because the seller needs a quick sale. The system has no way to distinguish them.
- Zoning and development upside. Properties with development potential may have AVM valuations based on comparable residential sales, while the asking price reflects the development premium.
What we would need to strengthen these findings
Outcome data from settled sales would allow us to measure the actual false positive and false negative rates. Cross-regional analysis across 5 or more SA4 regions would test whether the penalty weights generalise. And integrating condition or motivation data from listing descriptions would address the biggest blind spot in the current system.
Method Appendix
Data source
9,329 residential properties in Melbourne Outer East (SA4 region), sourced from listing feeds with AVM valuations attached. All properties had both an asking price and an AVM valuation at time of extraction.
AVM description
The AVM uses comparable sales within a defined radius, adjusted for property attributes (bedrooms, bathrooms, land size, property type) and time decay. The specific model architecture and weighting are proprietary.
Confidence score calculation
Each property starts at 0 penalty points. The 12 rules in Categories A, B, and C are evaluated in order. Penalties are additive. The final score maps to a confidence level: HIGH (0), MEDIUM (1-15), LOW (16-30), REJECT (31+).
Deal classification
Properties are classified by discount percentage: (AVM - asking price) / AVM. Extreme deals are 15% or more below AVM. Good deals are 5% to 15% below. Actionable deals are those at HIGH or MEDIUM confidence with 5% or more discount.
Sentinel values
A value of -1000 in any property attribute field indicates missing data. Zero bedrooms is treated identically to -1000 bedrooms, as no residential property has zero bedrooms.
Concentration ratio
For each rule, the ratio of its trigger rate in extreme deals to its trigger rate in the general population. A ratio above 2.0 indicates the flag is disproportionately associated with apparent bargains and therefore likely associated with data errors.
Coefficient of variation (CV)
Standard deviation of sale prices within the 2 km / 360 day window, divided by the mean sale price. A CV above 0.35 indicates moderate price dispersion. A CV above 0.5 indicates high dispersion.
Stop sorting by 'most likely to have bad data.'
Microburbs analyses 89 street-level factors across every pocket in Australia. Find the deals that are real.