A house is worth what you can negotiate, and no algorithm settles that. So instead of one figure, Microburbs gives you what each part of the house is worth, with the real sales behind every figure, ready to put in front of an agent.
 By Luke Metcalfe, Founder, Microburbs Research
The same swimming pool adds about $20,000 around Melton in Melbourne's west, and about $80,000 around Rouse Hill in Sydney's north west. Four times the money for the same pool.
It moves suburb by suburb too: about $42,500 in Narangba and about $61,000 in North Lakes, both on Brisbane's northern fringe, and about $48,000 in southern Baldivis, south of Perth. It even moves street by street, because a pool is worth what buyers near that street have actually paid for one. So the figures below start as national averages, and a report on your house measures every one of them against the homes around yours.
Tap any one to see the evidence behind it
Creswick, VIC. This is the same home before and after a renovation, with the local 7% rise removed. It sold for $64,000 more than that local rise. This is one example, not proof that no other detail changed.
This is one example. The figure itself comes from about 11,000 homes across the country that sold twice, before and after a renovation, not just this one.
Same suburb (Baldivis, WA), both 4 bedrooms and 2 bathrooms, sold 162 days apart. The difference is $32,000.
This is one example. The figure itself comes from about 36,000 matched pairs of near-identical homes across the country, not just the two above.
Same suburb (Aberglasslyn, NSW). These two are matched on the other recorded details we hold: where a bigger house usually also has more land or another bathroom, those are held still.
This is one example. The figure itself comes from about 4,400 matched pairs nationally, with the other recorded details held still, not just the two above.
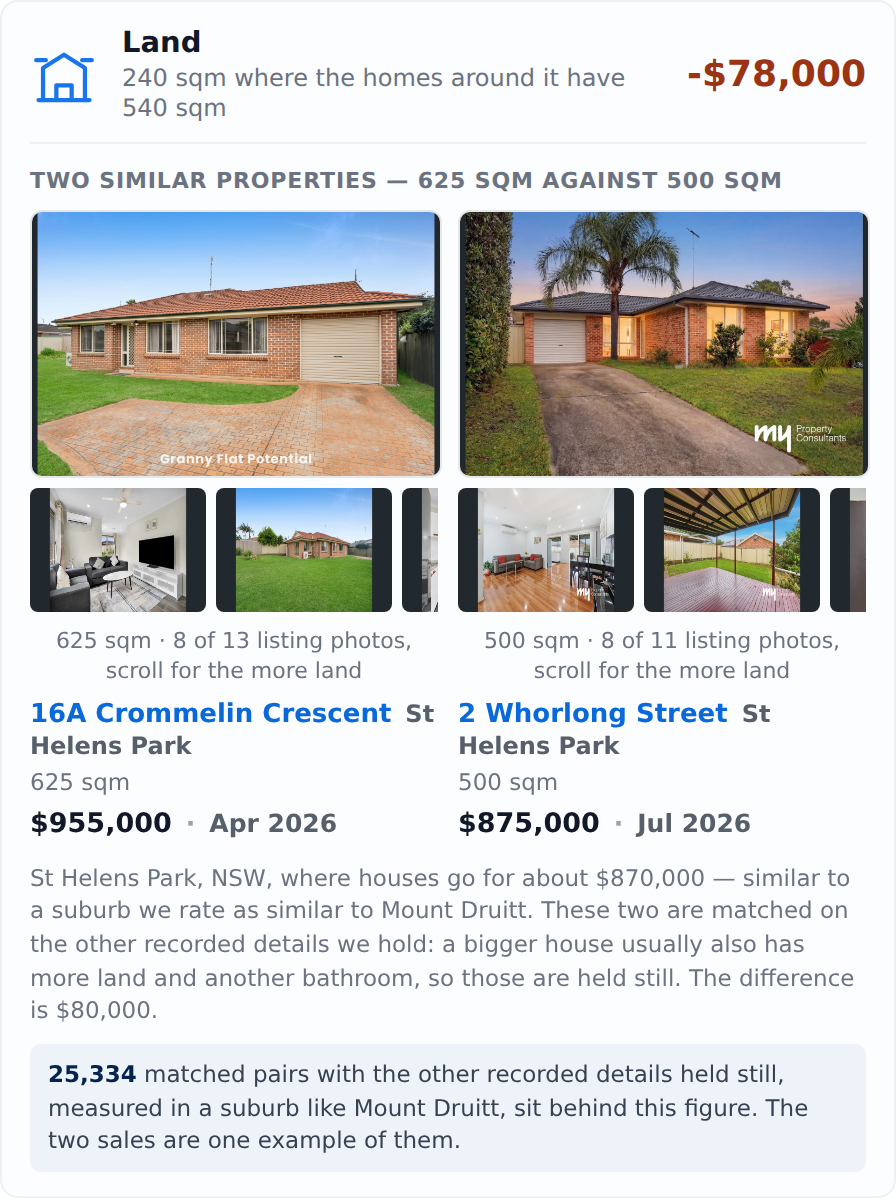
Same suburb (Windradyne, NSW). These two are matched on the other recorded details we hold: where a bigger house usually also has more land or another bathroom, those are held still.
This is one example. The figure itself comes from about 3,900 matched pairs nationally, with the other recorded details held still, not just the two above.
Same suburb (Glen Waverley, VIC). These two are matched on the other recorded details we hold: where a bigger house usually also has more land or another bathroom, those are held still.
This is one example. The figure itself comes from about 24,000 matched pairs nationally, with the other recorded details held still, not just the two above.
Same suburb (Yarrabilba, QLD), both 3 bedrooms and 2 bathrooms, sold 120 days apart. The difference is $29,000.
This is one example. The figure itself comes from about 75,000 matched pairs of near-identical homes across the country, not just the two above.
Across about 74,000 matched pairs the gap came to about $1,000 on a typical home, inside what chance alone produces at that size. 3 areas in the country showed a figure we would stand behind.
Across about 95,000 matched pairs the gap came to about $1,000 on a typical home, inside what chance alone produces at that size. 3 areas in the country showed a figure we would stand behind.
See a real house taken apart → · the full research paper →
Standing at an open home, the one thing you cannot check is whether the asking price is fair. The guide price came from the agent. The estimate on the portal came from a company that sells advertising to that agent. Neither tells you what you are actually paying for.
So we took the question apart. Not "what is this house worth", which is a single number you either believe or you do not. Instead: what is each part of it worth, and what are the real sales that show it.
Ask any portal what a house is worth and you get a single figure. There is nothing you can do with it. You cannot check it, you cannot argue with it, and you certainly cannot put it in front of an agent, because it does not say what it is made of.
What it misses is where your house actually differs from the homes around it, and what each of those differences is worth. Here is a real house in Brisbane that sold in February 2026.
Every figure in that list was measured on comparable sales in that part of the country, because a pool on the Sunshine Coast is worth several times a pool in the western suburbs of Melbourne.
Deep dive: how far these figures can be relied on →
These are what each thing is worth on an ordinary Australian home, in every state. Every figure comes from putting near-identical homes side by side, about 620,000 of them, and reading what the market actually paid for the difference.
| What changes | What it is worth | On a typical home |
|---|---|---|
| A swimming pool | 3.2% of the price | about $27,000 |
| A whole-home renovation | 7.9% of the price | about $67,000 |
| One more bedroom | 2.3% | about $19,000 |
| One more bathroom | 2.1% | about $18,000 |
| One more garage space | 1.4% | about $12,000 |
| Open plan living | nothing | nothing |
| Air conditioning | nothing | nothing |
Deep dive: every figure and how firm it is →
A price is not set by a portal or by the agent. It is settled between you and the person selling, and how long they have already been waiting changes what they will accept. So the useful question is not how fast homes sell. It is who is still standing there when you walk in.
What you need at that point is not a feeling that the place is dear. It is a number, and the two sales that show it.
To illustrate, three real sales you can look up yourself. They are three examples from about 620,000 Australian homes we compared to arrive at the figures above, not the basis for them.
Same street, both four bedrooms and two bathrooms, five months apart in 2025.
Same street, both two bedrooms and one bathroom, sold on the same day in 2026.
Next door to each other, both three bedrooms and two bathrooms, nine weeks apart in 2025.
Deep dive: more worked examples →
None of this is one national number, and it would be misleading if it were. A whole-home renovation returns about $185,000 in Sydney - Parramatta and about $24,000 in Adelaide - North. That is more than seven times the difference for the same work.
A pool is worth about $62,000 on the Sunshine Coast and about $10,000 in Melbourne - West. Climate, block sizes and how many neighbours already have one all pull the same way.
So we did the work region by region rather than once for the country: a renovation figure for 49 regions, a pool figure for 27 regions, and solar for 12. Where a region cannot answer on its own sales we say so and give you the wider figure, rather than dressing up a national average as a local one.
Deep dive: the region by region tables →
A suburb median treats the best street and the worst street as the same place. Every buyer already knows they are not, and yet almost every price you are quoted is built on the suburb. We price the street the house is actually on.
Deep dive: why the suburb median misleads →
It turns a feeling into a list you can put in front of an agent. If a house is confirmed to have a pool, you can name the two matched sales behind the local figure. If the ad makes much of open plan living, that is worth nothing measurable, and now you know. Silence in an ad is never treated as proof that a feature is absent.
For buyers agents this is the part of the job clients already pay for. One agent we spoke to charges a flat $1,000 to $2,000 to negotiate alone, without the rest of the buying service. Another told us his average saving on a deal under a million dollars is $50,000.
Deep dive: what to do with it →
This is a year of work, done across every state, and checked the hard way rather than the flattering one. About 620,000 homes compared, and the answers tested on sales they had never seen.
Two questions decide whether any of this is worth trusting, and both are answered in the paper. Does it hold up over time? A pool comes out at 3.1% of the price in 2025 and 3.4% in 2026, measured separately on each year's own sales, and the full list of parts beat the suburb figure in every half-year we tested. Does it hold up everywhere? It beat the suburb figure in 5 of 6 states and 27 of 33 regions. It lost in South Australia, and the paper says so and explains why.
Those tests were run where our readers actually buy, on homes between $400,000 and $800,000, in suburbs where the houses are alike enough that comparing them means anything. The paper gives the figures without either of those limits as well, so you can see what the restriction is worth.
It is not a crystal ball and we do not pretend otherwise. It is a much better starting point than a number with nothing behind it.
Deep dive: the proof over time and geography → · what it does not do →
Pull the report for the property you are considering and the suburb around it. What is moving the price is in there, address by address.
