How a weekly suburb median shows a market turning through the month, before the month-end figure is available.
 By Luke Metcalfe · Founder, Microburbs Research
Current data status: the most recent weekly price is dated 26 July 2026, because the listing feed has stopped advancing. The March examples below show how the weekly view works. Check the date in a suburb report before acting on it.
Most property price series are compiled from settled sales and released on a monthly cadence, after the reference month has ended. There is a further delay while sales settle and are recorded. The practical result for a buyer is that a suburb which turns upward is reported after the move is already underway. By the time the figure is public, competing buyers have seen the same number, and the early advantage has passed.
A weekly measure changes the cadence. Rather than one figure per month, the reader sees the middle price re-struck each week, so an acceleration is visible as it accumulates rather than after it completes.
In a March 2026 worked example, the Halls Head market in Mandurah, Western Australia rose in nine of the last twelve weekly readings. The weekly middle price moved from $974,000 to $1,100,000. The most recent fully completed month a monthly source could report stood at $1,010,000, about 9% below the current weekly figure, and the reading for the final month would not be published until the following month. A weekly reader was therefore several weeks and about 9% ahead of a monthly reader on the same suburb.
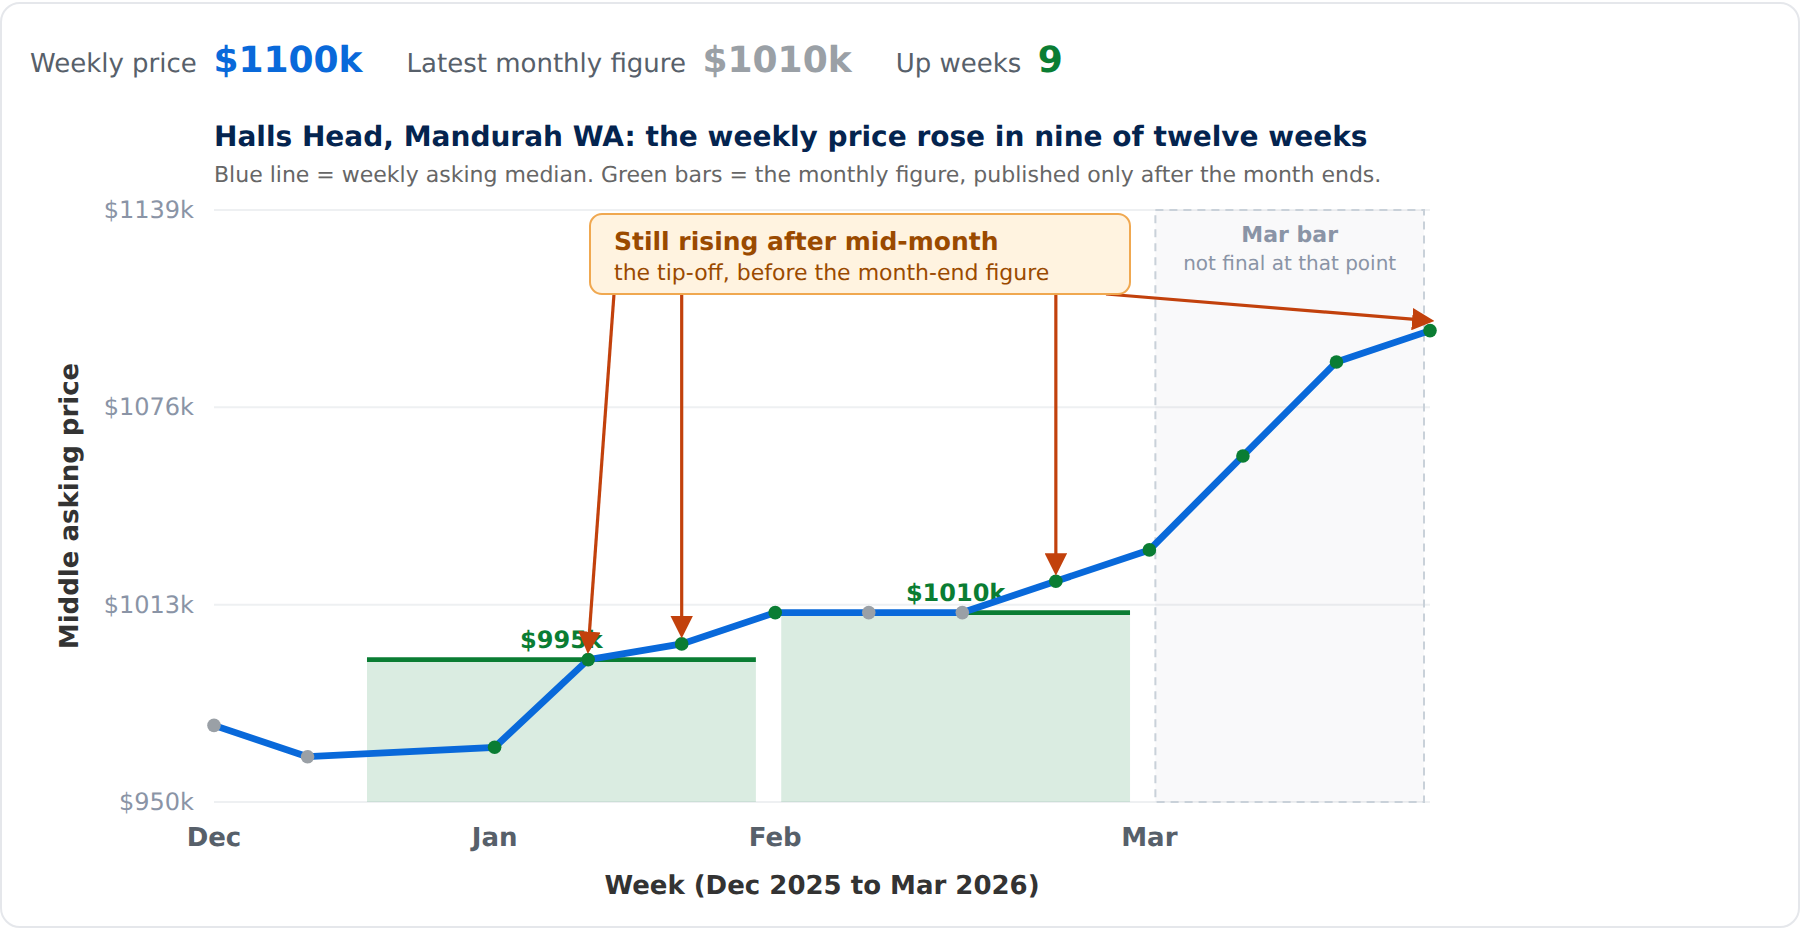
March 2026 example: Halls Head. The blue weekly line shows the climb as it formed. The green bars show the same asking-price measure once per completed month.
The March 2026 pattern is not confined to one suburb. Over the same ten-week window, a number of suburbs across the country climbed steadily on the weekly measure. The table below shows their weekly middle-price moves over the ten weeks to late March 2026.
| Suburb | Area | Weekly middle price, over the 10 weeks to late March 2026 |
|---|---|---|
| Halls Head | Mandurah, WA | $967,000 → $1,100,000 |
| Mango Hill | Brisbane, Qld | $934,000 → $1,080,000 |
| The Range | Rockhampton, Qld | $735,000 → $860,000 |
| Upper Coomera | Gold Coast, Qld | $1,060,000 → $1,190,000 |
| Ballina | Northern Rivers, NSW | $882,000 → $992,000 |
Each of these would appear in a monthly series only after the relevant month closed. On the weekly measure the climb was visible week by week as it happened.
The advantage of the weekly read is timing. Updates through the month give a buyer more time to inspect, negotiate and offer before the next monthly figure is available. For a buyers agent, it is a way to show a client that a target pocket is moving now, with the weekly path rather than a single lagging number.
The same measure works in reverse. When a suburb stops climbing, the weekly path shows that flattening through the month, which is a prompt to investigate what changed before making an offer. A national headline cannot provide this, because it averages away the suburbs that are running and the suburbs that are cooling into a single figure.
Microburbs updates this weekly for every suburb in Australia, where most sources update monthly. The individual suburb report shows which weeks a given suburb moved.
This paper shows the signal on a handful of suburbs, from March 2026. Your suburb report shows yours, updated every week.
