A suburb average from last quarter cannot tell you which street to buy in. Microburbs shows you the street, updated weekly, with the forecast, the risks and the supply squeeze already worked out. Watch Luke open a report in eight minutes.
 By Luke Metcalfe, Founder & Chief Data Scientist, Microburbs · 19 August 2026
One buyer's agent spent half an hour in here and still could not tell what it was. Fair enough. So this is the whole thing, top to bottom, on Belmont North in New South Wales. No signup to watch it.
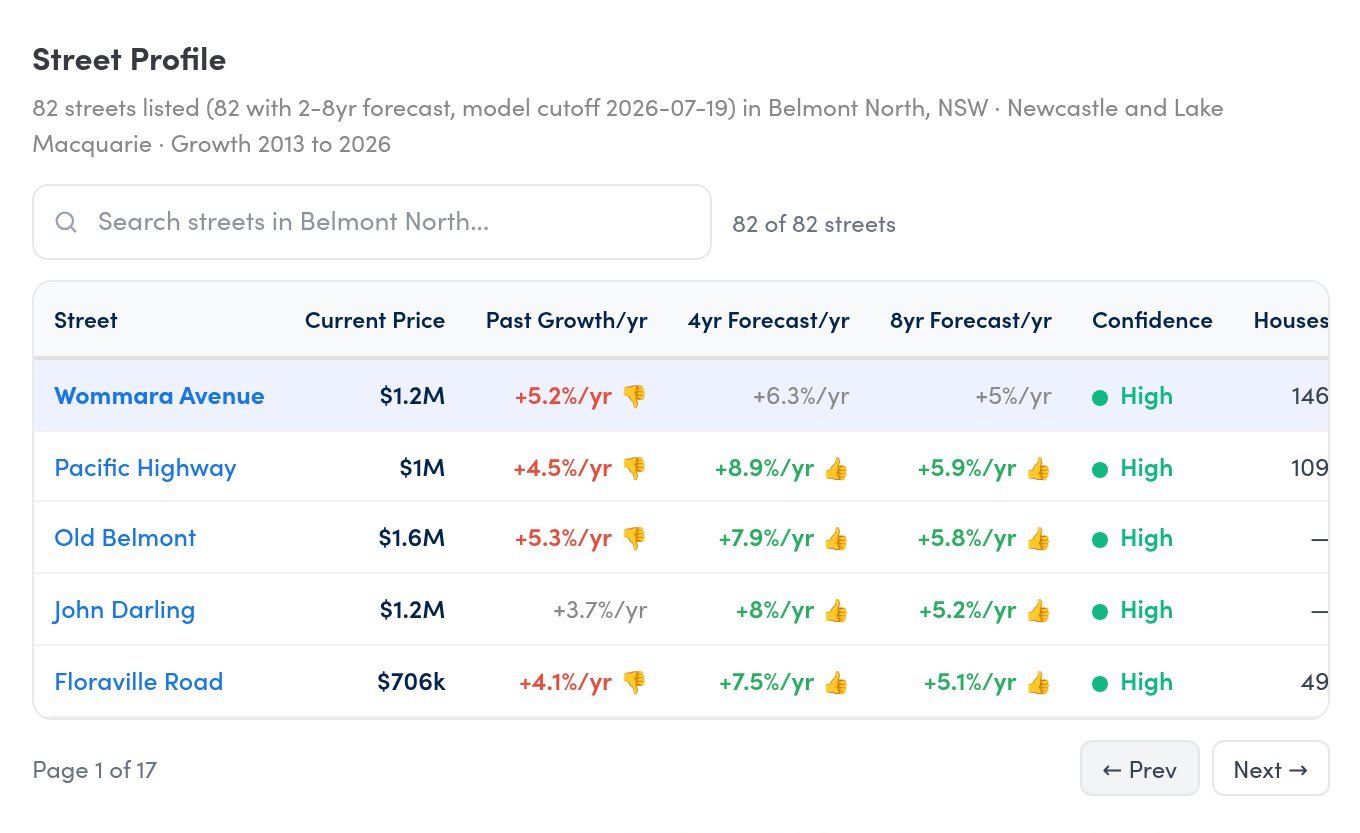
Every street, priced and forecast. In Belmont North the four-year street forecasts run from 1.9% a year above the 7% national average on Pacific Highway down to 0.7% below it on Wommara Avenue. Same suburb, more than 80 streets.
Risks down to the block. Flood, bushfire, noise, crime and landlord insurance. Crime is not spread evenly across a suburb: one corner of Belmont North sits well above the national rate while the rest sits below it.
What the council is about to build. Zoning, height limits, development applications and 32 separate council capital projects for Belmont North, each with its dollar amount and its stage.
A whole-suburb forecast is a blunt tool. So we forecast every street, four and eight years out, and rate our confidence in each. Each street forecast carries its own confidence rating, so you can see which calls we stand behind. Pacific Highway is forecast at 8.9% a year over the next four years, 1.9% a year above the 7% national average, and that call is rated High confidence.
Median prices with their 12-month growth to open. Then every street forecast, every risk, every pocket, the schools and the development, all in the one report. Buyers' agents say it best: you thought of everything.
Each figure carries its own date, so you always know how fresh the number in front of you is. In the Belmont North report the house median is dated 16 July 2026, the unit median, supply and vacancy 20 July 2026, the street forecasts 19 July 2026 and the development data 4 May 2026.
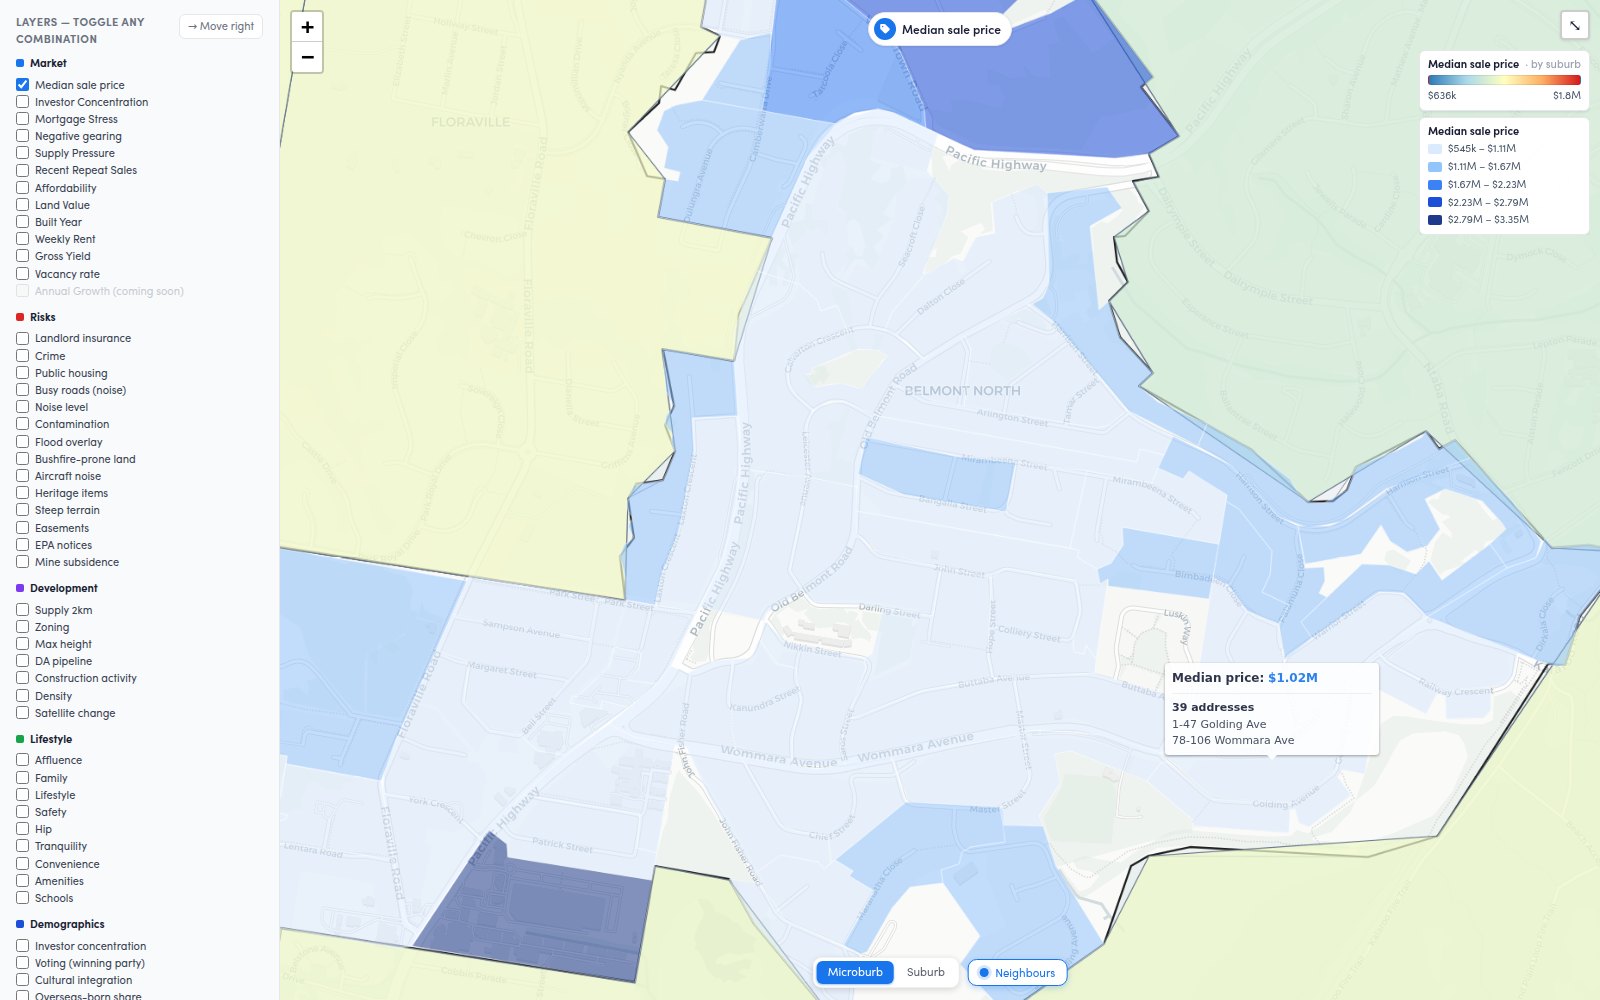
A suburb is not one market. Belmont North alone splits into 77 pockets, and we colour each one by its own median price, so you can tell the good side of the road from the ordinary one before you ever inspect.
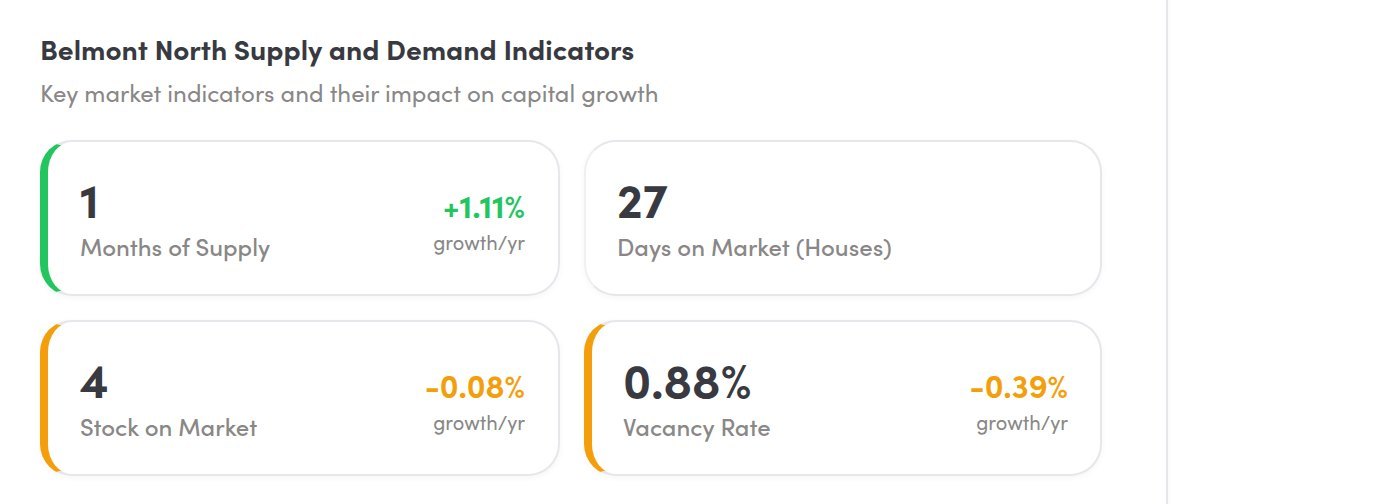
One month of stock and a vacancy rate under 1%. The report scores that tight supply as worth +1.1% a year in capital growth, and supply moves before prices do.
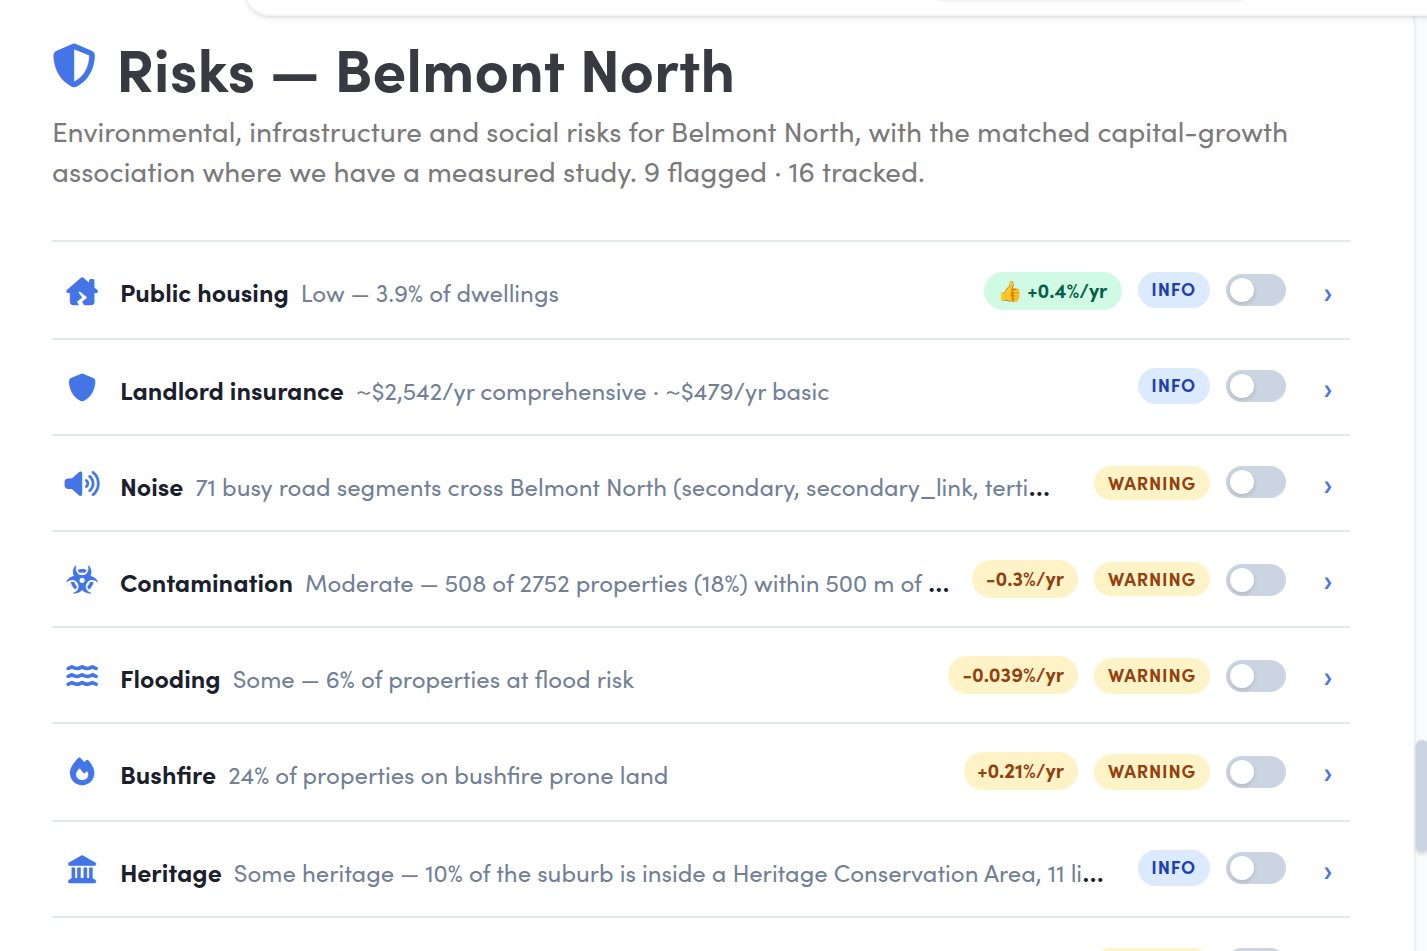
Flooding, bushfire, contamination, mine subsidence, noise, crime. We track sixteen risks, and for the flagged ones we show what they have historically done to capital growth. Nine of the sixteen are flagged in Belmont North.
Most weeks a suburb barely moves. Then in the week of 5 July 2026, Belmont North's median jumped 1.79% in seven days. The dated weekly series shows the move when it happened, instead of blending it into a quarterly average. The report re-cuts this series every week.
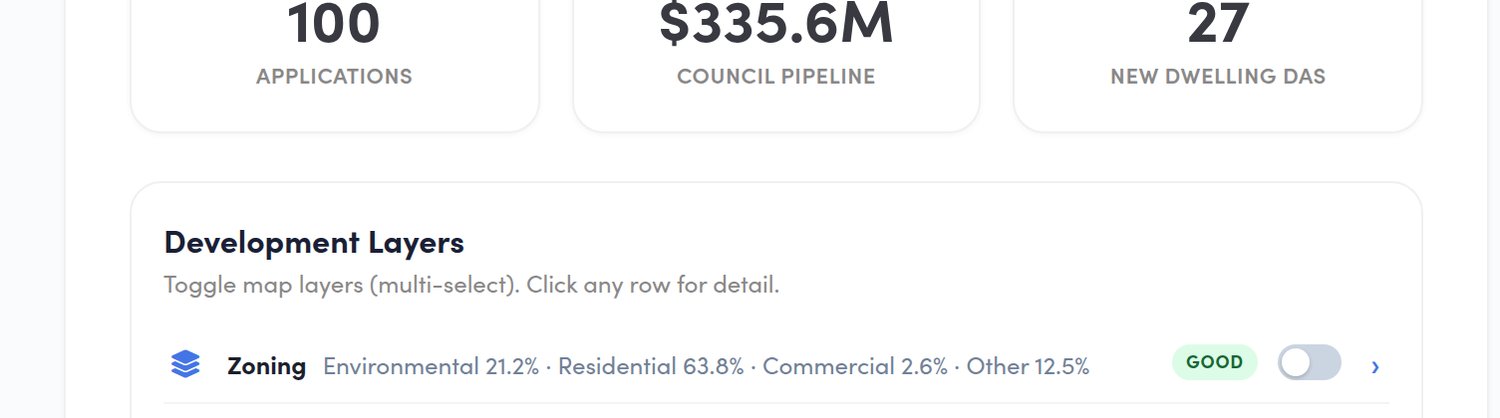
One hundred development applications and a $335.6 million council pipeline for Belmont North, from council data to 4 May 2026. New supply caps future growth, so you want to see it before you buy, not after.
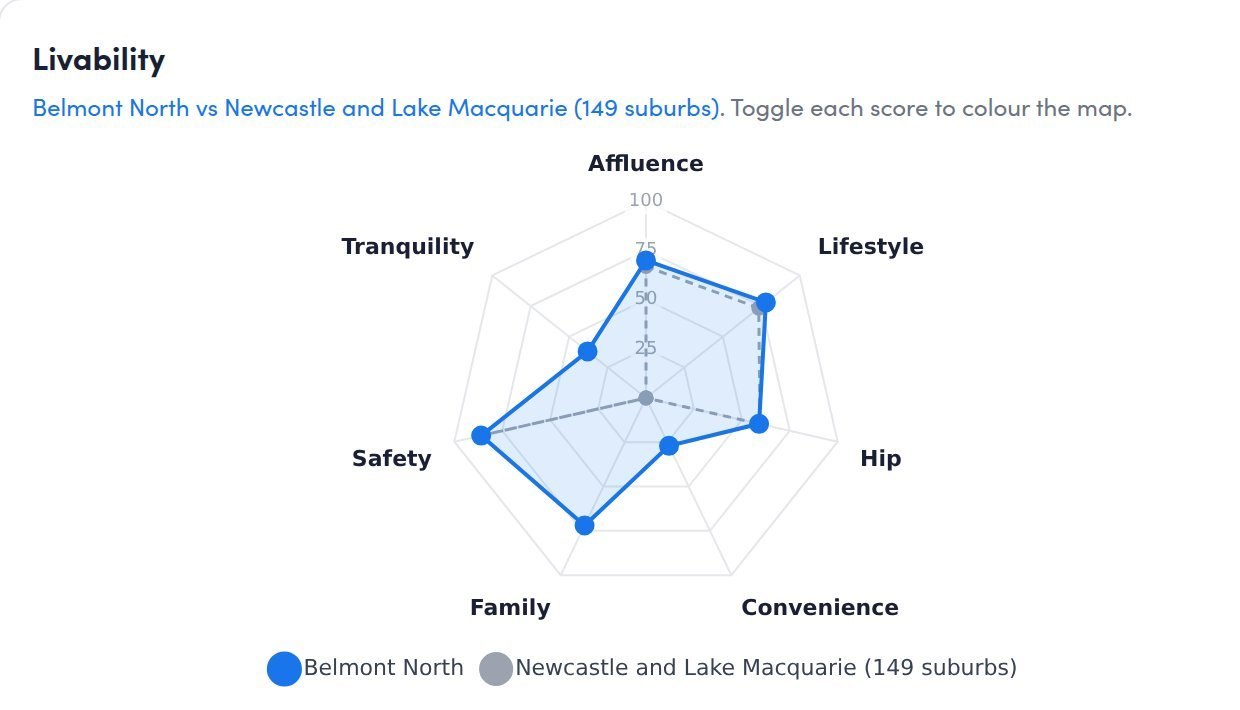
Areas with more owner-occupiers tend to grow harder, because owners overpay for a home they love. Every livability driver is rated against the suburbs around it rather than the whole country, so a score means something local.
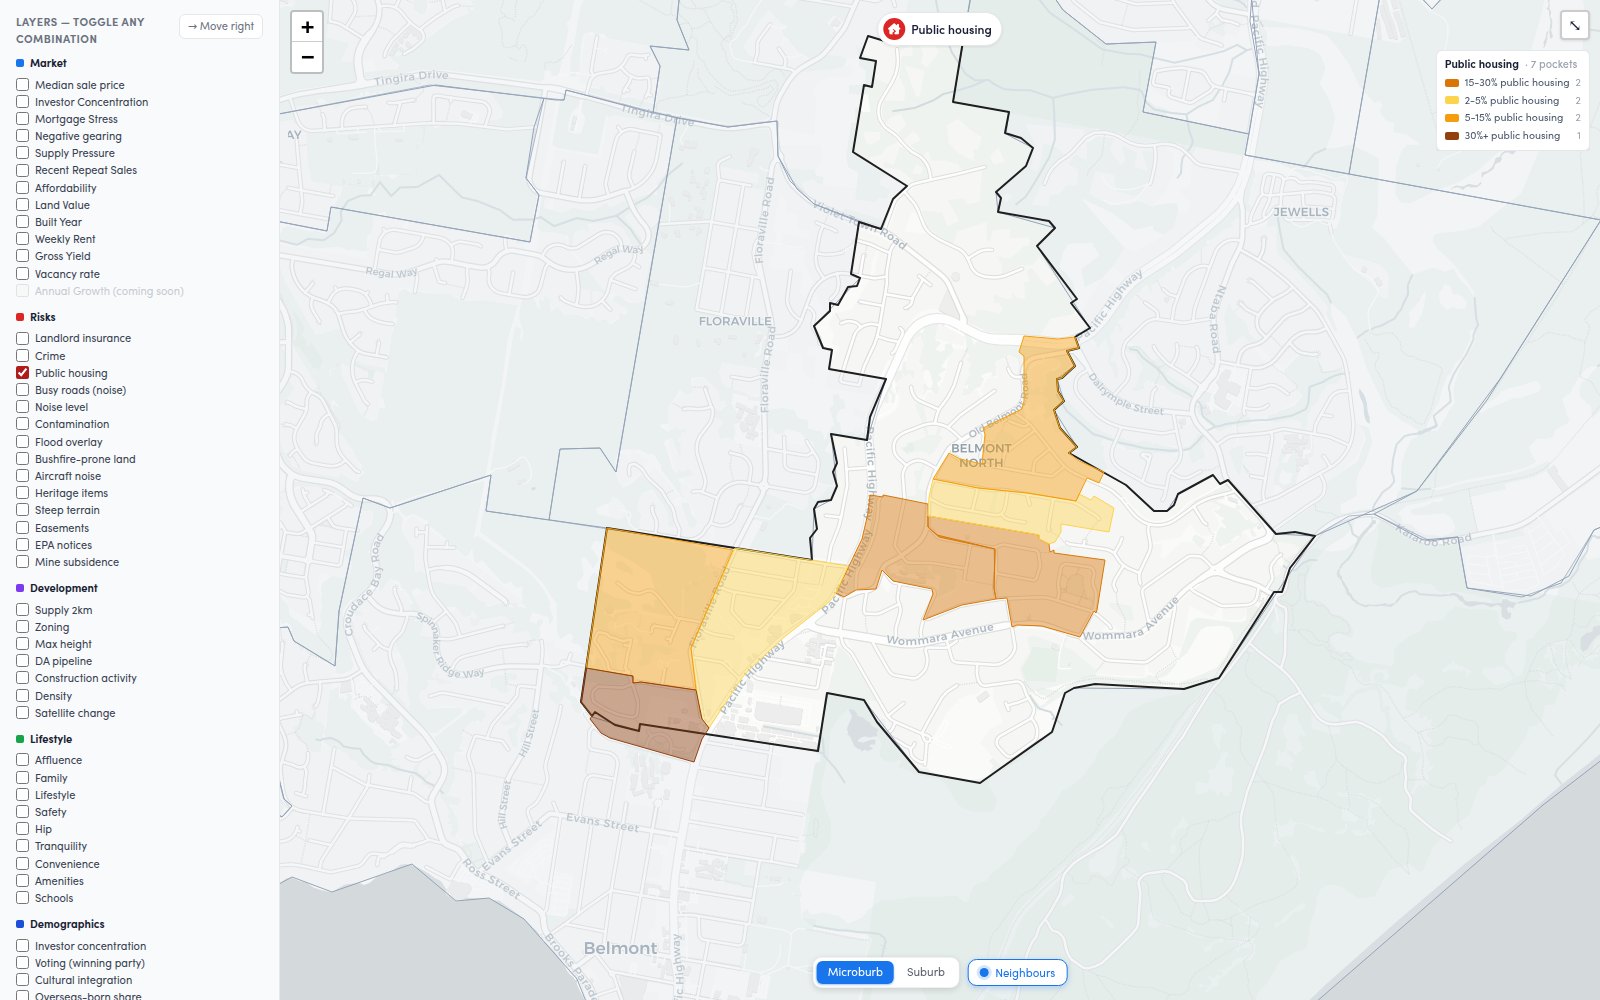
Public housing, flood, crime, noise, zoning, schools, supply and more. Switch the layer to whatever you are weighing up, and click through to any suburb.
Remove the sections your client does not need, add your branding and send one link. Investors and buyers' agents run their shortlists on it.
Every Australian suburb's snapshot is free to open. Subscribe for the street-level forecasts, the risks and the map you just saw.
