A portal shows you the advertisement. We show you the property, the street, and every house around it.
 By Luke Metcalfe, Chief Data Scientist and Founder, Microburbs · 19 August 2026
You have found the house. The photos look good, the agent is confident, and the price is at the top of your range. What you cannot see from the listing is the street it sits on, who lives around it, or what the council is about to build two blocks away.
That is the gap a property report fills. It covers one address, not the suburb average, and it is the last piece of homework before you bid.
Most sites either hide the risks or list them without telling you whether they matter. We show all of them, and next to each one, what it has historically done to capital growth.
For one house in Belmont North, New South Wales: mine subsidence across the whole district, worth +0.2% a year. Bushfire prone land under 24% of properties, +0.21% a year. Flooding on 6% of them, -0.039% a year. Contamination within 500 metres of a known site for 18% of properties, -0.3% a year. Crime 19% below the national median. Nine risks flagged, seventeen tracked, each one you can switch onto the map.
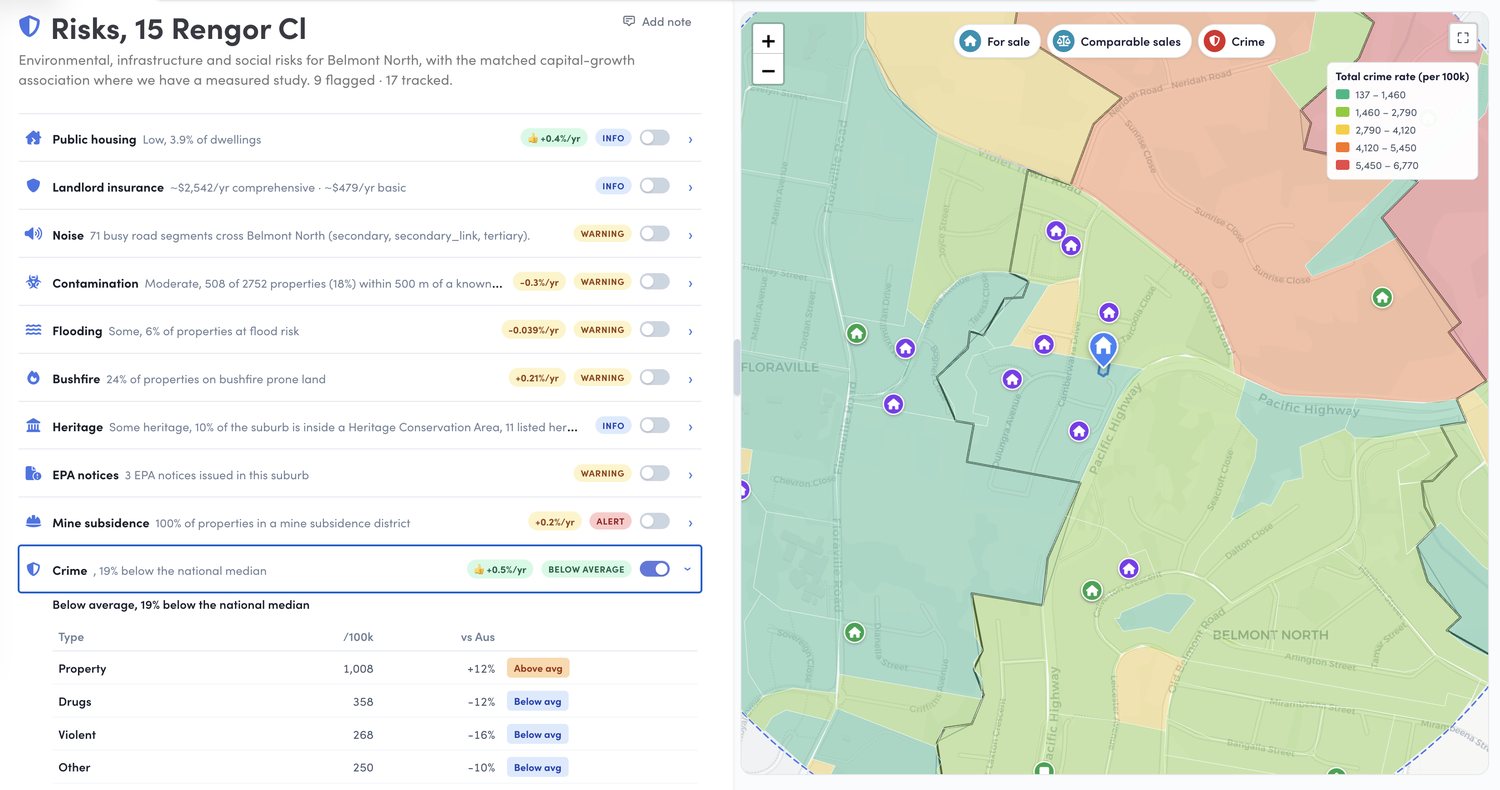
A plus means that factor has gone with faster growth than the market, a minus with slower, so you can see at a glance whether something is a real problem here or just noise. Honesty is the feature. We also tell you which risks do not matter where you are looking.
Every block around the house, coloured by who most likely lives there: owner-occupied, rented, or public housing, plus whatever is on the market right now.
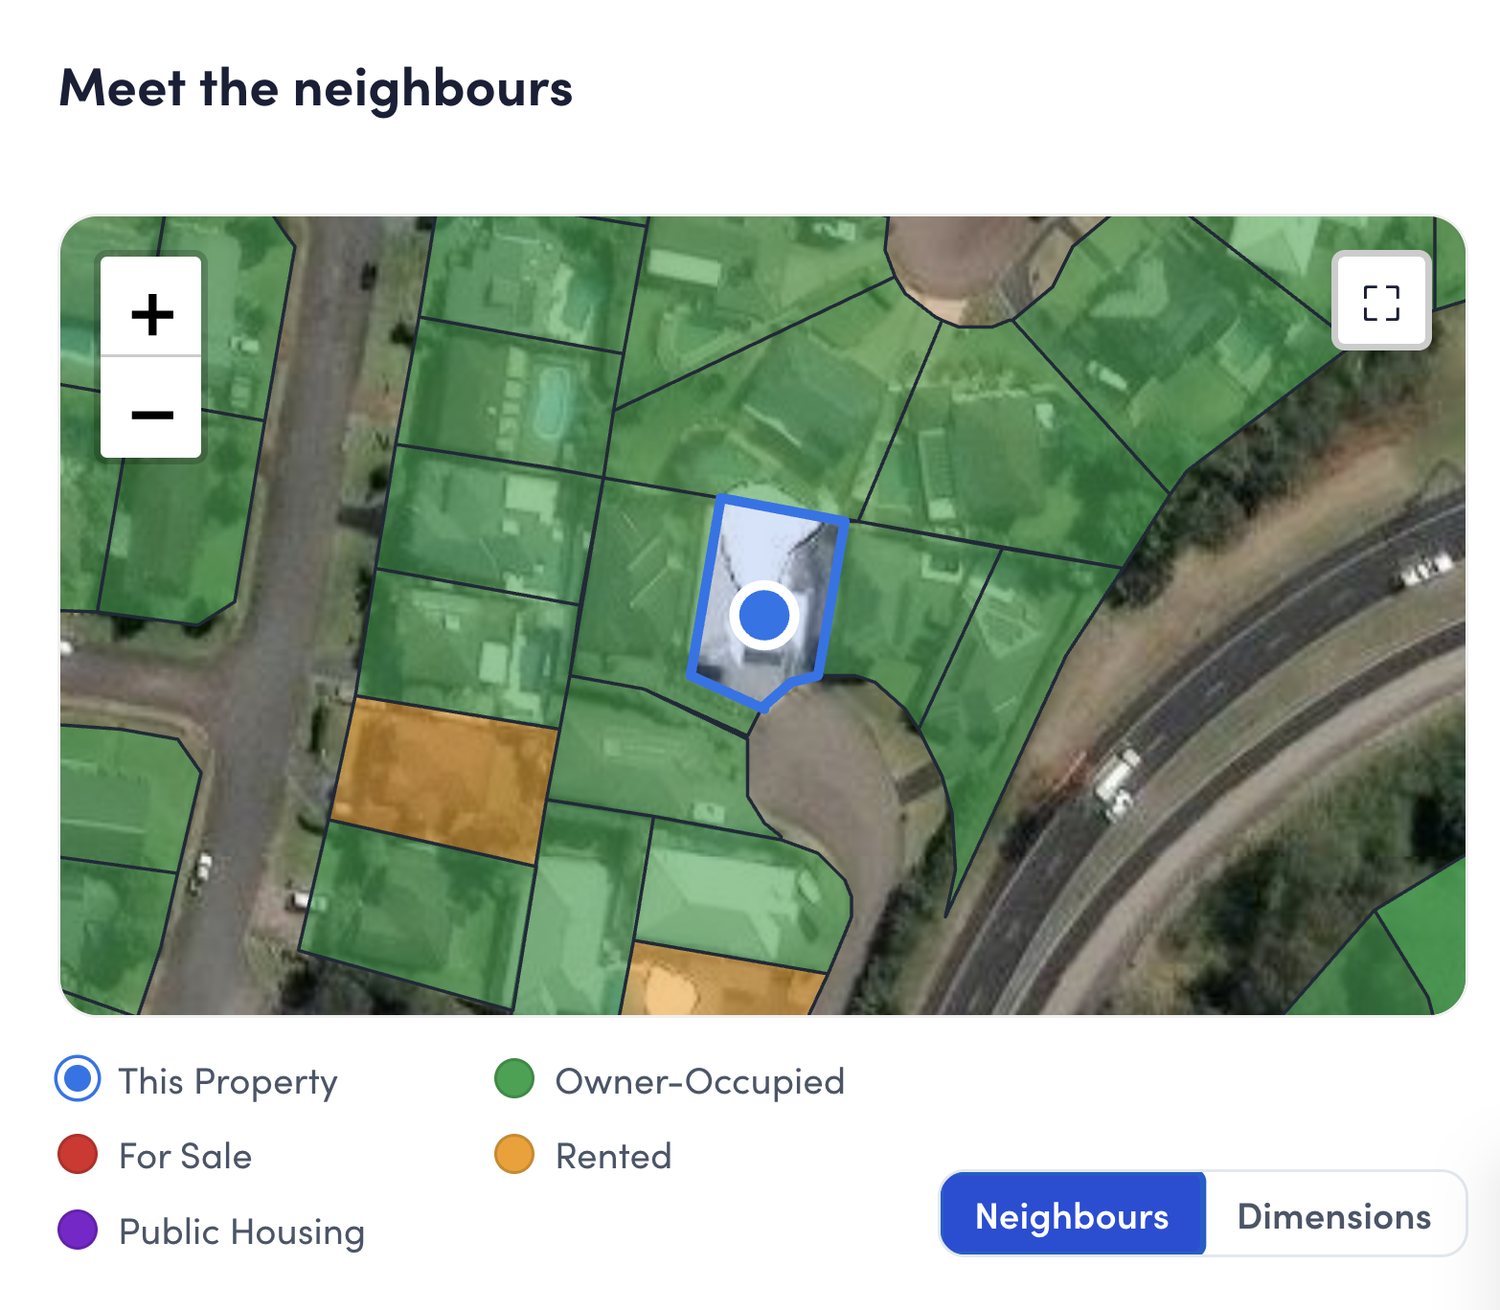
This is the section customers bring up on their own, and no portal shows it. Streets that shift from owners to renters tend to grow more slowly, so it changes what a house is worth to you before you bid.
Ten recent sales chosen on bedrooms, land size, age and distance rather than a suburb boundary. Each one carries its photo, what it sold for, and what it is worth now.
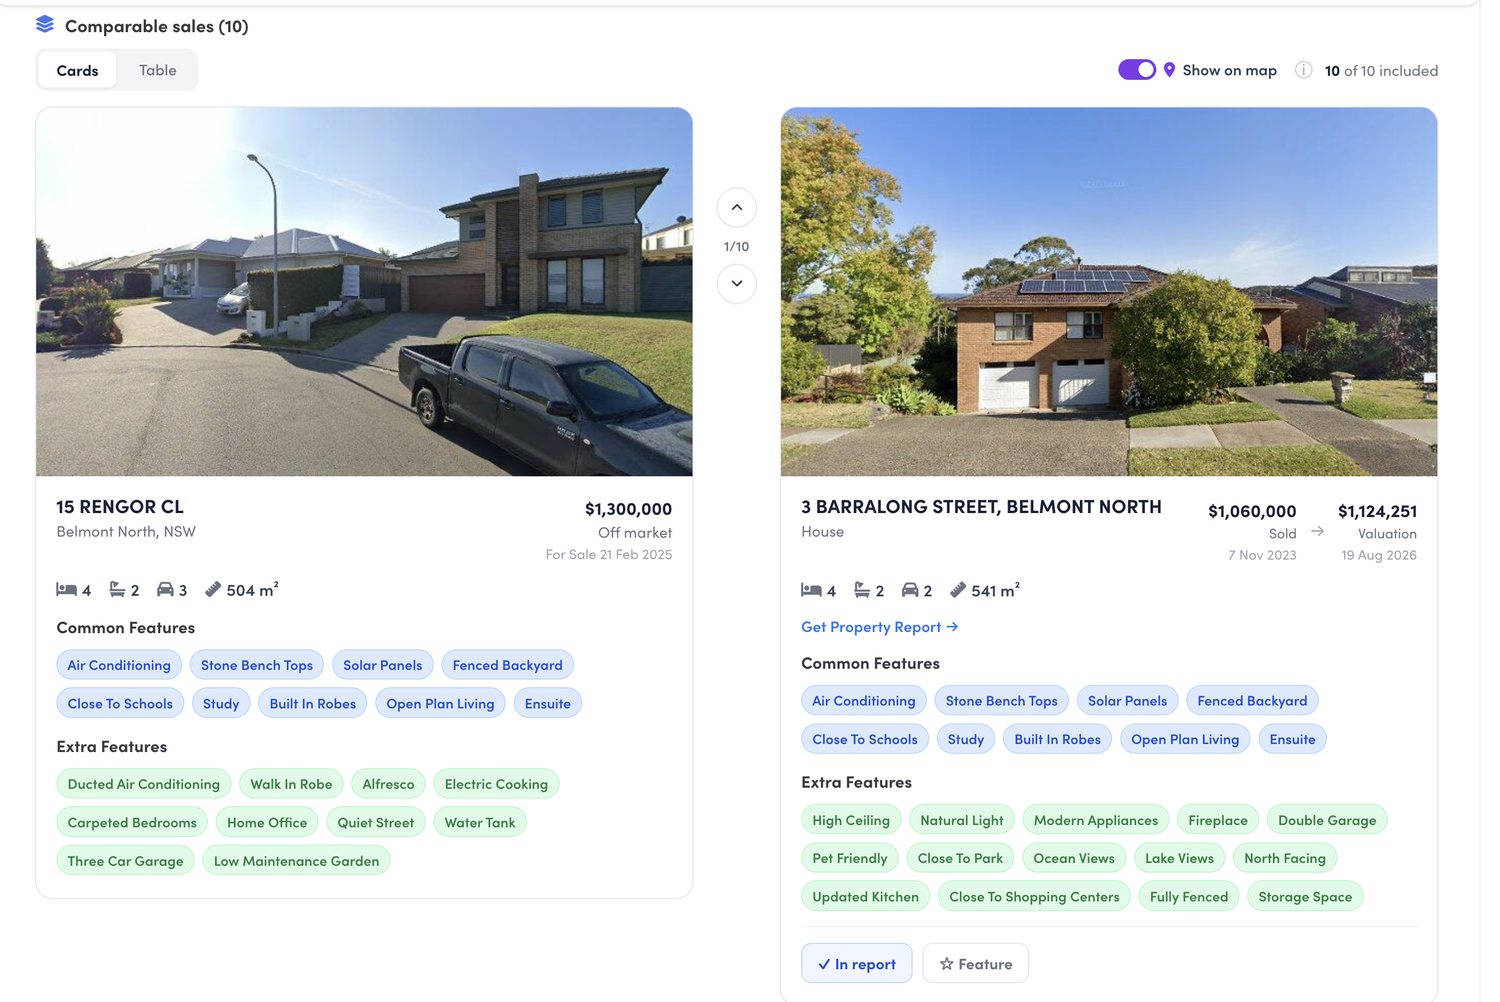
3 Barralong Street in Belmont North, New South Wales sold for $1,060,000 in November 2023 and is valued at $1,124,251 as at August 2026. The features it shares with the subject property are listed, so you can see why it counts as comparable, and you can drop any of them out before you hand the report to a client.
We do suburbs too, but two streets in one suburb can pull years apart in price. So we forecast the street.
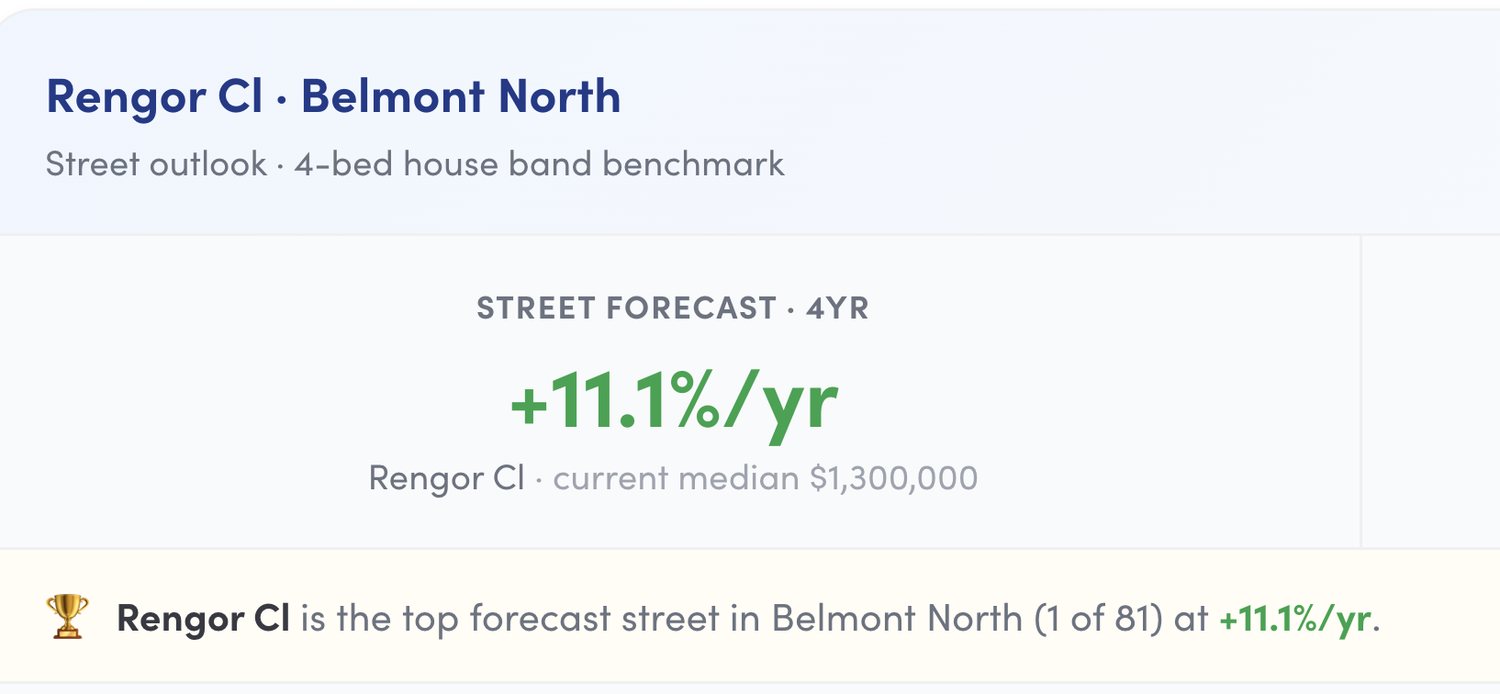
Rengor Close is the top forecast street in Belmont North, New South Wales, first of 81, at +11.1% a year over the four years ahead against about +6.6% a year for the suburb as a whole. Buying on the wrong street in the right suburb is the mistake this catches.
Thirty-two funded projects worth $335.6 million around this one property, read out of council minutes across roughly 520 councils. $105.9 million of capital works, $50 million on roads, $35.2 million on road rehabilitation.
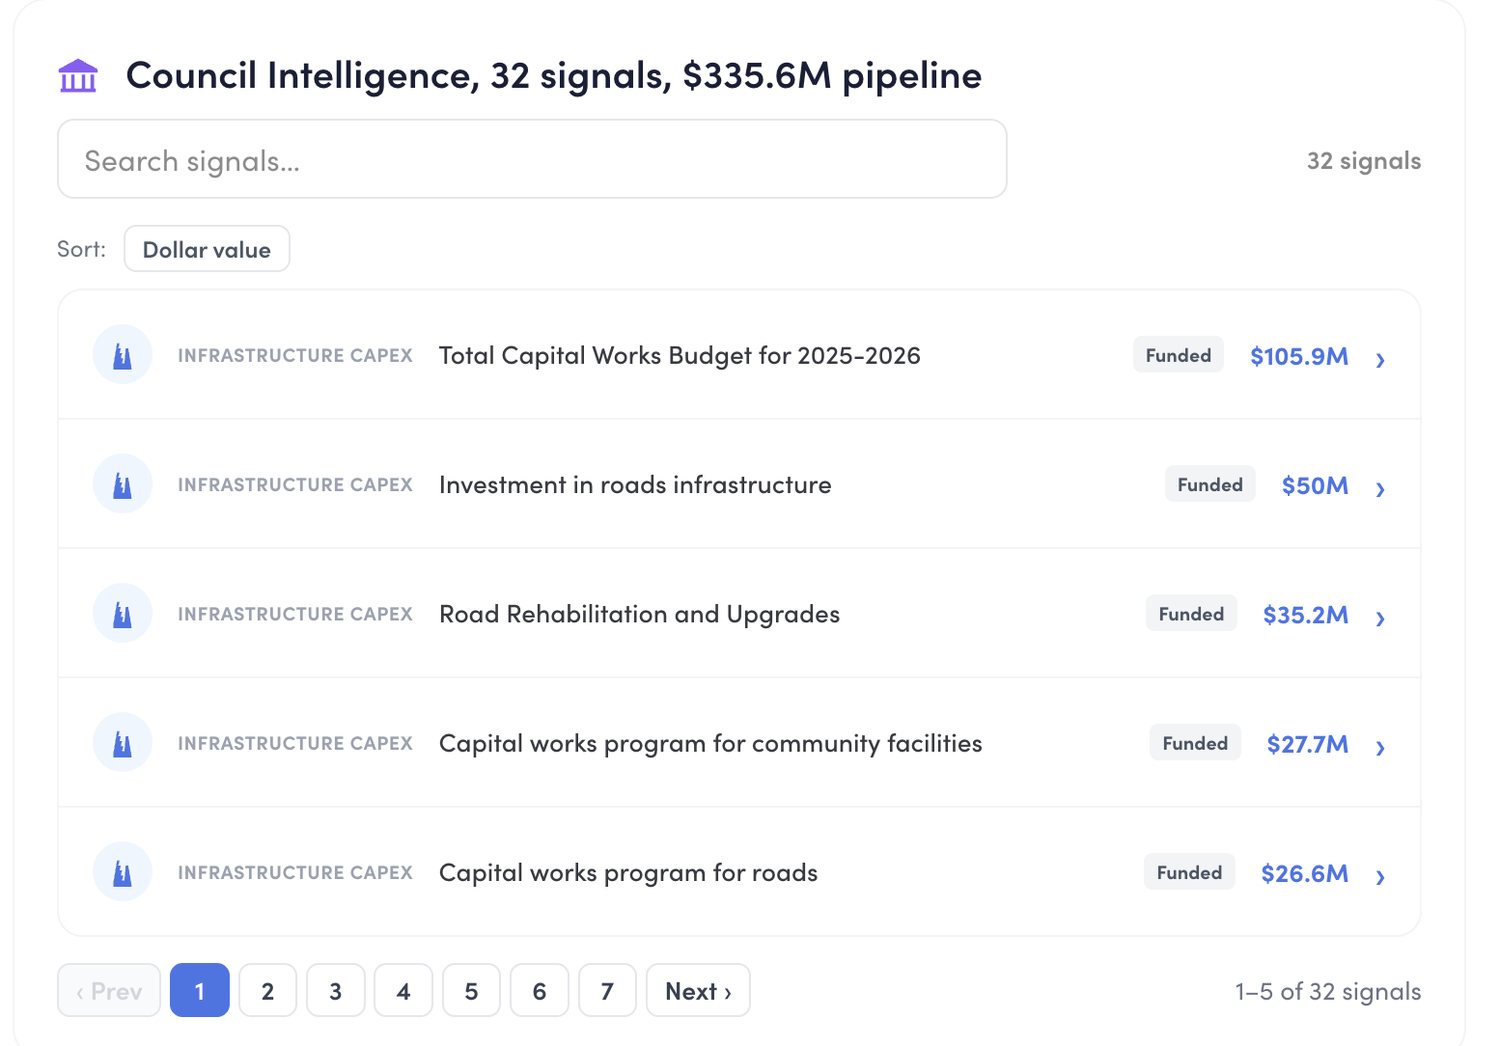
Roads and parks tend to lift prices. Schools and hospitals do not. Knowing which is coming is worth more than knowing something is coming.
Off-market listings. Properties that never reach the big portals feed the reports and the finder.
A report for any address. Not just homes for sale. Any property in the country.
Follow a property. Save one and we tell you when the asking price moves or an inspection is added.
Yours to hand a client. Share a live link, tick sections in or out, put your own logo on it, add your notes, export a PDF.
Run the address before you bid, not after. Read the risks first, because that is where the surprises are, then the neighbours, then the comparable sales. If the street forecast and the suburb forecast disagree, trust the street.
For buyers agents: the report is built to be handed over. White label it, add your own notes against the sections your client cares about, and send them the live link rather than a PDF that goes stale.
Any address in the country, whether or not it is for sale. Buyers agents can white label it, add their own notes and hand the live link to a client.
