The whole walkthrough, start to finish. One house for sale in Bullaburra in Sydney's Blue Mountains, and every number we would use to decide on it. Our top five suburbs have finished about $61,000 ahead of the average $750,000 house over the two years after each growth prediction.
 By Luke Metcalfe · Founder, Microburbs Research
You have read the lists. A magazine names ten suburbs, a podcast names three more, and not one of them shows you what the same list said two years ago. By the time a place is on the list, the growth has happened and you are the exit liquidity.
The only thing worth looking at is a growth prediction that was printed before the result, and then scored against what actually happened. That is what this video shows, and then it shows you the tool doing it live on a real address.
This is the members session run by buyers agent John Manciameli in September 2026, in the order it happened. It answers the questions the room asked, then starts with the record, picks a suburb, drills to a street, and ends on a specific house that was on the market that week. Twenty six minutes, dead air removed.
Source: Microburbs
Every growth prediction the forecast would have made from 2013 onwards was scored against what actually happened, on data it had never seen. Each one is judged on the two years that followed it, so the results run through to 2026. Not a story told afterwards.
The five suburbs it named each month finished +7.3% above the national average over the two years after each growth prediction, which is about $61,000 on an average $750,000 house. 8 in 10 of those monthly growth predictions finished ahead of the national average, and the number-one suburb each month finished +8.7% above it over the same two-year windows.
Both are suburbs we printed in a January 2025 region report, scored against recorded sales to June 2026. They show what a working growth prediction looks like on the ground.
Named in our January 2025 Toowoomba report. The median house there was $845,000 before the prediction and $990,000 by June 2026, across 169 sales after the prediction. That put it about +8% ahead of the national market in the 17 months from the prediction to June 2026.
Chosen as a well-supplied example. 169 sales after the prediction is one of the deepest samples in the group, so the number is not one odd trade.
Also named in January 2025. The median house was $490,000 before the prediction and $570,500 by June 2026, across 116 sales. That is about +8% ahead of the national market over the same 17 months, on a house you could still buy under $600,000.
Chosen as the affordable example. It shows the edge is not confined to expensive markets.
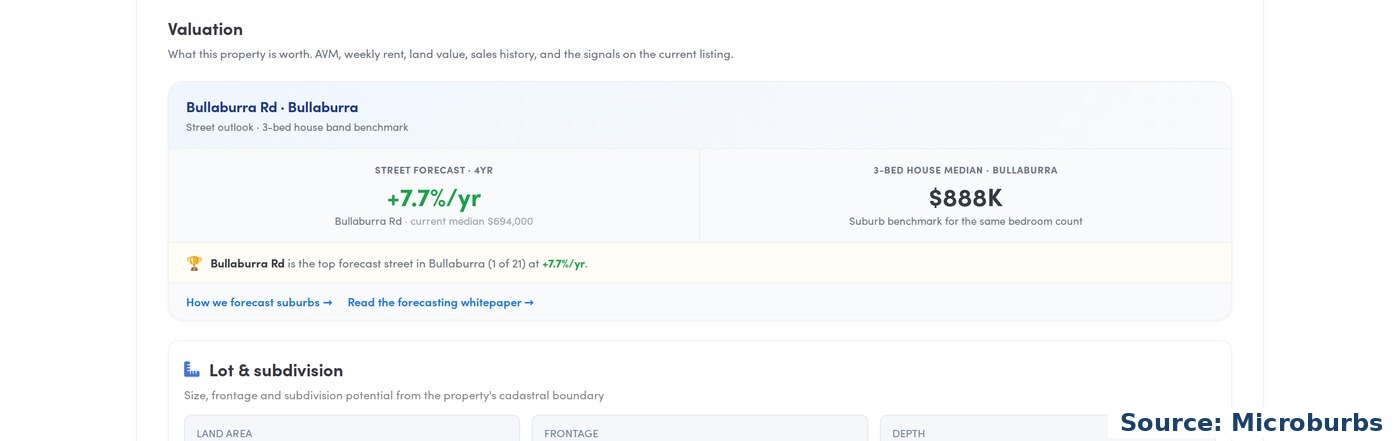
The video ends on Bullaburra (Blue Mountains, NSW), on a three bedroom house listed at $775,000. The ten most similar homes nearby sold between $700,000 and $840,000, and the median three bedroom house in the suburb is $888,000. So the asking price is inside the range and under the suburb benchmark, which is the first thing you want to know. Here is the part of that report where the decision gets made.
| What the report shows | On this address, as at September 2026 | What you do with it |
|---|---|---|
| How much is for sale, and how fast it goes | One month of stock on the market, 44 days to sell | A tight market, which the report counts as a positive for growth here |
| Homes that sold, and then sold again | 401 of these homes have sold twice on record. 12% of those owners sold for less than they paid | What owners here actually walked away with, not what agents asked |
| Bushfire | 86% of properties on bushfire prone land | Get an insurance quote before you bid, not after |
| Contamination | 383 of the suburb's 823 properties sit within 500 m of a known site | Ask what the site was, and check it against the price |
| Who owns the street | 95% of the investors in that pocket are negatively geared, as at September 2026 | If negative gearing rules move, this pocket has more forced sellers than most |
| What is being built | 68 applications lodged, 19 new dwellings approved | Homes about to compete with yours. This is the row we walked away on |
That last row is the one that made us walk away from this house in the video. You would not find it on a listing.
| The number | What it is | Where it comes from |
|---|---|---|
| +7.3% | How far the five suburbs named each month finished above the national average over the two years after each growth prediction | Every month from 2013 onwards, results running to 2026, scored on data the forecast never saw |
| $61,000 | What that edge is worth on an average $750,000 house over those two years | The same test, converted to dollars |
| 8 in 10 | Share of those monthly growth predictions that finished ahead of the national average | The same test |
| +8.7% | The number-one suburb each month, above the national average | The same test |
| Highfields $845,000 to $990,000 | Median house before the prediction and at 21 June 2026, across 169 sales after it | Recorded sales, Toowoomba, Qld |
| Eaglehawk $490,000 to $570,500 | Median house before the prediction and at 21 June 2026, across 116 sales after it | Recorded sales, Bendigo, Vic. |
| $775,000 | The asking price on the house in the video | The live listing, September 2026 |
| $700,000 to $840,000 | What the ten most similar nearby homes sold for | Recorded sales near 11 Bullaburra Road |
| $888,000 | The median three bedroom house in the suburb | Recorded sales, Bullaburra, NSW |
The suburb list itself stays in the reports. Source: Microburbs
Use the forecast to build the shortlist, then use the report to vet it. Three steps, in this order.
If you are a buyers agent, this is the part clients pay you for and cannot do themselves. The report is the evidence you put in front of them.
Microburbs has been measuring what drives capital growth since 2013. The record above comes from scoring growth predictions made before the result, never from picking winners out of the history afterwards. The reports cover every suburb in Australia.
Check what the forecast says about it, before your next inspection.
